Races in St. Petersburg, Florida (FL) Detailed Stats
Data:
Races - White alone (%)
Races - White alone (% change since 2000)
Races - Black alone (%)
Races - Black alone (% change since 2000)
Races - American Indian alone (%)
Races - American Indian alone (% change since 2000)
Races - Asian alone (%)
Races - Asian alone (% change since 2000)
Races - Hispanic (%)
Races - Hispanic (% change since 2000)
Races - Native Hawaiian and Other Pacific Islander alone (%)
Races - Native Hawaiian and Other Pacific Islander alone (% change since 2000)
Races - Two or more races(%)
Races - Two or more races(% change since 2000)
Races - Other race alone (%)
Races - Other race alone (% change since 2000)
Racial diversity
Place of birth - Born in state of residence (%)
Place of birth - Born in state of residence (%) - White
Place of birth - Born in state of residence (%) - Black or African American
Place of birth - Born in state of residence (%) - Asian
Place of birth - Born in state of residence (%) - Hispanic or Latino
Place of birth - Born in state of residence (%) - American Indian and Alaska Native
Place of birth - Born in state of residence (%) - Multirace
Place of birth - Born in state of residence (%) - Other Race
Place of birth - Born in other state (%)
Place of birth - Born in other state (%) - White
Place of birth - Born in other state (%) - Black or African American
Place of birth - Born in other state (%) - Asian
Place of birth - Born in other state (%) - Hispanic or Latino
Place of birth - Born in other state (%) - American Indian and Alaska Native
Place of birth - Born in other state (%) - Multirace
Place of birth - Born in other state (%) - Other Race
Place of birth - Native, outside of US (%)
Place of birth - Native, outside of US (%) - White
Place of birth - Native, outside of US (%) - Black or African American
Place of birth - Native, outside of US (%) - Asian
Place of birth - Native, outside of US (%) - Hispanic or Latino
Place of birth - Native, outside of US (%) - American Indian and Alaska Native
Place of birth - Native, outside of US (%) - Multirace
Place of birth - Native, outside of US (%) - Other Race
Place of birth - Foreign born (%)
Place of birth - Foreign born (%) - White
Place of birth - Foreign born (%) - Black or African American
Place of birth - Foreign born (%) - Asian
Place of birth - Foreign born (%) - Hispanic or Latino
Place of birth - Foreign born (%) - American Indian and Alaska Native
Place of birth - Foreign born (%) - Multirace
Place of birth - Foreign born (%) - Other Race
Residents speaking English at home (%)
Residents speaking English at home - Born in the United States (%)
Residents speaking English at home - Native, born elsewhere (%)
Residents speaking English at home - Foreign born (%)
Residents speaking Spanish at home (%)
Residents speaking Spanish at home - Born in the United States (%)
Residents speaking Spanish at home - Native, born elsewhere (%)
Residents speaking Spanish at home - Foreign born (%)
Residents speaking other language at home (%)
Residents speaking other language at home - Born in the United States (%)
Residents speaking other language at home - Native, born elsewhere (%)
Residents speaking other language at home - Foreign born (%)
Marital status - Never married (%)
Marital status - Now married (%)
Marital status - Separated (%)
Marital status - Widowed (%)
Marital status - Divorced (%)
Ancestries Reported - Arab (%)
Ancestries Reported - Czech (%)
Ancestries Reported - Danish (%)
Ancestries Reported - Dutch (%)
Ancestries Reported - English (%)
Ancestries Reported - French (%)
Ancestries Reported - French Canadian (%)
Ancestries Reported - German (%)
Ancestries Reported - Greek (%)
Ancestries Reported - Hungarian (%)
Ancestries Reported - Irish (%)
Ancestries Reported - Italian (%)
Ancestries Reported - Lithuanian (%)
Ancestries Reported - Norwegian (%)
Ancestries Reported - Polish (%)
Ancestries Reported - Portuguese (%)
Ancestries Reported - Russian (%)
Ancestries Reported - Scotch-Irish (%)
Ancestries Reported - Scottish (%)
Ancestries Reported - Slovak (%)
Ancestries Reported - Subsaharan African (%)
Ancestries Reported - Swedish (%)
Ancestries Reported - Swiss (%)
Ancestries Reported - Ukrainian (%)
Ancestries Reported - United States (%)
Ancestries Reported - Welsh (%)
Ancestries Reported - West Indian (%)
Ancestries Reported - Other (%)
Geographical mobility - Same house 1 year ago (%)
Geographical mobility - Same house 1 year ago (%) - White
Geographical mobility - Same house 1 year ago (%) - Black or African American
Geographical mobility - Same house 1 year ago (%) - Asian
Geographical mobility - Same house 1 year ago (%) - Hispanic or Latino
Geographical mobility - Same house 1 year ago (%) - American Indian and Alaska Native
Geographical mobility - Same house 1 year ago (%) - Multirace
Geographical mobility - Same house 1 year ago (%) - Other Race
Geographical mobility - Moved within same county (%)
Geographical mobility - Moved within same county (%) - White
Geographical mobility - Moved within same county (%) - Black or African American
Geographical mobility - Moved within same county (%) - Asian
Geographical mobility - Moved within same county (%) - Hispanic or Latino
Geographical mobility - Moved within same county (%) - American Indian and Alaska Native
Geographical mobility - Moved within same county (%) - Multirace
Geographical mobility - Moved within same county (%) - Other Race
Geographical mobility - Moved from different county within same state (%)
Geographical mobility - Moved from different county within same state (%) - White
Geographical mobility - Moved from different county within same state (%) - Black or African American
Geographical mobility - Moved from different county within same state (%) - Asian
Geographical mobility - Moved from different county within same state (%) - Hispanic or Latino
Geographical mobility - Moved from different county within same state (%) - American Indian and Alaska Native
Geographical mobility - Moved from different county within same state (%) - Multirace
Geographical mobility - Moved from different county within same state (%) - Other Race
Geographical mobility - Moved from different state (%)
Geographical mobility - Moved from different state (%) - White
Geographical mobility - Moved from different state (%) - Black or African American
Geographical mobility - Moved from different state (%) - Asian
Geographical mobility - Moved from different state (%) - Hispanic or Latino
Geographical mobility - Moved from different state (%) - American Indian and Alaska Native
Geographical mobility - Moved from different state (%) - Multirace
Geographical mobility - Moved from different state (%) - Other Race
Geographical mobility - Moved from abroad (%)
Geographical mobility - Moved from abroad (%) - White
Geographical mobility - Moved from abroad (%) - Black or African American
Geographical mobility - Moved from abroad (%) - Asian
Geographical mobility - Moved from abroad (%) - Hispanic or Latino
Geographical mobility - Moved from abroad (%) - American Indian and Alaska Native
Geographical mobility - Moved from abroad (%) - Multirace
Geographical mobility - Moved from abroad (%) - Other Race
Place of birth for the foreign-born population - Ireland (%)
Place of birth for the foreign-born population - Denmark (%)
Place of birth for the foreign-born population - Norway (%)
Place of birth for the foreign-born population - Sweden (%)
Place of birth for the foreign-born population - United Kingdom (%)
Place of birth for the foreign-born population - England (%)
Place of birth for the foreign-born population - Scotland (%)
Place of birth for the foreign-born population - Other Northern Europe (%)
Place of birth for the foreign-born population - Austria (%)
Place of birth for the foreign-born population - Belgium (%)
Place of birth for the foreign-born population - France (%)
Place of birth for the foreign-born population - Germany (%)
Place of birth for the foreign-born population - Netherlands (%)
Place of birth for the foreign-born population - Switzerland (%)
Place of birth for the foreign-born population - Other Western Europe (%)
Place of birth for the foreign-born population - Greece (%)
Place of birth for the foreign-born population - Italy (%)
Place of birth for the foreign-born population - Portugal (%)
Place of birth for the foreign-born population - Spain (%)
Place of birth for the foreign-born population - Other Southern Europe (%)
Place of birth for the foreign-born population - Albania (%)
Place of birth for the foreign-born population - Belarus (%)
Place of birth for the foreign-born population - Bosnia and Herzegovina (%)
Place of birth for the foreign-born population - Bulgaria (%)
Place of birth for the foreign-born population - Croatia (%)
Place of birth for the foreign-born population - Czechoslovakia (%)
Place of birth for the foreign-born population - Hungary (%)
Place of birth for the foreign-born population - Latvia (%)
Place of birth for the foreign-born population - Lithuania (%)
Place of birth for the foreign-born population - North Macedonia (Macedonia) (%)
Place of birth for the foreign-born population - Moldova (%)
Place of birth for the foreign-born population - Poland (%)
Place of birth for the foreign-born population - Romania (%)
Place of birth for the foreign-born population - Russia (%)
Place of birth for the foreign-born population - Serbia (%)
Place of birth for the foreign-born population - Ukraine (%)
Place of birth for the foreign-born population - Other Eastern Europe (%)
Place of birth for the foreign-born population - China (%)
Place of birth for the foreign-born population - Hong Kong (%)
Place of birth for the foreign-born population - Taiwan (%)
Place of birth for the foreign-born population - Japan (%)
Place of birth for the foreign-born population - Korea (%)
Place of birth for the foreign-born population - Other Eastern Asia (%)
Place of birth for the foreign-born population - Afghanistan (%)
Place of birth for the foreign-born population - Bangladesh (%)
Place of birth for the foreign-born population - India (%)
Place of birth for the foreign-born population - Iran (%)
Place of birth for the foreign-born population - Kazakhstan (%)
Place of birth for the foreign-born population - Nepal (%)
Place of birth for the foreign-born population - Pakistan (%)
Place of birth for the foreign-born population - Sri Lanka (%)
Place of birth for the foreign-born population - Uzbekistan (%)
Place of birth for the foreign-born population - Other South Central Asia (%)
Place of birth for the foreign-born population - Burma (%)
Place of birth for the foreign-born population - Cambodia (%)
Place of birth for the foreign-born population - Indonesia (%)
Place of birth for the foreign-born population - Laos (%)
Place of birth for the foreign-born population - Malaysia (%)
Place of birth for the foreign-born population - Philippines (%)
Place of birth for the foreign-born population - Singapore (%)
Place of birth for the foreign-born population - Thailand (%)
Place of birth for the foreign-born population - Vietnam (%)
Place of birth for the foreign-born population - Other South Eastern Asia (%)
Place of birth for the foreign-born population - Armenia (%)
Place of birth for the foreign-born population - Iraq (%)
Place of birth for the foreign-born population - Israel (%)
Place of birth for the foreign-born population - Jordan (%)
Place of birth for the foreign-born population - Kuwait (%)
Place of birth for the foreign-born population - Lebanon (%)
Place of birth for the foreign-born population - Saudi Arabia (%)
Place of birth for the foreign-born population - Syria (%)
Place of birth for the foreign-born population - Turkey (%)
Place of birth for the foreign-born population - Yemen (%)
Place of birth for the foreign-born population - Other Western Asia (%)
Place of birth for the foreign-born population - Eritrea (%)
Place of birth for the foreign-born population - Ethiopia (%)
Place of birth for the foreign-born population - Kenya (%)
Place of birth for the foreign-born population - Somalia (%)
Place of birth for the foreign-born population - Uganda (%)
Place of birth for the foreign-born population - Zimbabwe (%)
Place of birth for the foreign-born population - Other Eastern Africa (%)
Place of birth for the foreign-born population - Cameroon (%)
Place of birth for the foreign-born population - Congo (%)
Place of birth for the foreign-born population - Democratic Republic of Congo (Zaire) (%)
Place of birth for the foreign-born population - Other Middle Africa (%)
Place of birth for the foreign-born population - Egypt (%)
Place of birth for the foreign-born population - Morocco (%)
Place of birth for the foreign-born population - Sudan (%)
Place of birth for the foreign-born population - Other Northern Africa (%)
Place of birth for the foreign-born population - South Africa (%)
Place of birth for the foreign-born population - Other Southern Africa (%)
Place of birth for the foreign-born population - Cabo Verde (%)
Place of birth for the foreign-born population - Ghana (%)
Place of birth for the foreign-born population - Liberia (%)
Place of birth for the foreign-born population - Nigeria (%)
Place of birth for the foreign-born population - Senegal (%)
Place of birth for the foreign-born population - Sierra Leone (%)
Place of birth for the foreign-born population - Other Western Africa (%)
Place of birth for the foreign-born population - Australia (%)
Place of birth for the foreign-born population - New Zealand (%)
Place of birth for the foreign-born population - Fiji (%)
Place of birth for the foreign-born population - Micronesia (%)
Place of birth for the foreign-born population - Bahamas (%)
Place of birth for the foreign-born population - Barbados (%)
Place of birth for the foreign-born population - Cuba (%)
Place of birth for the foreign-born population - Dominica (%)
Place of birth for the foreign-born population - Dominican Republic (%)
Place of birth for the foreign-born population - Grenada (%)
Place of birth for the foreign-born population - Haiti (%)
Place of birth for the foreign-born population - Jamaica (%)
Place of birth for the foreign-born population - St. Vincent and the Grenadines (%)
Place of birth for the foreign-born population - Trinidad and Tobago (%)
Place of birth for the foreign-born population - West Indies (%)
Place of birth for the foreign-born population - Other Caribbean (%)
Place of birth for the foreign-born population - Belize (%)
Place of birth for the foreign-born population - Costa Rica (%)
Place of birth for the foreign-born population - El Salvador (%)
Place of birth for the foreign-born population - Guatemala (%)
Place of birth for the foreign-born population - Honduras (%)
Place of birth for the foreign-born population - Mexico (%)
Place of birth for the foreign-born population - Nicaragua (%)
Place of birth for the foreign-born population - Panama (%)
Place of birth for the foreign-born population - Other Central America (%)
Place of birth for the foreign-born population - Argentina (%)
Place of birth for the foreign-born population - Bolivia (%)
Place of birth for the foreign-born population - Brazil (%)
Place of birth for the foreign-born population - Chile (%)
Place of birth for the foreign-born population - Colombia (%)
Place of birth for the foreign-born population - Ecuador (%)
Place of birth for the foreign-born population - Guyana (%)
Place of birth for the foreign-born population - Peru (%)
Place of birth for the foreign-born population - Uruguay (%)
Place of birth for the foreign-born population - Venezuela (%)
Place of birth for the foreign-born population - Other South America (%)
Place of birth for the foreign-born population - Canada (%)
Place of birth for the foreign-born population - Other Northern America (%)
Place of birth for the foreign-born population - Other (%)
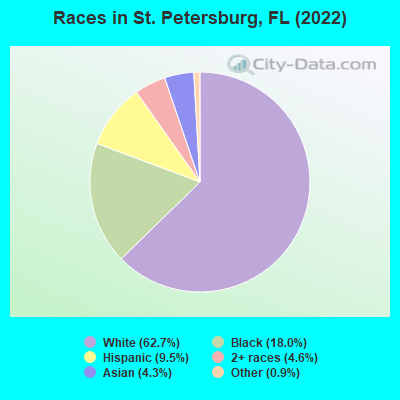
According to 2022 data, the most numerous races in St. Petersburg, FL are White alone (163,715 residents), Hispanic (24,812 residents), and Black alone (47,078 residents). 86.9% of St. Petersburg residents speak English at home. 10.3% of St. Petersburg, FL residents are foreign-born (3.8% born in Latin America, 2.5% born in Europe, 2.4% born in Asia), which is 104.2% less than the foreign-born rate of 21.0% across the entire state of Florida.
Race distribution in St. Petersburg
2000 2022
170,396 68.6% White alone 54,884 22.1% Black alone 10,502 4.2% Hispanic 6,569 2.6% Asian alone 4,537 1.8% Two or more races 684 0.3% American Indian alone 550 0.2% Other race alone 110 0.04% Native Hawaiian and Other
163,715 62.7% White alone 47,078 18.0% Black alone 24,812 9.5% Hispanic 11,926 4.6% Two or more races 11,230 4.3% Asian alone 2,401 0.9% Other race alone 83 0.03% American Indian alone
2000 2022
10,458,509 65.4% White alone 2,682,715 16.8% Hispanic 2,264,268 14.2% Black alone 261,693 1.6% Asian alone 236,954 1.5% Two or more races 42,358 0.3% American Indian alone 28,994 0.2% Other race alone 6,887 0.04% Native Hawaiian and Other
11,309,403 50.8% White alone 6,025,039 27.1% Hispanic 3,241,015 14.6% Black alone 861,630 3.9% Two or more races 623,692 2.8% Asian alone 152,054 0.7% Other race alone 22,504 0.1% American Indian alone 9,486 0.04% Native Hawaiian and Other
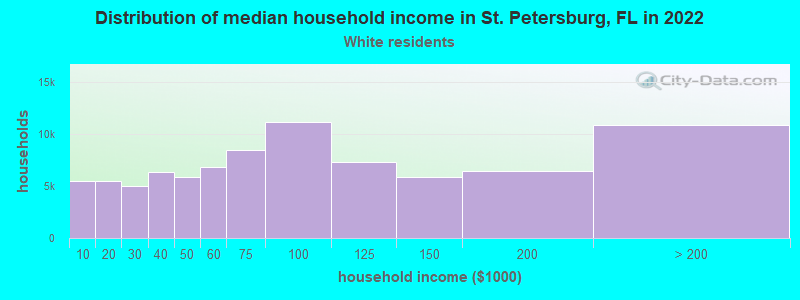
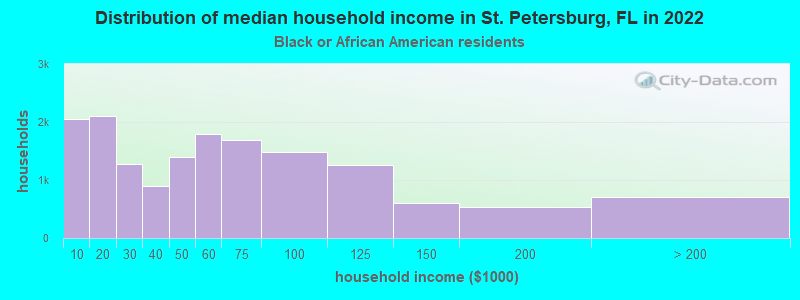
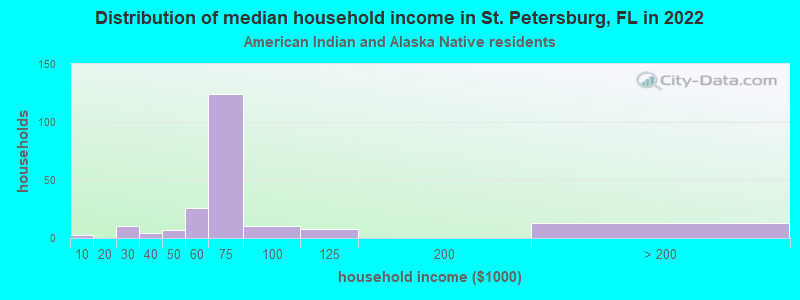
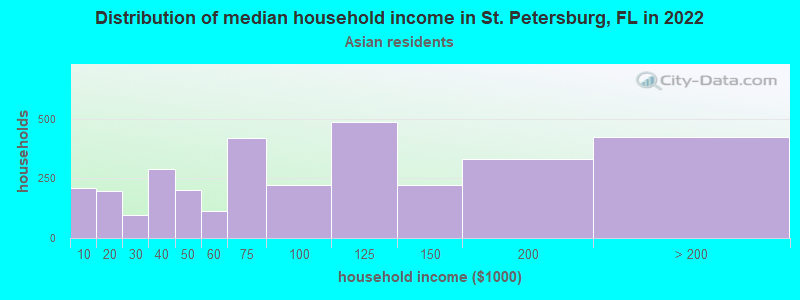
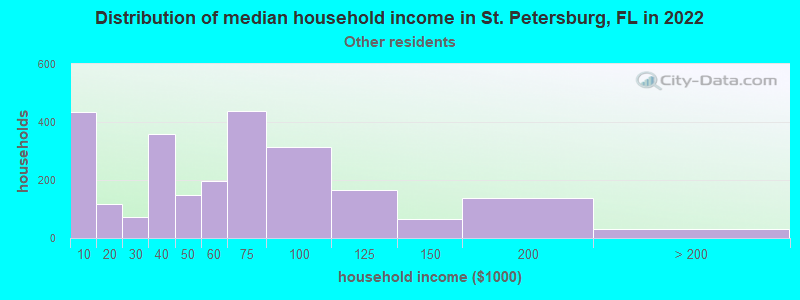
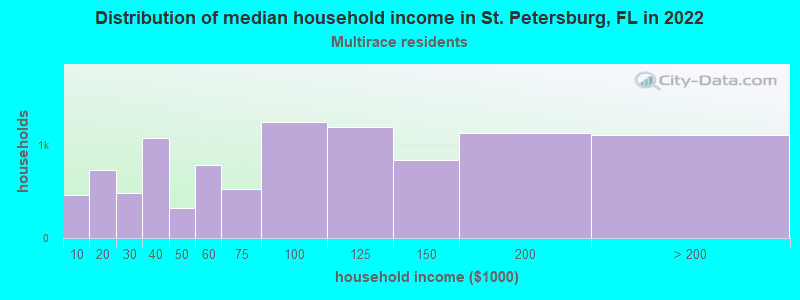
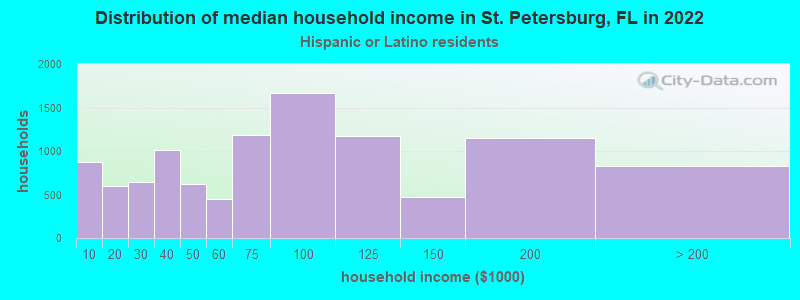
Income and house value in St. Petersburg Median household income in 2022 $72,989 White non-Hispanic householders$50,852 Black householders$96,660 Asian householders$66,243 Some other race householders$87,068 Two or more races householders$74,817 Hispanic or Latino race householdersMedian 2022 house value $413,173 White Non-Hispanic householders$292,584 Black or African American householders$460,736 American Indian or Alaska Native householders $368,973 Asian householders$406,447 Some other race householders$368,973 Two or more races householders$378,582 Hispanic or Latino householders
Median age by race in St. Petersburg
46.3 Median age for White residents44.5 47.3 38.7 Median age for Black or African American residents34.0 40.7 11.8 Median age for American Indian / Alaska Native residents32.2 11.3 44.2 Median age for Asian residents44.5 43.1 -666,666,666.0 Median age for Native Hawaiian / Pacific Islander residents-666,666,666.0 -666,666,666.0 41.6 Median age for Other race residents29.2 44.0 35.3 Median age for Two or more races residents35.1 35.6 46.6 Median age for White alone residents44.9 48.1 36.5 Median age for Hispanic or Latino residents33.8 38.0
Owner/renter occupied households by race in St. Petersburg
House owners and renters - White residents 54,541 63.8% Owner occupied30,927 36.2% Renter occupiedHouse owners and renters - Black or African American residents 6,991 44.2% Owner occupied8,821 55.8% Renter occupiedHouse owners and renters - American Indian / Alaska Native residents 43 24.8% Owner occupied129 75.2% Renter occupiedHouse owners and renters - Asian residents 2,215 69.7% Owner occupied963 30.3% Renter occupiedHouse owners and renters - Native Hawaiian / Pacific Islander residents 37 100.0% Renter occupiedHouse owners and renters - Other race residents 982 36.2% Owner occupied1,727 63.8% Renter occupiedHouse owners and renters - Two or more races residents 5,627 56.6% Owner occupied4,317 43.4% Renter occupiedHouse owners and renters - White alone residents 52,806 63.7% Owner occupied30,124 36.3% Renter occupiedHouse owners and renters - Hispanic or Latino residents 5,946 55.8% Owner occupied4,702 44.2% Renter occupied
Language usage in St. Petersburg
English speakers - Total 86.9% of residents of St. Petersburg speak English at home.
6.1% of residents speak Spanish at home 10,240 66.9% Speak English very well5,065 33.1% Speak English less than very well7.0% of residents speak other language at home 11,915 68.2% Speak English very well5,548 31.8% Speak English less than very well
English speakers - Born in the United States 96.2% of residents of St. Petersburg speak English at home.
2.5% of residents speak Spanish at home 2,779 92.1% Speak English very well237 7.9% Speak English less than very well1.4% of residents speak other language at home 1,435 84.5% Speak English very well263 15.5% Speak English less than very well
English speakers - Native, born elsewhere 54.1% of residents of St. Petersburg speak English at home.
41.6% of residents speak Spanish at home 1,749 73.6% Speak English very well628 26.4% Speak English less than very well4.3% of residents speak other language at home 246 100.0% Speak English very well
English speakers - Foreign-born 35.5% of residents of St. Petersburg speak English at home.
24.6% of residents speak Spanish at home 3,479 48.3% Speak English very well3,725 51.7% Speak English less than very well39.9% of residents speak other language at home 6,667 57.0% Speak English very well5,031 43.0% Speak English less than very well
White (Caucasian) - Speak only English Native:
97.2% (148,160)Foreign-born:
36.3% (3,802)
White (Caucasian) - Speak another language Native:
2.8% (4,313)Foreign-born:
63.7% (6,661)
Black or African American - Speak only English Native:
98.0% (42,523)Foreign-born:
70.6% (2,179)
Black or African American - Speak another language Native:
1.9% (818)Foreign-born:
29.9% (924)
American Indian / Alaska Native - Speak another language Native:
44.1% (322)Foreign-born:
100.0% (15)
Asian - Speak only English Native:
43.6% (1,932)Foreign-born:
23.6% (1,635)
Asian - Speak another language Native:
56.4% (2,495)Foreign-born:
76.4% (5,301)
Native Hawaiian / Pacific Islander - Speak only English Native:
41.4% (24)Foreign-born:
100.0% (31)
Native Hawaiian / Pacific Islander - Speak another language Native:
74.2% (43)Foreign-born:
9.7% (3)
Other race - Speak only English Native:
63.0% (2,151)Foreign-born:
37.0% (784)
Other race - Speak another language Native:
37.0% (1,263)Foreign-born:
63.0% (1,336)
Two or more races - Speak only English Native:
76.8% (14,567)Foreign-born:
23.6% (1,362)
Two or more races - Speak another language Native:
23.2% (4,398)Foreign-born:
76.4% (4,419)
White alone - Speak only English Native:
97.8% (146,460)Foreign-born:
42.9% (3,734)
White alone - Speak another language Native:
2.2% (3,260)Foreign-born:
57.1% (4,971)
Hispanic or Latino - Speak only English Native:
54.7% (8,258)Foreign-born:
7.0% (529)
Hispanic or Latino - Speak another language Native:
45.3% (6,843)Foreign-born:
93.0% (7,049)
Foreign-born residents in St. Petersburg 26,715 residents are foreign born (3.8% Latin America , 2.5% Europe , 2.4% Asia ).
This city:
10.3%Florida:
21.1%
Marital status for residents in St. Petersburg Marital status - White (Caucasian) population 15 years and over
Males 36.6% Never married44.1% Now married1.1% Separated3.3% Widowed15.0% DivorcedFemales 33.1% Never married35.2% Now married2.0% Separated10.9% Widowed18.7% DivorcedWomen who gave birth in the past 12 months Now married:
81.7% (1,101)Unmarried:
18.3% (246)
Women who did not give birth in the past 12 months Now married:
33.3% (12,350)Unmarried:
66.7% (24,731)
Marital status - Black or African American population 15 years and over
Males 48.8% Never married30.1% Now married4.2% Separated3.0% Widowed14.0% DivorcedFemales 49.0% Never married23.5% Now married2.0% Separated8.8% Widowed16.8% DivorcedWomen who gave birth in the past 12 months Now married:
72.2% (285)Unmarried:
27.8% (110)
Women who did not give birth in the past 12 months Now married:
20.5% (2,168)Unmarried:
79.5% (8,398)
Marital status - American Indian / Alaska Native population 15 years and over
Males 29.5% Never married39.1% Now married10.0% Separated8.9% Widowed12.5% DivorcedFemales 65.8% Never married8.3% Now married0.0% Separated6.2% Widowed19.7% DivorcedWomen who did not give birth in the past 12 months Now married:
4.3% (10)Unmarried:
95.7% (218)
Marital status - Asian population 15 years and over
Males 35.6% Never married59.9% Now married0.0% Separated0.0% Widowed4.4% DivorcedFemales 24.7% Never married50.6% Now married0.0% Separated10.7% Widowed14.0% DivorcedWomen who gave birth in the past 12 months Now married:
12.2% (6)Unmarried:
87.8% (42)
Women who did not give birth in the past 12 months Now married:
45.5% (1,081)Unmarried:
54.5% (1,295)
Marital status - Native Hawaiian / Pacific Islander population 15 years and over
Males 76.2% Never married9.5% Now married0.0% Separated0.0% Widowed14.3% DivorcedFemales 100.0% Never married0.0% Now married0.0% Separated0.0% Widowed0.0% DivorcedWomen who did not give birth in the past 12 months Now married:
0.0% (0)Unmarried:
100.0% (5)
Marital status - Other race population 15 years and over
Males 39.8% Never married31.3% Now married3.3% Separated0.6% Widowed25.1% DivorcedFemales 37.1% Never married35.5% Now married0.7% Separated2.0% Widowed24.7% DivorcedWomen who gave birth in the past 12 months Now married:
15.5% (13)Unmarried:
84.5% (71)
Women who did not give birth in the past 12 months Now married:
36.5% (556)Unmarried:
63.5% (966)
Marital status - Two or more races population 15 years and over
Males 49.9% Never married37.7% Now married1.7% Separated1.3% Widowed9.4% DivorcedFemales 38.9% Never married41.4% Now married3.3% Separated7.2% Widowed9.1% DivorcedWomen who gave birth in the past 12 months Now married:
100.0% (306)Unmarried:
0.0% (0)
Women who did not give birth in the past 12 months Now married:
38.7% (2,999)Unmarried:
61.3% (4,759)
Marital status - White alone, not Hispanic / Latino population 15 years and over
Males 37.0% Never married43.6% Now married1.1% Separated3.4% Widowed14.9% DivorcedFemales 32.6% Never married35.2% Now married1.9% Separated11.0% Widowed19.3% DivorcedWomen who gave birth in the past 12 months Now married:
81.0% (1,046)Unmarried:
19.0% (246)
Women who did not give birth in the past 12 months Now married:
32.9% (11,745)Unmarried:
67.1% (23,915)
Marital status - Hispanic or Latino population 15 years and over
Males 46.5% Never married38.2% Now married3.2% Separated0.0% Widowed12.1% DivorcedFemales 44.6% Never married37.2% Now married3.8% Separated5.9% Widowed8.5% DivorcedWomen who gave birth in the past 12 months Now married:
100.0% (339)Unmarried:
0.0% (0)
Women who did not give birth in the past 12 months Now married:
36.2% (2,672)Unmarried:
63.8% (4,709)
Ancestries in St. Petersburg
18,677 14.0% American9,798 7.3% English8,594 6.4% German7,515 5.6% Irish5,394 4.0% Italian2,612 2.0% European2,375 1.8% Jamaican2,342 1.8% Polish1,683 1.3% French1,208 0.9% Scottish929 0.7% Scotch-Irish814 0.6% Russian803 0.6% Greek728 0.5% Canadian701 0.5% Portuguese700 0.5% Eastern European700 0.5% French Canadian687 0.5% Swedish627 0.5% Arab608 0.5% British601 0.5% Lebanese535 0.4% Norwegian529 0.4% Dutch470 0.4% Hungarian457 0.3% Serbian451 0.3% Lithuanian439 0.3% Haitian427 0.3% Ukrainian410 0.3% African390 0.3% Albanian335 0.3% Liberian329 0.2% Welsh322 0.2% Yugoslavian298 0.2% Slovak260 0.2% Swiss255 0.2% Northern European252 0.2% Belgian252 0.2% Trinidadian and Tobagonian245 0.2% Brazilian245 0.2% Nigerian218 0.2% Croatian196 0.1% Czech184 0.1% Austrian175 0.1% West Indian165 0.1% Moroccan162 0.1% Romanian147 0.1% Scandinavian144 0.1% Bahamian118 0.09% Danish113 0.08% Latvian110 0.08% Egyptian100 0.07% Czechoslovakian98 0.07% Bulgarian94 0.07% Palestinian93 0.07% Finnish93 0.07% New Zealander93 0.07% Iranian83 0.06% Ghanaian81 0.06% U.S. Virgin Islander72 0.05% Slavic58 0.04% Soviet Union52 0.04% Turkish44 0.03% Luxembourger44 0.03% Pennsylvania German43 0.03% Estonian42 0.03% Cape Verdean39 0.03% South African32 0.02% Australian32 0.02% Afghan31 0.02% Belizean31 0.02% Slovene28 0.02% Guyanese26 0.02% Armenian25 0.02% Iraqi23 0.02% British West Indian20 0.01% Ethiopian19 0.01% Barbadian14 0.01% Jordanian14 0.01% Kenyan12 0.01% Cajun
Geographical mobility in St. Petersburg Same house 1 year ago 142,115 84.8% White (Caucasian)41,646 88.2% Black or African American776 89.3% American Indian / Alaska Native9,003 78.0% Asian53 53.0% Native Hawaiian / Pacific Islander5,429 90.8% Other race22,898 87.4% Two or more races138,659 85.2% White alone, not Hispanic / Latino20,012 83.4% Hispanic or LatinoMoved within same county 8,930 5.3% White / Caucasian2,859 6.1% Black or African American40 4.6% American Indian / Alaska Native476 4.1% Asian53 53.0% Native Hawaiian / Pacific Islander253 4.2% Other race1,316 5.0% Two or more races8,889 5.5% White alone, not Hispanic / Latino901 3.8% Hispanic or LatinoMoved within same state 6,226 3.7% White / Caucasian1,272 2.7% Black or African American31 0.3% Asian174 2.9% Other race1,100 4.2% Two or more races5,607 3.4% White alone, not Hispanic / Latino1,642 6.8% Hispanic or LatinoMoved from different state 9,235 5.5% White / Caucasian1,125 2.4% Black or African American25 2.9% American Indian / Alaska Native603 5.2% Asian66 1.1% Other race403 1.5% Two or more races8,549 5.3% White alone, not Hispanic / Latino929 3.9% Hispanic or LatinoMoved from abroad 1,094 0.7% White290 0.6% Black or African American43 5.0% American Indian / Alaska Native1,436 12.4% Asian127 2.1% Other race481 1.8% Two or more races946 0.6% White alone, not Hispanic / Latino507 2.1% Hispanic or Latino
Children Nativity (place of birth) in St. Petersburg
Children under 6 years - Living with two parents Both parents native 6,900 100.0% NativeBoth parents foreign-born 283 100.0% NativeOne native, one foreign-born parent 677 100.0% NativeChildren under 6 years - Living with one parent Native parent 3,932 100.0% NativeForeign-born parent 58 100.0% NativeChildren 6 to 17 years - Living with two parents Both parents native 7,931 100.0% NativeBoth parents foreign-born 1,264 75.4% Native413 24.6% Foreign-bornOne native, one foreign-born parent 2,272 100.0% NativeChildren 6 to 17 years - Living with one parent Native parent 10,266 100.0% NativeForeign-born parent 1,451 51.3% Native1,380 48.7% Foreign-born
Place of birth for residents in St. Petersburg 12,102 Americas10,323 Latin America6,834 Europe6,590 Asia5,559 Caribbean4,199 South Eastern Asia3,268 Eastern Europe3,035 South America1,826 Western Europe1,778 Northern America1,729 Central America1,157 Northern Europe1,102 South Central Asia875 Africa826 Eastern Asia568 Southern Europe521 China398 Western Africa379 Western Asia312 Oceania250 Southern Africa250 Australia and New Zealand Subregion128 Northern Africa97 Eastern Africa2,367 Jamaica1,878 Cuba1,778 Canada1,424 Vietnam1,073 Germany1,035 Philippines900 Mexico820 Laos754 India646 Bosnia and Herzegovina645 Venezuela602 Colombia480 Peru463 France437 Haiti430 England426 Albania422 Cambodia405 United Kingdom403 Trinidad and Tobago384 Ecuador338 Brazil335 China290 Poland281 Serbia266 Croatia263 Thailand250 South Africa236 Italy231 Guyana230 Portugal228 Russia213 Honduras202 Ukraine192 Korea188 Dominican Republic185 New Zealand176 Panama176 Indonesia168 Nigeria165 Taiwan146 Romania142 Saudi Arabia130 Bahamas130 Sweden120 Nicaragua113 Liberia112 Japan108 Bulgaria106 Lebanon104 Argentina97 Kazakhstan92 Czechoslovakia91 Guatemala89 Hungary87 Iran87 Ghana85 Costa Rica83 Netherlands82 Scotland81 Bangladesh81 El Salvador69 Egypt69 Greece66 Ireland65 Australia64 Belgium63 Switzerland60 Belize60 Chile52 Austria49 St. Vincent and the Grenadines45 Lithuania44 Morocco42 Latvia40 Bolivia38 West Indies37 Kuwait35 Moldova35 Fiji34 Sri Lanka34 Tanzania31 Nepal31 Spain30 Uganda28 Sierra Leone28 Burma (Myanmar)28 Uruguay26 Turkey22 Micronesia21 Malaysia20 Hong Kong18 Iraq17 Israel17 Azerbaijan16 Denmark15 Barbados15 Pakistan14 St. Lucia12 Grenada11 Jordan10 Norway9 Zimbabwe7 Singapore
Grandparents responsible for own grandchildren in St. Petersburg
Grandparents (30 to 59 years) White / Caucasian 338 55.4% Responsible for grandchildren271 44.6% Not responsible for grandchildrenBlack or African American 127 27.2% Responsible for grandchildren340 72.8% Not responsible for grandchildrenAsian 69 27.2% Responsible for grandchildren185 72.8% Not responsible for grandchildrenOther race 10 20.5% Responsible for grandchildren38 79.5% Not responsible for grandchildrenTwo or more races 73 100.0% Not responsible for grandchildrenWhite alone, not Hispanic / Latino 369 58.8% Responsible for grandchildren259 41.2% Not responsible for grandchildrenHispanic or Latino 45 34.1% Responsible for grandchildren87 65.9% Not responsible for grandchildrenGrandparents (60 years and over) White / Caucasian 292 30.2% Responsible for grandchildren675 69.8% Not responsible for grandchildrenBlack or African American 297 47.4% Responsible for grandchildren330 52.6% Not responsible for grandchildrenAsian 74 15.8% Responsible for grandchildren395 84.2% Not responsible for grandchildrenOther race 16 31.4% Responsible for grandchildren36 68.6% Not responsible for grandchildrenTwo or more races 39 100.0% Not responsible for grandchildrenWhite alone, not Hispanic / Latino 276 29.9% Responsible for grandchildren646 70.1% Not responsible for grandchildrenHispanic or Latino 37 13.7% Responsible for grandchildren230 86.3% Not responsible for grandchildren