Races in Spring Valley, Nevada (NV) Detailed Stats
Data:
Races - White alone (%)
Races - White alone (% change since 2000)
Races - Black alone (%)
Races - Black alone (% change since 2000)
Races - American Indian alone (%)
Races - American Indian alone (% change since 2000)
Races - Asian alone (%)
Races - Asian alone (% change since 2000)
Races - Hispanic (%)
Races - Hispanic (% change since 2000)
Races - Native Hawaiian and Other Pacific Islander alone (%)
Races - Native Hawaiian and Other Pacific Islander alone (% change since 2000)
Races - Two or more races(%)
Races - Two or more races(% change since 2000)
Races - Other race alone (%)
Races - Other race alone (% change since 2000)
Racial diversity
Place of birth - Born in state of residence (%)
Place of birth - Born in state of residence (%) - White
Place of birth - Born in state of residence (%) - Black or African American
Place of birth - Born in state of residence (%) - Asian
Place of birth - Born in state of residence (%) - Hispanic or Latino
Place of birth - Born in state of residence (%) - American Indian and Alaska Native
Place of birth - Born in state of residence (%) - Multirace
Place of birth - Born in state of residence (%) - Other Race
Place of birth - Born in other state (%)
Place of birth - Born in other state (%) - White
Place of birth - Born in other state (%) - Black or African American
Place of birth - Born in other state (%) - Asian
Place of birth - Born in other state (%) - Hispanic or Latino
Place of birth - Born in other state (%) - American Indian and Alaska Native
Place of birth - Born in other state (%) - Multirace
Place of birth - Born in other state (%) - Other Race
Place of birth - Native, outside of US (%)
Place of birth - Native, outside of US (%) - White
Place of birth - Native, outside of US (%) - Black or African American
Place of birth - Native, outside of US (%) - Asian
Place of birth - Native, outside of US (%) - Hispanic or Latino
Place of birth - Native, outside of US (%) - American Indian and Alaska Native
Place of birth - Native, outside of US (%) - Multirace
Place of birth - Native, outside of US (%) - Other Race
Place of birth - Foreign born (%)
Place of birth - Foreign born (%) - White
Place of birth - Foreign born (%) - Black or African American
Place of birth - Foreign born (%) - Asian
Place of birth - Foreign born (%) - Hispanic or Latino
Place of birth - Foreign born (%) - American Indian and Alaska Native
Place of birth - Foreign born (%) - Multirace
Place of birth - Foreign born (%) - Other Race
Residents speaking English at home (%)
Residents speaking English at home - Born in the United States (%)
Residents speaking English at home - Native, born elsewhere (%)
Residents speaking English at home - Foreign born (%)
Residents speaking Spanish at home (%)
Residents speaking Spanish at home - Born in the United States (%)
Residents speaking Spanish at home - Native, born elsewhere (%)
Residents speaking Spanish at home - Foreign born (%)
Residents speaking other language at home (%)
Residents speaking other language at home - Born in the United States (%)
Residents speaking other language at home - Native, born elsewhere (%)
Residents speaking other language at home - Foreign born (%)
Marital status - Never married (%)
Marital status - Now married (%)
Marital status - Separated (%)
Marital status - Widowed (%)
Marital status - Divorced (%)
Ancestries Reported - Arab (%)
Ancestries Reported - Czech (%)
Ancestries Reported - Danish (%)
Ancestries Reported - Dutch (%)
Ancestries Reported - English (%)
Ancestries Reported - French (%)
Ancestries Reported - French Canadian (%)
Ancestries Reported - German (%)
Ancestries Reported - Greek (%)
Ancestries Reported - Hungarian (%)
Ancestries Reported - Irish (%)
Ancestries Reported - Italian (%)
Ancestries Reported - Lithuanian (%)
Ancestries Reported - Norwegian (%)
Ancestries Reported - Polish (%)
Ancestries Reported - Portuguese (%)
Ancestries Reported - Russian (%)
Ancestries Reported - Scotch-Irish (%)
Ancestries Reported - Scottish (%)
Ancestries Reported - Slovak (%)
Ancestries Reported - Subsaharan African (%)
Ancestries Reported - Swedish (%)
Ancestries Reported - Swiss (%)
Ancestries Reported - Ukrainian (%)
Ancestries Reported - United States (%)
Ancestries Reported - Welsh (%)
Ancestries Reported - West Indian (%)
Ancestries Reported - Other (%)
Geographical mobility - Same house 1 year ago (%)
Geographical mobility - Same house 1 year ago (%) - White
Geographical mobility - Same house 1 year ago (%) - Black or African American
Geographical mobility - Same house 1 year ago (%) - Asian
Geographical mobility - Same house 1 year ago (%) - Hispanic or Latino
Geographical mobility - Same house 1 year ago (%) - American Indian and Alaska Native
Geographical mobility - Same house 1 year ago (%) - Multirace
Geographical mobility - Same house 1 year ago (%) - Other Race
Geographical mobility - Moved within same county (%)
Geographical mobility - Moved within same county (%) - White
Geographical mobility - Moved within same county (%) - Black or African American
Geographical mobility - Moved within same county (%) - Asian
Geographical mobility - Moved within same county (%) - Hispanic or Latino
Geographical mobility - Moved within same county (%) - American Indian and Alaska Native
Geographical mobility - Moved within same county (%) - Multirace
Geographical mobility - Moved within same county (%) - Other Race
Geographical mobility - Moved from different county within same state (%)
Geographical mobility - Moved from different county within same state (%) - White
Geographical mobility - Moved from different county within same state (%) - Black or African American
Geographical mobility - Moved from different county within same state (%) - Asian
Geographical mobility - Moved from different county within same state (%) - Hispanic or Latino
Geographical mobility - Moved from different county within same state (%) - American Indian and Alaska Native
Geographical mobility - Moved from different county within same state (%) - Multirace
Geographical mobility - Moved from different county within same state (%) - Other Race
Geographical mobility - Moved from different state (%)
Geographical mobility - Moved from different state (%) - White
Geographical mobility - Moved from different state (%) - Black or African American
Geographical mobility - Moved from different state (%) - Asian
Geographical mobility - Moved from different state (%) - Hispanic or Latino
Geographical mobility - Moved from different state (%) - American Indian and Alaska Native
Geographical mobility - Moved from different state (%) - Multirace
Geographical mobility - Moved from different state (%) - Other Race
Geographical mobility - Moved from abroad (%)
Geographical mobility - Moved from abroad (%) - White
Geographical mobility - Moved from abroad (%) - Black or African American
Geographical mobility - Moved from abroad (%) - Asian
Geographical mobility - Moved from abroad (%) - Hispanic or Latino
Geographical mobility - Moved from abroad (%) - American Indian and Alaska Native
Geographical mobility - Moved from abroad (%) - Multirace
Geographical mobility - Moved from abroad (%) - Other Race
Place of birth for the foreign-born population - Ireland (%)
Place of birth for the foreign-born population - Denmark (%)
Place of birth for the foreign-born population - Norway (%)
Place of birth for the foreign-born population - Sweden (%)
Place of birth for the foreign-born population - United Kingdom (%)
Place of birth for the foreign-born population - England (%)
Place of birth for the foreign-born population - Scotland (%)
Place of birth for the foreign-born population - Other Northern Europe (%)
Place of birth for the foreign-born population - Austria (%)
Place of birth for the foreign-born population - Belgium (%)
Place of birth for the foreign-born population - France (%)
Place of birth for the foreign-born population - Germany (%)
Place of birth for the foreign-born population - Netherlands (%)
Place of birth for the foreign-born population - Switzerland (%)
Place of birth for the foreign-born population - Other Western Europe (%)
Place of birth for the foreign-born population - Greece (%)
Place of birth for the foreign-born population - Italy (%)
Place of birth for the foreign-born population - Portugal (%)
Place of birth for the foreign-born population - Spain (%)
Place of birth for the foreign-born population - Other Southern Europe (%)
Place of birth for the foreign-born population - Albania (%)
Place of birth for the foreign-born population - Belarus (%)
Place of birth for the foreign-born population - Bosnia and Herzegovina (%)
Place of birth for the foreign-born population - Bulgaria (%)
Place of birth for the foreign-born population - Croatia (%)
Place of birth for the foreign-born population - Czechoslovakia (%)
Place of birth for the foreign-born population - Hungary (%)
Place of birth for the foreign-born population - Latvia (%)
Place of birth for the foreign-born population - Lithuania (%)
Place of birth for the foreign-born population - North Macedonia (Macedonia) (%)
Place of birth for the foreign-born population - Moldova (%)
Place of birth for the foreign-born population - Poland (%)
Place of birth for the foreign-born population - Romania (%)
Place of birth for the foreign-born population - Russia (%)
Place of birth for the foreign-born population - Serbia (%)
Place of birth for the foreign-born population - Ukraine (%)
Place of birth for the foreign-born population - Other Eastern Europe (%)
Place of birth for the foreign-born population - China (%)
Place of birth for the foreign-born population - Hong Kong (%)
Place of birth for the foreign-born population - Taiwan (%)
Place of birth for the foreign-born population - Japan (%)
Place of birth for the foreign-born population - Korea (%)
Place of birth for the foreign-born population - Other Eastern Asia (%)
Place of birth for the foreign-born population - Afghanistan (%)
Place of birth for the foreign-born population - Bangladesh (%)
Place of birth for the foreign-born population - India (%)
Place of birth for the foreign-born population - Iran (%)
Place of birth for the foreign-born population - Kazakhstan (%)
Place of birth for the foreign-born population - Nepal (%)
Place of birth for the foreign-born population - Pakistan (%)
Place of birth for the foreign-born population - Sri Lanka (%)
Place of birth for the foreign-born population - Uzbekistan (%)
Place of birth for the foreign-born population - Other South Central Asia (%)
Place of birth for the foreign-born population - Burma (%)
Place of birth for the foreign-born population - Cambodia (%)
Place of birth for the foreign-born population - Indonesia (%)
Place of birth for the foreign-born population - Laos (%)
Place of birth for the foreign-born population - Malaysia (%)
Place of birth for the foreign-born population - Philippines (%)
Place of birth for the foreign-born population - Singapore (%)
Place of birth for the foreign-born population - Thailand (%)
Place of birth for the foreign-born population - Vietnam (%)
Place of birth for the foreign-born population - Other South Eastern Asia (%)
Place of birth for the foreign-born population - Armenia (%)
Place of birth for the foreign-born population - Iraq (%)
Place of birth for the foreign-born population - Israel (%)
Place of birth for the foreign-born population - Jordan (%)
Place of birth for the foreign-born population - Kuwait (%)
Place of birth for the foreign-born population - Lebanon (%)
Place of birth for the foreign-born population - Saudi Arabia (%)
Place of birth for the foreign-born population - Syria (%)
Place of birth for the foreign-born population - Turkey (%)
Place of birth for the foreign-born population - Yemen (%)
Place of birth for the foreign-born population - Other Western Asia (%)
Place of birth for the foreign-born population - Eritrea (%)
Place of birth for the foreign-born population - Ethiopia (%)
Place of birth for the foreign-born population - Kenya (%)
Place of birth for the foreign-born population - Somalia (%)
Place of birth for the foreign-born population - Uganda (%)
Place of birth for the foreign-born population - Zimbabwe (%)
Place of birth for the foreign-born population - Other Eastern Africa (%)
Place of birth for the foreign-born population - Cameroon (%)
Place of birth for the foreign-born population - Congo (%)
Place of birth for the foreign-born population - Democratic Republic of Congo (Zaire) (%)
Place of birth for the foreign-born population - Other Middle Africa (%)
Place of birth for the foreign-born population - Egypt (%)
Place of birth for the foreign-born population - Morocco (%)
Place of birth for the foreign-born population - Sudan (%)
Place of birth for the foreign-born population - Other Northern Africa (%)
Place of birth for the foreign-born population - South Africa (%)
Place of birth for the foreign-born population - Other Southern Africa (%)
Place of birth for the foreign-born population - Cabo Verde (%)
Place of birth for the foreign-born population - Ghana (%)
Place of birth for the foreign-born population - Liberia (%)
Place of birth for the foreign-born population - Nigeria (%)
Place of birth for the foreign-born population - Senegal (%)
Place of birth for the foreign-born population - Sierra Leone (%)
Place of birth for the foreign-born population - Other Western Africa (%)
Place of birth for the foreign-born population - Australia (%)
Place of birth for the foreign-born population - New Zealand (%)
Place of birth for the foreign-born population - Fiji (%)
Place of birth for the foreign-born population - Micronesia (%)
Place of birth for the foreign-born population - Bahamas (%)
Place of birth for the foreign-born population - Barbados (%)
Place of birth for the foreign-born population - Cuba (%)
Place of birth for the foreign-born population - Dominica (%)
Place of birth for the foreign-born population - Dominican Republic (%)
Place of birth for the foreign-born population - Grenada (%)
Place of birth for the foreign-born population - Haiti (%)
Place of birth for the foreign-born population - Jamaica (%)
Place of birth for the foreign-born population - St. Vincent and the Grenadines (%)
Place of birth for the foreign-born population - Trinidad and Tobago (%)
Place of birth for the foreign-born population - West Indies (%)
Place of birth for the foreign-born population - Other Caribbean (%)
Place of birth for the foreign-born population - Belize (%)
Place of birth for the foreign-born population - Costa Rica (%)
Place of birth for the foreign-born population - El Salvador (%)
Place of birth for the foreign-born population - Guatemala (%)
Place of birth for the foreign-born population - Honduras (%)
Place of birth for the foreign-born population - Mexico (%)
Place of birth for the foreign-born population - Nicaragua (%)
Place of birth for the foreign-born population - Panama (%)
Place of birth for the foreign-born population - Other Central America (%)
Place of birth for the foreign-born population - Argentina (%)
Place of birth for the foreign-born population - Bolivia (%)
Place of birth for the foreign-born population - Brazil (%)
Place of birth for the foreign-born population - Chile (%)
Place of birth for the foreign-born population - Colombia (%)
Place of birth for the foreign-born population - Ecuador (%)
Place of birth for the foreign-born population - Guyana (%)
Place of birth for the foreign-born population - Peru (%)
Place of birth for the foreign-born population - Uruguay (%)
Place of birth for the foreign-born population - Venezuela (%)
Place of birth for the foreign-born population - Other South America (%)
Place of birth for the foreign-born population - Canada (%)
Place of birth for the foreign-born population - Other Northern America (%)
Place of birth for the foreign-born population - Other (%)
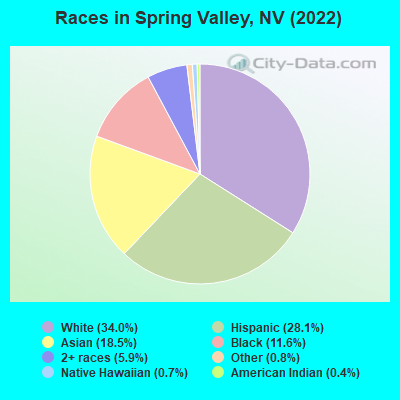
According to 2022 data, the most numerous races in Spring Valley, NV are White alone (75,135 residents), Hispanic (62,062 residents), and Black alone (25,675 residents). 59.8% of Spring Valley residents speak English at home. 28.8% of Spring Valley, NV residents are foreign-born (14.4% born in Asia, 8.0% born in Latin America, 3.2% born in Africa), which is 37.5% greater than the foreign-born rate of 18.0% across the entire state of Nevada.
Race distribution in Spring Valley
2000 2022
76,766 65.4% White alone 16,165 13.8% Hispanic 13,042 11.1% Asian alone 6,011 5.1% Black alone 4,111 3.5% Two or more races 540 0.5% Native Hawaiian and Other 537 0.5% American Indian alone 218 0.2% Other race alone
75,135 34.0% White alone 62,062 28.1% Hispanic 40,913 18.5% Asian alone 25,675 11.6% Black alone 12,937 5.9% Two or more races 1,717 0.8% Other race alone 1,456 0.7% Native Hawaiian and Other 812 0.4% American Indian alone
2000 2022
1,303,001 65.2% White alone 393,970 19.7% Hispanic 131,509 6.6% Black alone 88,593 4.4% Asian alone 49,231 2.5% Two or more races 21,397 1.1% American Indian alone 7,769 0.4% Native Hawaiian and Other 2,787 0.1% Other race alone
1,410,145 44.4% White alone 961,357 30.3% Hispanic 286,471 9.0% Black alone 281,149 8.8% Asian alone 182,151 5.7% Two or more races 20,102 0.6% Native Hawaiian and Other 18,781 0.6% Other race alone 17,616 0.6% American Indian alone
Income and house value in Spring Valley Median household income in 2022 $64,080 White non-Hispanic householders$60,218 Black householders$83,259 American Indian and Alaska Native householders$80,492 Asian householders$55,246 Native Hawaiian and other Pacific Islander householders$62,090 Some other race householders$72,388 Two or more races householders$67,274 Hispanic or Latino race householdersMedian 2022 house value $455,503 White Non-Hispanic householders$492,198 Black or African American householders$362,401 American Indian or Alaska Native householders $455,200 Asian householders$410,620 Native Hawaiian and other Pacific Islander householders$410,620 Some other race householders$479,158 Two or more races householders$419,111 Hispanic or Latino householders
Median age by race in Spring Valley
43.8 Median age for White residents44.9 43.5 32.4 Median age for Black or African American residents32.8 31.7 48.0 Median age for American Indian / Alaska Native residents48.6 43.2 39.0 Median age for Asian residents38.4 41.1 28.8 Median age for Native Hawaiian / Pacific Islander residents28.1 58.4 32.7 Median age for Other race residents35.2 31.7 32.5 Median age for Two or more races residents27.9 36.7 45.5 Median age for White alone residents46.3 44.1 32.5 Median age for Hispanic or Latino residents32.6 32.3
Owner/renter occupied households by race in Spring Valley
House owners and renters - White residents 20,784 52.6% Owner occupied18,709 47.4% Renter occupiedHouse owners and renters - Black or African American residents 2,105 20.0% Owner occupied8,400 80.0% Renter occupiedHouse owners and renters - American Indian / Alaska Native residents 399 60.1% Owner occupied264 39.9% Renter occupiedHouse owners and renters - Asian residents 9,356 62.8% Owner occupied5,539 37.2% Renter occupiedHouse owners and renters - Native Hawaiian / Pacific Islander residents 234 44.0% Owner occupied297 56.0% Renter occupiedHouse owners and renters - Other race residents 2,769 34.2% Owner occupied5,316 65.8% Renter occupiedHouse owners and renters - Two or more races residents 3,546 32.8% Owner occupied7,250 67.2% Renter occupiedHouse owners and renters - White alone residents 19,585 53.6% Owner occupied16,987 46.4% Renter occupiedHouse owners and renters - Hispanic or Latino residents 7,298 38.2% Owner occupied11,830 61.8% Renter occupied
Language usage in Spring Valley
English speakers - Total 59.8% of residents of Spring Valley speak English at home.
18.0% of residents speak Spanish at home 18,997 50.9% Speak English very well18,350 49.1% Speak English less than very well22.2% of residents speak other language at home 27,038 58.7% Speak English very well18,990 41.3% Speak English less than very well
English speakers - Born in the United States 88.1% of residents of Spring Valley speak English at home.
8.0% of residents speak Spanish at home 5,855 78.3% Speak English very well1,620 21.7% Speak English less than very well3.9% of residents speak other language at home 3,465 96.1% Speak English very well141 3.9% Speak English less than very well
English speakers - Native, born elsewhere 48.1% of residents of Spring Valley speak English at home.
31.4% of residents speak Spanish at home 1,620 58.0% Speak English very well1,171 42.0% Speak English less than very well20.5% of residents speak other language at home 1,451 79.5% Speak English very well374 20.5% Speak English less than very well
English speakers - Foreign-born 11.5% of residents of Spring Valley speak English at home.
31.9% of residents speak Spanish at home 5,736 28.3% Speak English very well14,514 71.7% Speak English less than very well56.6% of residents speak other language at home 18,034 50.2% Speak English very well17,924 49.8% Speak English less than very well
White (Caucasian) - Speak only English Native:
91.9% (65,199)Foreign-born:
21.2% (2,066)
White (Caucasian) - Speak another language Native:
8.1% (5,763)Foreign-born:
78.8% (7,686)
Black or African American - Speak only English Native:
90.6% (15,239)Foreign-born:
5.8% (448)
Black or African American - Speak another language Native:
9.4% (1,584)Foreign-born:
94.2% (7,270)
American Indian / Alaska Native - Speak only English Native:
59.8% (898)Foreign-born:
13.8% (70)
American Indian / Alaska Native - Speak another language Native:
40.9% (615)Foreign-born:
88.4% (453)
Asian - Speak only English Native:
68.8% (9,571)Foreign-born:
12.8% (3,215)
Asian - Speak another language Native:
31.2% (4,345)Foreign-born:
87.2% (21,856)
Native Hawaiian / Pacific Islander - Speak only English Native:
77.9% (979)Foreign-born:
7.5% (13)
Native Hawaiian / Pacific Islander - Speak another language Native:
20.5% (257)Foreign-born:
80.9% (144)
Other race - Speak only English Native:
41.0% (6,116)Foreign-born:
7.1% (793)
Other race - Speak another language Native:
59.0% (8,802)Foreign-born:
92.9% (10,425)
Two or more races - Speak only English Native:
74.6% (18,067)Foreign-born:
8.5% (786)
Two or more races - Speak another language Native:
25.4% (6,155)Foreign-born:
91.5% (8,437)
White alone - Speak only English Native:
94.3% (61,514)Foreign-born:
25.3% (2,010)
White alone - Speak another language Native:
5.7% (3,711)Foreign-born:
74.7% (5,947)
Hispanic or Latino - Speak only English Native:
53.7% (19,184)Foreign-born:
5.1% (1,082)
Hispanic or Latino - Speak another language Native:
46.3% (16,510)Foreign-born:
94.9% (20,245)
Foreign-born residents in Spring Valley 64,993 residents are foreign born (14.4% Asia , 8.0% Latin America , 3.2% Africa ).
This city:
28.8%Nevada:
19.1%
Marital status for residents in Spring Valley Marital status - White (Caucasian) population 15 years and over
Males 38.5% Never married38.6% Now married0.7% Separated2.6% Widowed19.7% DivorcedFemales 30.8% Never married41.0% Now married2.9% Separated7.9% Widowed17.4% DivorcedWomen who gave birth in the past 12 months Now married:
88.5% (919)Unmarried:
11.5% (120)
Women who did not give birth in the past 12 months Now married:
39.6% (7,911)Unmarried:
60.4% (12,084)
Marital status - Black or African American population 15 years and over
Males 41.3% Never married45.8% Now married1.6% Separated1.0% Widowed10.3% DivorcedFemales 35.6% Never married44.9% Now married0.0% Separated6.1% Widowed13.5% DivorcedWomen who gave birth in the past 12 months Now married:
52.0% (468)Unmarried:
48.0% (432)
Women who did not give birth in the past 12 months Now married:
43.9% (2,415)Unmarried:
56.1% (3,082)
Marital status - American Indian / Alaska Native population 15 years and over
Males 45.6% Never married38.6% Now married1.0% Separated11.5% Widowed3.4% DivorcedFemales 33.2% Never married47.0% Now married1.6% Separated4.5% Widowed13.6% DivorcedWomen who gave birth in the past 12 months Now married:
25.5% (18)Unmarried:
74.5% (52)
Women who did not give birth in the past 12 months Now married:
43.9% (244)Unmarried:
56.1% (312)
Marital status - Asian population 15 years and over
Males 38.5% Never married47.1% Now married1.8% Separated0.6% Widowed12.0% DivorcedFemales 29.8% Never married47.2% Now married1.9% Separated8.3% Widowed12.8% DivorcedWomen who gave birth in the past 12 months Now married:
42.7% (105)Unmarried:
57.3% (141)
Women who did not give birth in the past 12 months Now married:
47.2% (5,053)Unmarried:
52.8% (5,648)
Marital status - Native Hawaiian / Pacific Islander population 15 years and over
Males 45.2% Never married36.9% Now married4.3% Separated2.7% Widowed10.9% DivorcedFemales 31.1% Never married32.7% Now married4.6% Separated15.9% Widowed15.7% DivorcedWomen who gave birth in the past 12 months Now married:
0.0% (0)Unmarried:
100.0% (67)
Women who did not give birth in the past 12 months Now married:
39.8% (141)Unmarried:
60.2% (213)
Marital status - Other race population 15 years and over
Males 46.6% Never married44.3% Now married0.8% Separated0.6% Widowed7.8% DivorcedFemales 40.5% Never married44.4% Now married0.0% Separated5.2% Widowed10.0% DivorcedWomen who gave birth in the past 12 months Now married:
79.0% (996)Unmarried:
21.0% (265)
Women who did not give birth in the past 12 months Now married:
33.6% (2,166)Unmarried:
66.4% (4,282)
Marital status - Two or more races population 15 years and over
Males 54.4% Never married36.6% Now married3.1% Separated0.3% Widowed5.5% DivorcedFemales 32.6% Never married45.7% Now married1.9% Separated4.8% Widowed14.9% DivorcedWomen who gave birth in the past 12 months Now married:
45.4% (122)Unmarried:
54.6% (146)
Women who did not give birth in the past 12 months Now married:
28.6% (2,917)Unmarried:
71.4% (7,296)
Marital status - White alone, not Hispanic / Latino population 15 years and over
Males 37.7% Never married38.0% Now married0.8% Separated2.8% Widowed20.8% DivorcedFemales 29.3% Never married40.9% Now married2.9% Separated8.0% Widowed18.8% DivorcedWomen who gave birth in the past 12 months Now married:
92.6% (788)Unmarried:
7.4% (63)
Women who did not give birth in the past 12 months Now married:
39.7% (6,929)Unmarried:
60.3% (10,506)
Marital status - Hispanic or Latino population 15 years and over
Males 47.4% Never married43.6% Now married2.0% Separated1.8% Widowed5.2% DivorcedFemales 38.3% Never married45.5% Now married1.6% Separated4.6% Widowed10.1% DivorcedWomen who gave birth in the past 12 months Now married:
66.8% (1,199)Unmarried:
33.2% (596)
Women who did not give birth in the past 12 months Now married:
38.5% (5,680)Unmarried:
61.5% (9,089)
Ancestries in Spring Valley
4,720 3.5% Italian4,293 3.2% German4,236 3.1% Ethiopian4,159 3.1% American3,630 2.7% Irish3,277 2.4% English1,966 1.5% Serbian1,478 1.1% African1,471 1.1% European1,263 0.9% Polish1,102 0.8% Armenian1,088 0.8% Iranian909 0.7% French837 0.6% Russian634 0.5% Norwegian580 0.4% Scottish524 0.4% Hungarian512 0.4% Ukrainian418 0.3% Moroccan386 0.3% Greek377 0.3% Eastern European346 0.3% Romanian299 0.2% Ghanaian283 0.2% French Canadian282 0.2% Dutch280 0.2% Bulgarian278 0.2% British268 0.2% Scotch-Irish264 0.2% Yugoslavian260 0.2% Syrian238 0.2% Swedish220 0.2% Egyptian189 0.1% Lebanese179 0.1% Israeli179 0.1% Danish178 0.1% Sierra Leonean172 0.1% Australian164 0.1% Arab161 0.1% Afghan147 0.1% Slovak134 0.10% Jamaican125 0.09% Portuguese124 0.09% South African119 0.09% Welsh114 0.08% Canadian110 0.08% Belgian109 0.08% Scandinavian86 0.06% Czech85 0.06% Brazilian84 0.06% Latvian78 0.06% Nigerian76 0.06% Palestinian67 0.05% Haitian64 0.05% Austrian61 0.05% Turkish58 0.04% Trinidadian and Tobagonian57 0.04% Bahamian52 0.04% Kenyan40 0.03% Basque38 0.03% Lithuanian37 0.03% Slavic36 0.03% Swiss34 0.03% West Indian28 0.02% Iraqi26 0.02% Finnish26 0.02% Cajun26 0.02% Jordanian24 0.02% Czechoslovakian24 0.02% Macedonian23 0.02% Croatian20 0.01% Belizean19 0.01% Sudanese16 0.01% Northern European13 0.01% Slovene10 0.01% Icelander9 0.01% Maltese
Geographical mobility in Spring Valley Same house 1 year ago 74,264 89.9% White (Caucasian)20,159 74.9% Black or African American1,854 91.3% American Indian / Alaska Native34,107 83.7% Asian1,372 92.2% Native Hawaiian / Pacific Islander20,661 88.3% Other race29,246 82.3% Two or more races66,902 89.6% White alone, not Hispanic / Latino52,868 87.8% Hispanic or LatinoMoved within same county 5,311 6.4% White / Caucasian2,899 10.8% Black or African American170 8.4% American Indian / Alaska Native4,612 11.3% Asian138 9.3% Native Hawaiian / Pacific Islander2,294 9.8% Other race4,881 13.7% Two or more races5,165 6.9% White alone, not Hispanic / Latino5,478 9.1% Hispanic or LatinoMoved within same state 95 0.2% Asian7 0.5% Native Hawaiian / Pacific Islander48 0.2% Other raceMoved from different state 2,796 3.4% White / Caucasian3,727 13.8% Black or African American24 1.2% American Indian / Alaska Native1,370 3.4% Asian18 1.2% Native Hawaiian / Pacific Islander297 1.3% Other race997 2.8% Two or more races2,342 3.1% White alone, not Hispanic / Latino1,302 2.2% Hispanic or LatinoMoved from abroad 261 0.3% White134 0.5% Black or African American574 1.4% Asian45 0.2% Other race405 1.1% Two or more races261 0.3% White alone, not Hispanic / Latino597 1.0% Hispanic or Latino
Children Nativity (place of birth) in Spring Valley
Children under 6 years - Living with two parents Both parents native 4,264 100.0% NativeBoth parents foreign-born 2,503 90.6% Native259 9.4% Foreign-bornOne native, one foreign-born parent 1,684 100.0% NativeChildren under 6 years - Living with one parent Native parent 3,268 100.0% NativeForeign-born parent 2,181 98.4% Native35 1.6% Foreign-bornChildren 6 to 17 years - Living with two parents Both parents native 7,770 100.0% NativeBoth parents foreign-born 3,801 68.6% Native1,742 31.4% Foreign-bornOne native, one foreign-born parent 2,658 95.1% Native137 4.9% Foreign-bornChildren 6 to 17 years - Living with one parent Native parent 7,822 100.0% NativeForeign-born parent 4,054 53.8% Native3,479 46.2% Foreign-born
Place of birth for residents in Spring Valley 32,348 Asia19,106 Americas18,094 Latin America14,808 South Eastern Asia12,968 Central America12,827 Eastern Asia9,867 China7,310 Africa6,639 Eastern Africa5,908 Europe3,781 Eastern Europe2,663 South America2,578 South Central Asia2,462 Caribbean2,097 Western Asia1,011 Northern America864 Northern Europe801 Western Europe423 Northern Africa395 Southern Europe319 Oceania177 Australia and New Zealand Subregion130 Western Africa106 Southern Africa10,297 Philippines9,955 Mexico7,677 China6,085 Ethiopia2,599 Vietnam2,333 Korea2,188 Cuba1,309 El Salvador1,163 Taiwan1,126 Thailand1,082 Iran1,026 Hong Kong1,020 Peru1,011 Canada758 Armenia723 India709 Bosnia and Herzegovina679 Guatemala611 Russia587 Japan583 Israel534 Argentina503 Bulgaria469 Germany434 Nicaragua419 Eritrea397 Ukraine363 Colombia346 Romania327 Honduras310 United Kingdom304 England294 Sri Lanka269 Serbia246 Brazil229 Lebanon229 Laos216 France210 Venezuela201 Bhutan190 Indonesia176 Italy167 Hungary163 Egypt149 Syria132 Afghanistan128 Morocco127 Iraq125 Latvia123 Costa Rica116 Australia112 Greece111 Panama106 South Africa103 Denmark103 Poland102 Fiji100 Croatia98 Burma (Myanmar)96 Malaysia90 Trinidad and Tobago89 Singapore84 North Macedonia (Macedonia)81 Turkey77 Nigeria74 Chile72 Cambodia69 Jamaica69 Sudan69 Portugal67 Ecuador61 Dominican Republic61 New Zealand59 Kenya58 Pakistan56 Jordan53 Saudi Arabia53 Sierra Leone53 Czechoslovakia52 Haiti52 Ireland51 Netherlands39 Sweden37 Belgium36 Spain35 Uganda33 Uruguay32 Kazakhstan31 Moldova30 Somalia27 Scotland27 Belize26 Austria22 Belarus22 Albania20 Norway19 Georgia19 Bolivia14 Nepal9 Zimbabwe7 Lithuania
Grandparents responsible for own grandchildren in Spring Valley
Grandparents (30 to 59 years) White / Caucasian 279 54.2% Responsible for grandchildren236 45.8% Not responsible for grandchildrenBlack or African American 21 9.7% Responsible for grandchildren197 90.3% Not responsible for grandchildrenAmerican Indian / Alaska Native 6 8.9% Responsible for grandchildren58 91.1% Not responsible for grandchildrenAsian 113 45.6% Responsible for grandchildren135 54.4% Not responsible for grandchildrenNative Hawaiian / Pacific Islander 32 100.0% Not responsible for grandchildrenOther race 183 36.2% Responsible for grandchildren322 63.8% Not responsible for grandchildrenTwo or more races 15 8.5% Responsible for grandchildren165 91.5% Not responsible for grandchildrenWhite alone, not Hispanic / Latino 229 50.3% Responsible for grandchildren226 49.7% Not responsible for grandchildrenHispanic or Latino 330 39.8% Responsible for grandchildren499 60.2% Not responsible for grandchildrenGrandparents (60 years and over) White / Caucasian 172 20.0% Responsible for grandchildren688 80.0% Not responsible for grandchildrenBlack or African American 266 30.2% Responsible for grandchildren615 69.8% Not responsible for grandchildrenAmerican Indian / Alaska Native 75 100.0% Not responsible for grandchildrenAsian 173 13.1% Responsible for grandchildren1,151 86.9% Not responsible for grandchildrenNative Hawaiian / Pacific Islander 10 100.0% Not responsible for grandchildrenOther race 66 21.6% Responsible for grandchildren241 78.4% Not responsible for grandchildrenTwo or more races 17 6.8% Responsible for grandchildren229 93.2% Not responsible for grandchildrenWhite alone, not Hispanic / Latino 181 22.6% Responsible for grandchildren622 77.4% Not responsible for grandchildrenHispanic or Latino 60 9.4% Responsible for grandchildren582 90.6% Not responsible for grandchildren