Races in Spanish Springs, Nevada (NV) Detailed Stats
Data:
Races - White alone (%)
Races - White alone (% change since 2000)
Races - Black alone (%)
Races - Black alone (% change since 2000)
Races - American Indian alone (%)
Races - American Indian alone (% change since 2000)
Races - Asian alone (%)
Races - Asian alone (% change since 2000)
Races - Hispanic (%)
Races - Hispanic (% change since 2000)
Races - Native Hawaiian and Other Pacific Islander alone (%)
Races - Native Hawaiian and Other Pacific Islander alone (% change since 2000)
Races - Two or more races(%)
Races - Two or more races(% change since 2000)
Races - Other race alone (%)
Races - Other race alone (% change since 2000)
Racial diversity
Place of birth - Born in state of residence (%)
Place of birth - Born in state of residence (%) - White
Place of birth - Born in state of residence (%) - Black or African American
Place of birth - Born in state of residence (%) - Asian
Place of birth - Born in state of residence (%) - Hispanic or Latino
Place of birth - Born in state of residence (%) - American Indian and Alaska Native
Place of birth - Born in state of residence (%) - Multirace
Place of birth - Born in state of residence (%) - Other Race
Place of birth - Born in other state (%)
Place of birth - Born in other state (%) - White
Place of birth - Born in other state (%) - Black or African American
Place of birth - Born in other state (%) - Asian
Place of birth - Born in other state (%) - Hispanic or Latino
Place of birth - Born in other state (%) - American Indian and Alaska Native
Place of birth - Born in other state (%) - Multirace
Place of birth - Born in other state (%) - Other Race
Place of birth - Native, outside of US (%)
Place of birth - Native, outside of US (%) - White
Place of birth - Native, outside of US (%) - Black or African American
Place of birth - Native, outside of US (%) - Asian
Place of birth - Native, outside of US (%) - Hispanic or Latino
Place of birth - Native, outside of US (%) - American Indian and Alaska Native
Place of birth - Native, outside of US (%) - Multirace
Place of birth - Native, outside of US (%) - Other Race
Place of birth - Foreign born (%)
Place of birth - Foreign born (%) - White
Place of birth - Foreign born (%) - Black or African American
Place of birth - Foreign born (%) - Asian
Place of birth - Foreign born (%) - Hispanic or Latino
Place of birth - Foreign born (%) - American Indian and Alaska Native
Place of birth - Foreign born (%) - Multirace
Place of birth - Foreign born (%) - Other Race
Residents speaking English at home (%)
Residents speaking English at home - Born in the United States (%)
Residents speaking English at home - Native, born elsewhere (%)
Residents speaking English at home - Foreign born (%)
Residents speaking Spanish at home (%)
Residents speaking Spanish at home - Born in the United States (%)
Residents speaking Spanish at home - Native, born elsewhere (%)
Residents speaking Spanish at home - Foreign born (%)
Residents speaking other language at home (%)
Residents speaking other language at home - Born in the United States (%)
Residents speaking other language at home - Native, born elsewhere (%)
Residents speaking other language at home - Foreign born (%)
Marital status - Never married (%)
Marital status - Now married (%)
Marital status - Separated (%)
Marital status - Widowed (%)
Marital status - Divorced (%)
Ancestries Reported - Arab (%)
Ancestries Reported - Czech (%)
Ancestries Reported - Danish (%)
Ancestries Reported - Dutch (%)
Ancestries Reported - English (%)
Ancestries Reported - French (%)
Ancestries Reported - French Canadian (%)
Ancestries Reported - German (%)
Ancestries Reported - Greek (%)
Ancestries Reported - Hungarian (%)
Ancestries Reported - Irish (%)
Ancestries Reported - Italian (%)
Ancestries Reported - Lithuanian (%)
Ancestries Reported - Norwegian (%)
Ancestries Reported - Polish (%)
Ancestries Reported - Portuguese (%)
Ancestries Reported - Russian (%)
Ancestries Reported - Scotch-Irish (%)
Ancestries Reported - Scottish (%)
Ancestries Reported - Slovak (%)
Ancestries Reported - Subsaharan African (%)
Ancestries Reported - Swedish (%)
Ancestries Reported - Swiss (%)
Ancestries Reported - Ukrainian (%)
Ancestries Reported - United States (%)
Ancestries Reported - Welsh (%)
Ancestries Reported - West Indian (%)
Ancestries Reported - Other (%)
Geographical mobility - Same house 1 year ago (%)
Geographical mobility - Same house 1 year ago (%) - White
Geographical mobility - Same house 1 year ago (%) - Black or African American
Geographical mobility - Same house 1 year ago (%) - Asian
Geographical mobility - Same house 1 year ago (%) - Hispanic or Latino
Geographical mobility - Same house 1 year ago (%) - American Indian and Alaska Native
Geographical mobility - Same house 1 year ago (%) - Multirace
Geographical mobility - Same house 1 year ago (%) - Other Race
Geographical mobility - Moved within same county (%)
Geographical mobility - Moved within same county (%) - White
Geographical mobility - Moved within same county (%) - Black or African American
Geographical mobility - Moved within same county (%) - Asian
Geographical mobility - Moved within same county (%) - Hispanic or Latino
Geographical mobility - Moved within same county (%) - American Indian and Alaska Native
Geographical mobility - Moved within same county (%) - Multirace
Geographical mobility - Moved within same county (%) - Other Race
Geographical mobility - Moved from different county within same state (%)
Geographical mobility - Moved from different county within same state (%) - White
Geographical mobility - Moved from different county within same state (%) - Black or African American
Geographical mobility - Moved from different county within same state (%) - Asian
Geographical mobility - Moved from different county within same state (%) - Hispanic or Latino
Geographical mobility - Moved from different county within same state (%) - American Indian and Alaska Native
Geographical mobility - Moved from different county within same state (%) - Multirace
Geographical mobility - Moved from different county within same state (%) - Other Race
Geographical mobility - Moved from different state (%)
Geographical mobility - Moved from different state (%) - White
Geographical mobility - Moved from different state (%) - Black or African American
Geographical mobility - Moved from different state (%) - Asian
Geographical mobility - Moved from different state (%) - Hispanic or Latino
Geographical mobility - Moved from different state (%) - American Indian and Alaska Native
Geographical mobility - Moved from different state (%) - Multirace
Geographical mobility - Moved from different state (%) - Other Race
Geographical mobility - Moved from abroad (%)
Geographical mobility - Moved from abroad (%) - White
Geographical mobility - Moved from abroad (%) - Black or African American
Geographical mobility - Moved from abroad (%) - Asian
Geographical mobility - Moved from abroad (%) - Hispanic or Latino
Geographical mobility - Moved from abroad (%) - American Indian and Alaska Native
Geographical mobility - Moved from abroad (%) - Multirace
Geographical mobility - Moved from abroad (%) - Other Race
Place of birth for the foreign-born population - Ireland (%)
Place of birth for the foreign-born population - Denmark (%)
Place of birth for the foreign-born population - Norway (%)
Place of birth for the foreign-born population - Sweden (%)
Place of birth for the foreign-born population - United Kingdom (%)
Place of birth for the foreign-born population - England (%)
Place of birth for the foreign-born population - Scotland (%)
Place of birth for the foreign-born population - Other Northern Europe (%)
Place of birth for the foreign-born population - Austria (%)
Place of birth for the foreign-born population - Belgium (%)
Place of birth for the foreign-born population - France (%)
Place of birth for the foreign-born population - Germany (%)
Place of birth for the foreign-born population - Netherlands (%)
Place of birth for the foreign-born population - Switzerland (%)
Place of birth for the foreign-born population - Other Western Europe (%)
Place of birth for the foreign-born population - Greece (%)
Place of birth for the foreign-born population - Italy (%)
Place of birth for the foreign-born population - Portugal (%)
Place of birth for the foreign-born population - Spain (%)
Place of birth for the foreign-born population - Other Southern Europe (%)
Place of birth for the foreign-born population - Albania (%)
Place of birth for the foreign-born population - Belarus (%)
Place of birth for the foreign-born population - Bosnia and Herzegovina (%)
Place of birth for the foreign-born population - Bulgaria (%)
Place of birth for the foreign-born population - Croatia (%)
Place of birth for the foreign-born population - Czechoslovakia (%)
Place of birth for the foreign-born population - Hungary (%)
Place of birth for the foreign-born population - Latvia (%)
Place of birth for the foreign-born population - Lithuania (%)
Place of birth for the foreign-born population - North Macedonia (Macedonia) (%)
Place of birth for the foreign-born population - Moldova (%)
Place of birth for the foreign-born population - Poland (%)
Place of birth for the foreign-born population - Romania (%)
Place of birth for the foreign-born population - Russia (%)
Place of birth for the foreign-born population - Serbia (%)
Place of birth for the foreign-born population - Ukraine (%)
Place of birth for the foreign-born population - Other Eastern Europe (%)
Place of birth for the foreign-born population - China (%)
Place of birth for the foreign-born population - Hong Kong (%)
Place of birth for the foreign-born population - Taiwan (%)
Place of birth for the foreign-born population - Japan (%)
Place of birth for the foreign-born population - Korea (%)
Place of birth for the foreign-born population - Other Eastern Asia (%)
Place of birth for the foreign-born population - Afghanistan (%)
Place of birth for the foreign-born population - Bangladesh (%)
Place of birth for the foreign-born population - India (%)
Place of birth for the foreign-born population - Iran (%)
Place of birth for the foreign-born population - Kazakhstan (%)
Place of birth for the foreign-born population - Nepal (%)
Place of birth for the foreign-born population - Pakistan (%)
Place of birth for the foreign-born population - Sri Lanka (%)
Place of birth for the foreign-born population - Uzbekistan (%)
Place of birth for the foreign-born population - Other South Central Asia (%)
Place of birth for the foreign-born population - Burma (%)
Place of birth for the foreign-born population - Cambodia (%)
Place of birth for the foreign-born population - Indonesia (%)
Place of birth for the foreign-born population - Laos (%)
Place of birth for the foreign-born population - Malaysia (%)
Place of birth for the foreign-born population - Philippines (%)
Place of birth for the foreign-born population - Singapore (%)
Place of birth for the foreign-born population - Thailand (%)
Place of birth for the foreign-born population - Vietnam (%)
Place of birth for the foreign-born population - Other South Eastern Asia (%)
Place of birth for the foreign-born population - Armenia (%)
Place of birth for the foreign-born population - Iraq (%)
Place of birth for the foreign-born population - Israel (%)
Place of birth for the foreign-born population - Jordan (%)
Place of birth for the foreign-born population - Kuwait (%)
Place of birth for the foreign-born population - Lebanon (%)
Place of birth for the foreign-born population - Saudi Arabia (%)
Place of birth for the foreign-born population - Syria (%)
Place of birth for the foreign-born population - Turkey (%)
Place of birth for the foreign-born population - Yemen (%)
Place of birth for the foreign-born population - Other Western Asia (%)
Place of birth for the foreign-born population - Eritrea (%)
Place of birth for the foreign-born population - Ethiopia (%)
Place of birth for the foreign-born population - Kenya (%)
Place of birth for the foreign-born population - Somalia (%)
Place of birth for the foreign-born population - Uganda (%)
Place of birth for the foreign-born population - Zimbabwe (%)
Place of birth for the foreign-born population - Other Eastern Africa (%)
Place of birth for the foreign-born population - Cameroon (%)
Place of birth for the foreign-born population - Congo (%)
Place of birth for the foreign-born population - Democratic Republic of Congo (Zaire) (%)
Place of birth for the foreign-born population - Other Middle Africa (%)
Place of birth for the foreign-born population - Egypt (%)
Place of birth for the foreign-born population - Morocco (%)
Place of birth for the foreign-born population - Sudan (%)
Place of birth for the foreign-born population - Other Northern Africa (%)
Place of birth for the foreign-born population - South Africa (%)
Place of birth for the foreign-born population - Other Southern Africa (%)
Place of birth for the foreign-born population - Cabo Verde (%)
Place of birth for the foreign-born population - Ghana (%)
Place of birth for the foreign-born population - Liberia (%)
Place of birth for the foreign-born population - Nigeria (%)
Place of birth for the foreign-born population - Senegal (%)
Place of birth for the foreign-born population - Sierra Leone (%)
Place of birth for the foreign-born population - Other Western Africa (%)
Place of birth for the foreign-born population - Australia (%)
Place of birth for the foreign-born population - New Zealand (%)
Place of birth for the foreign-born population - Fiji (%)
Place of birth for the foreign-born population - Micronesia (%)
Place of birth for the foreign-born population - Bahamas (%)
Place of birth for the foreign-born population - Barbados (%)
Place of birth for the foreign-born population - Cuba (%)
Place of birth for the foreign-born population - Dominica (%)
Place of birth for the foreign-born population - Dominican Republic (%)
Place of birth for the foreign-born population - Grenada (%)
Place of birth for the foreign-born population - Haiti (%)
Place of birth for the foreign-born population - Jamaica (%)
Place of birth for the foreign-born population - St. Vincent and the Grenadines (%)
Place of birth for the foreign-born population - Trinidad and Tobago (%)
Place of birth for the foreign-born population - West Indies (%)
Place of birth for the foreign-born population - Other Caribbean (%)
Place of birth for the foreign-born population - Belize (%)
Place of birth for the foreign-born population - Costa Rica (%)
Place of birth for the foreign-born population - El Salvador (%)
Place of birth for the foreign-born population - Guatemala (%)
Place of birth for the foreign-born population - Honduras (%)
Place of birth for the foreign-born population - Mexico (%)
Place of birth for the foreign-born population - Nicaragua (%)
Place of birth for the foreign-born population - Panama (%)
Place of birth for the foreign-born population - Other Central America (%)
Place of birth for the foreign-born population - Argentina (%)
Place of birth for the foreign-born population - Bolivia (%)
Place of birth for the foreign-born population - Brazil (%)
Place of birth for the foreign-born population - Chile (%)
Place of birth for the foreign-born population - Colombia (%)
Place of birth for the foreign-born population - Ecuador (%)
Place of birth for the foreign-born population - Guyana (%)
Place of birth for the foreign-born population - Peru (%)
Place of birth for the foreign-born population - Uruguay (%)
Place of birth for the foreign-born population - Venezuela (%)
Place of birth for the foreign-born population - Other South America (%)
Place of birth for the foreign-born population - Canada (%)
Place of birth for the foreign-born population - Other Northern America (%)
Place of birth for the foreign-born population - Other (%)
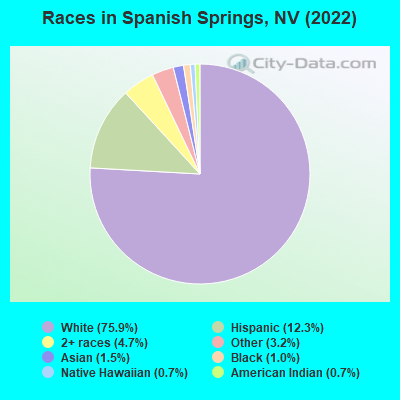
According to 2022 data, the most numerous races in Spanish Springs, NV are White alone (12,714 residents), Hispanic (2,064 residents), and Black alone (174 residents). 94.7% of Spanish Springs residents speak English at home. 4.7% of Spanish Springs, NV residents are foreign-born (2.2% born in Latin America, 1.5% born in Europe, 0.8% born in Asia), which is 282.8% less than the foreign-born rate of 18.0% across the entire state of Nevada.
Race distribution in Spanish Springs
2000 2022
1,303,001 65.2% White alone 393,970 19.7% Hispanic 131,509 6.6% Black alone 88,593 4.4% Asian alone 49,231 2.5% Two or more races 21,397 1.1% American Indian alone 7,769 0.4% Native Hawaiian and Other 2,787 0.1% Other race alone
1,410,145 44.4% White alone 961,357 30.3% Hispanic 286,471 9.0% Black alone 281,149 8.8% Asian alone 182,151 5.7% Two or more races 20,102 0.6% Native Hawaiian and Other 18,781 0.6% Other race alone 17,616 0.6% American Indian alone
Income and house value in Spanish Springs Median household income in 2022 $116,445 White non-Hispanic householders$89,286 Black householdersover $200,000 American Indian and Alaska Native householders$119,867 Asian householders$114,672 Some other race householders$149,078 Two or more races householders$110,990 Hispanic or Latino race householdersMedian 2022 house value $599,631 White Non-Hispanic householders$471,190 Black or African American householders$804,995 American Indian or Alaska Native householders $643,996 Asian householders$438,275 Some other race householders$583,889 Two or more races householders$579,596 Hispanic or Latino householders
Median age by race in Spanish Springs
50.8 Median age for White residents50.7 50.7 64.1 Median age for Black or African American residents67.4 66.1 58.8 Median age for American Indian / Alaska Native residents55.6 52.0 65.9 Median age for Asian residents62.6 62.2 36.3 Median age for Native Hawaiian / Pacific Islander residents39.3 17.3 52.4 Median age for Other race residents50.9 57.2 24.8 Median age for Two or more races residents16.8 29.0 49.5 Median age for White alone residents50.2 48.9 35.8 Median age for Hispanic or Latino residents35.6 37.1
Owner/renter occupied households by race in Spanish Springs
House owners and renters - White residents 4,651 88.3% Owner occupied614 11.7% Renter occupiedHouse owners and renters - Black or African American residents 79 64.1% Owner occupied44 35.9% Renter occupiedHouse owners and renters - American Indian / Alaska Native residents 10 23.1% Owner occupied33 76.9% Renter occupiedHouse owners and renters - Asian residents 136 100.0% Owner occupiedHouse owners and renters - Native Hawaiian / Pacific Islander residents 44 100.0% Owner occupiedHouse owners and renters - Other race residents 296 96.4% Owner occupied11 3.6% Renter occupiedHouse owners and renters - Two or more races residents 585 100.0% Owner occupiedHouse owners and renters - White alone residents 4,625 87.8% Owner occupied641 12.2% Renter occupiedHouse owners and renters - Hispanic or Latino residents 608 100.0% Owner occupied
Language usage in Spanish Springs
English speakers - Total 94.7% of residents of Spanish Springs speak English at home.
5.0% of residents speak Spanish at home 429 52.7% Speak English very well385 47.3% Speak English less than very well1.6% of residents speak other language at home 226 85.9% Speak English very well37 14.1% Speak English less than very well
English speakers - Born in the United States 97.5% of residents of Spanish Springs speak English at home.
2.6% of residents speak Spanish at home 199 82.2% Speak English very well43 17.8% Speak English less than very well0.2% of residents speak other language at home 17 100.0% Speak English very well
English speakers - Native, born elsewhere 48.6% of residents of Spanish Springs speak English at home.
52.7% of residents speak Spanish at home 61 52.1% Speak English very well56 47.9% Speak English less than very well
English speakers - Foreign-born 48.4% of residents of Spanish Springs speak English at home.
36.2% of residents speak Spanish at home 107 39.9% Speak English very well161 60.1% Speak English less than very well19.3% of residents speak other language at home 113 79.0% Speak English very well30 21.0% Speak English less than very well
White (Caucasian) - Speak only English Native:
100.0% (12,181)Foreign-born:
96.8% (195)
White (Caucasian) - Speak another language Native:
1.5% (181)Foreign-born:
29.4% (59)
American Indian / Alaska Native - Speak another language Native:
45.5% (89)Foreign-born:
61.4% (15)
Asian - Speak only English Native:
96.6% (137)Foreign-born:
72.4% (66)
Asian - Speak another language Native:
8.2% (12)Foreign-born:
31.3% (29)
Other race - Speak another language Native:
28.8% (156)Foreign-born:
90.1% (198)
Two or more races - Speak only English Native:
83.8% (1,631)Foreign-born:
23.6% (37)
Two or more races - Speak another language Native:
12.9% (252)Foreign-born:
68.9% (108)
White alone - Speak only English Native:
98.5% (11,814)Foreign-born:
67.5% (200)
White alone - Speak another language Native:
1.6% (187)Foreign-born:
34.0% (101)
Hispanic or Latino - Speak only English Native:
77.9% (1,309)Foreign-born:
15.6% (50)
Hispanic or Latino - Speak another language Native:
23.4% (392)Foreign-born:
82.3% (262)
Foreign-born residents in Spanish Springs 788 residents are foreign born (2.2% Latin America , 1.5% Europe , 0.8% Asia ).
This city:
4.7%Nevada:
19.1%
Marital status for residents in Spanish Springs Marital status - White (Caucasian) population 15 years and over
Males 20.1% Never married66.5% Now married1.3% Separated4.6% Widowed7.5% DivorcedFemales 17.9% Never married60.8% Now married1.0% Separated6.5% Widowed13.7% DivorcedWomen who gave birth in the past 12 months Now married:
82.6% (94)Unmarried:
17.4% (20)
Women who did not give birth in the past 12 months Now married:
52.5% (1,258)Unmarried:
47.5% (1,137)
Marital status - Black or African American population 15 years and over
Males 38.2% Never married52.9% Now married0.0% Separated0.0% Widowed8.8% DivorcedFemales 26.8% Never married63.4% Now married0.0% Separated0.0% Widowed9.8% DivorcedWomen who did not give birth in the past 12 months Now married:
0.0% (0)Unmarried:
100.0% (19)
Marital status - American Indian / Alaska Native population 15 years and over
Males 14.9% Never married85.1% Now married0.0% Separated0.0% Widowed0.0% DivorcedFemales 28.4% Never married38.2% Now married0.0% Separated4.9% Widowed28.4% DivorcedWomen who did not give birth in the past 12 months Now married:
100.0% (20)Unmarried:
0.0% (0)
Marital status - Asian population 15 years and over
Males 51.4% Never married48.6% Now married0.0% Separated0.0% Widowed0.0% DivorcedFemales 0.0% Never married100.0% Now married0.0% Separated0.0% Widowed0.0% DivorcedWomen who did not give birth in the past 12 months Now married:
100.0% (44)Unmarried:
0.0% (0)
Marital status - Native Hawaiian / Pacific Islander population 15 years and over
Males 28.9% Never married71.1% Now married0.0% Separated0.0% Widowed0.0% DivorcedFemales 29.5% Never married70.5% Now married0.0% Separated0.0% Widowed0.0% DivorcedWomen who did not give birth in the past 12 months Now married:
70.5% (33)Unmarried:
29.5% (14)
Marital status - Other race population 15 years and over
Males 40.8% Never married51.4% Now married0.0% Separated0.0% Widowed7.8% DivorcedFemales 17.0% Never married81.9% Now married0.0% Separated0.0% Widowed1.1% DivorcedWomen who gave birth in the past 12 months Now married:
100.0% (30)Unmarried:
0.0% (0)
Women who did not give birth in the past 12 months Now married:
63.0% (70)Unmarried:
37.0% (41)
Marital status - Two or more races population 15 years and over
Males 40.6% Never married52.5% Now married0.0% Separated0.0% Widowed6.9% DivorcedFemales 37.0% Never married49.5% Now married0.0% Separated1.9% Widowed11.5% DivorcedWomen who gave birth in the past 12 months Now married:
100.0% (12)Unmarried:
0.0% (0)
Women who did not give birth in the past 12 months Now married:
42.7% (250)Unmarried:
57.3% (336)
Marital status - White alone, not Hispanic / Latino population 15 years and over
Males 20.2% Never married66.3% Now married1.1% Separated4.8% Widowed7.7% DivorcedFemales 18.3% Never married60.3% Now married1.1% Separated6.2% Widowed14.2% DivorcedWomen who gave birth in the past 12 months Now married:
82.6% (99)Unmarried:
17.4% (21)
Women who did not give birth in the past 12 months Now married:
52.0% (1,278)Unmarried:
48.0% (1,180)
Marital status - Hispanic or Latino population 15 years and over
Males 41.4% Never married52.0% Now married1.9% Separated0.0% Widowed4.6% DivorcedFemales 19.9% Never married66.5% Now married0.0% Separated4.6% Widowed9.0% DivorcedWomen who gave birth in the past 12 months Now married:
100.0% (39)Unmarried:
0.0% (0)
Women who did not give birth in the past 12 months Now married:
50.5% (219)Unmarried:
49.5% (215)
Ancestries in Spanish Springs
756 10.5% European709 9.9% American690 9.6% German574 8.0% English435 6.1% Irish247 3.4% Italian196 2.7% Swedish169 2.4% Scottish152 2.1% Eastern European130 1.8% Polish113 1.6% Lithuanian97 1.4% Hungarian95 1.3% Northern European90 1.3% French Canadian63 0.9% Norwegian59 0.8% Portuguese58 0.8% Dutch52 0.7% British45 0.6% Brazilian35 0.5% Basque32 0.4% French28 0.4% Russian28 0.4% Scotch-Irish25 0.3% Palestinian20 0.3% Czech20 0.3% Yugoslavian16 0.2% Danish14 0.2% Belgian14 0.2% Serbian14 0.2% Swiss14 0.2% Welsh10 0.1% Lebanese7 0.10% Scandinavian7 0.10% Canadian
Children Nativity (place of birth) in Spanish Springs
Children under 6 years - Living with two parents Both parents native 521 96.1% Native21 3.9% Foreign-bornOne native, one foreign-born parent 29 100.0% NativeChildren under 6 years - Living with one parent Native parent 168 100.0% NativeChildren 6 to 17 years - Living with two parents Both parents native 1,557 100.0% NativeBoth parents foreign-born 10 100.0% NativeOne native, one foreign-born parent 267 100.0% NativeChildren 6 to 17 years - Living with one parent Native parent 562 100.0% NativeForeign-born parent 83 50.4% Native82 49.6% Foreign-born
Grandparents responsible for own grandchildren in Spanish Springs
Grandparents (30 to 59 years) White / Caucasian 35 37.3% Responsible for grandchildren59 62.7% Not responsible for grandchildrenAmerican Indian / Alaska Native 2 100.0% Responsible for grandchildrenOther race 102 100.0% Not responsible for grandchildrenWhite alone, not Hispanic / Latino 35 51.0% Responsible for grandchildren33 49.0% Not responsible for grandchildrenGrandparents (60 years and over) White / Caucasian 115 50.9% Responsible for grandchildren110 49.1% Not responsible for grandchildrenAmerican Indian / Alaska Native 10 100.0% Not responsible for grandchildrenWhite alone, not Hispanic / Latino 119 48.0% Responsible for grandchildren129 52.0% Not responsible for grandchildren