Races in Sand Lake, New York (NY) Detailed Stats
Ancestries, Foreign-born residents, place of birth

Recent posts about races in Sand Lake, New York on our local forum with over 2,400,000 registered users:
 | Moving to Albany area (6 replies) |
| Very interesting urban schools article (13 replies) |
| Possible relocation...Looking for some information (15 replies) |
| Best Place to Live in and Around the Capital Region? (80 replies) |
| Albany NY redevelopment??? (9 replies) |
1.3% of Sand Lake, NY residents are foreign-born , which is 1573.5% less than the foreign-born rate of 22.0% across the entire state of New York.
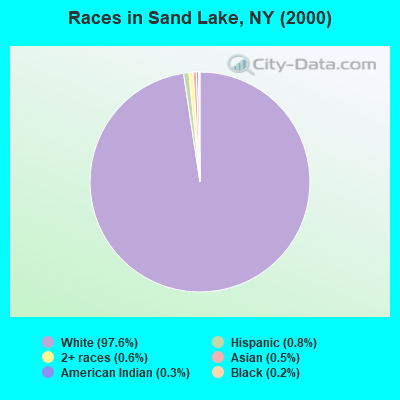
Race distribution in Sand Lake

- 7,79997.6%White alone
- 660.8%Hispanic
- 460.6%Two or more races
- 370.5%Asian alone
- 230.3%American Indian alone
- 160.2%Black alone
2000
2022
-
- 11,760,98162.0%White alone
- 2,867,58315.1%Hispanic
- 2,812,62314.8%Black alone
- 1,035,9265.5%Asian alone
- 366,1161.9%Two or more races
- 75,4990.4%Other race alone
- 52,4990.3%American Indian alone
- 5,2300.03%Native Hawaiian and Other
Pacific Islander alone

-
- 10,408,93352.9%White alone
- 3,867,29919.7%Hispanic
- 2,633,84013.4%Black alone
- 1,776,2869.0%Asian alone
- 732,6703.7%Two or more races
- 216,1101.1%Other race alone
- 35,0820.2%American Indian alone
- 6,9310.04%Native Hawaiian and Other
Pacific Islander alone

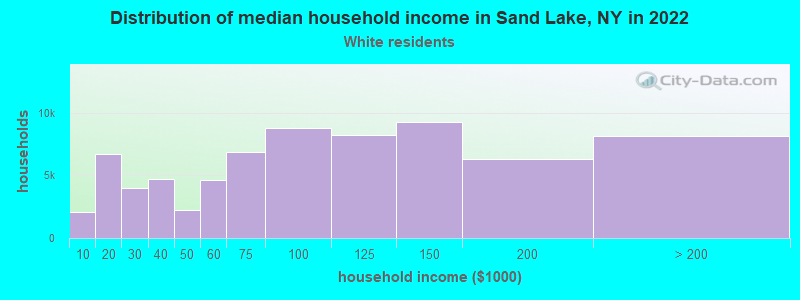
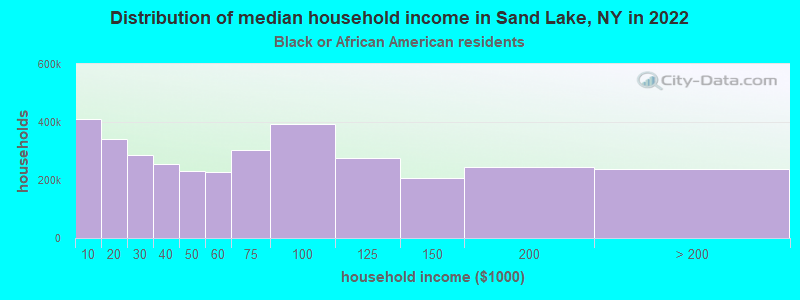
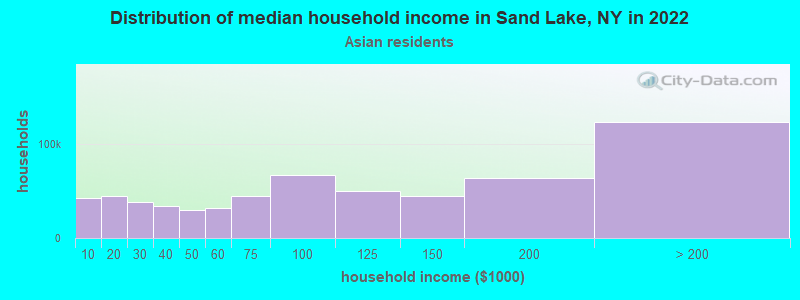
Income and house value in Sand Lake
- Median household income in 2022
- $115,260White non-Hispanic householders
- over $200,000Black householders
- over $200,000Asian householders
- Median 2022 house value
- $307,259White Non-Hispanic householders
- $685,291Black or African American householders
Household income for White non-Hispanic householders
Household income for Black householders
Household income for Asian householders
Foreign-born residents in Sand Lake
105 residents are foreign born
| This city: | 1.3% |
| New York: | 20.4% |
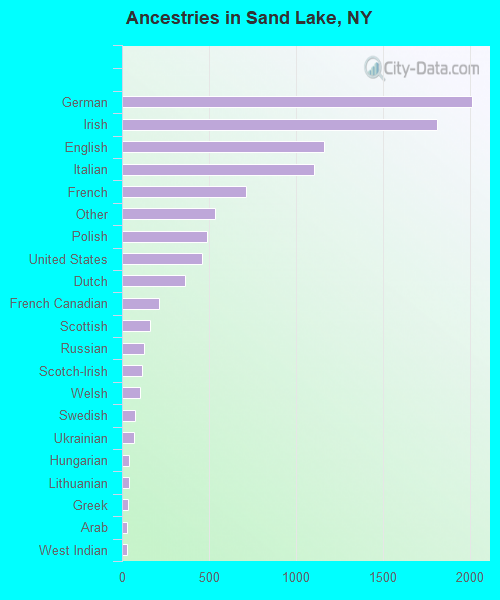
Ancestries in Sand Lake

- 2,00920.7%German
- 1,80818.6%Irish
- 1,16312.0%English
- 1,10411.4%Italian
- 7127.3%French
- 5355.5%Other
- 4885.0%Polish
- 4604.7%United States
- 3633.7%Dutch
- 2122.2%French Canadian
- 1621.7%Scottish
- 1241.3%Russian
- 1131.2%Scotch-Irish
- 1041.1%Welsh
- 770.8%Swedish
- 700.7%Ukrainian
- 430.4%Hungarian
- 430.4%Lithuanian
- 370.4%Greek
- 290.3%Arab
- 270.3%West Indian
- 120.1%Slovak
- 80.08%Norwegian
- 70.07%Danish
- 70.07%Swiss
- 60.06%Portuguese
Zip codes: 12018.