Races in San Diego, California (CA) Detailed Stats
Data:
Races - White alone (%)
Races - White alone (% change since 2000)
Races - Black alone (%)
Races - Black alone (% change since 2000)
Races - American Indian alone (%)
Races - American Indian alone (% change since 2000)
Races - Asian alone (%)
Races - Asian alone (% change since 2000)
Races - Hispanic (%)
Races - Hispanic (% change since 2000)
Races - Native Hawaiian and Other Pacific Islander alone (%)
Races - Native Hawaiian and Other Pacific Islander alone (% change since 2000)
Races - Two or more races(%)
Races - Two or more races(% change since 2000)
Races - Other race alone (%)
Races - Other race alone (% change since 2000)
Racial diversity
Place of birth - Born in state of residence (%)
Place of birth - Born in state of residence (%) - White
Place of birth - Born in state of residence (%) - Black or African American
Place of birth - Born in state of residence (%) - Asian
Place of birth - Born in state of residence (%) - Hispanic or Latino
Place of birth - Born in state of residence (%) - American Indian and Alaska Native
Place of birth - Born in state of residence (%) - Multirace
Place of birth - Born in state of residence (%) - Other Race
Place of birth - Born in other state (%)
Place of birth - Born in other state (%) - White
Place of birth - Born in other state (%) - Black or African American
Place of birth - Born in other state (%) - Asian
Place of birth - Born in other state (%) - Hispanic or Latino
Place of birth - Born in other state (%) - American Indian and Alaska Native
Place of birth - Born in other state (%) - Multirace
Place of birth - Born in other state (%) - Other Race
Place of birth - Native, outside of US (%)
Place of birth - Native, outside of US (%) - White
Place of birth - Native, outside of US (%) - Black or African American
Place of birth - Native, outside of US (%) - Asian
Place of birth - Native, outside of US (%) - Hispanic or Latino
Place of birth - Native, outside of US (%) - American Indian and Alaska Native
Place of birth - Native, outside of US (%) - Multirace
Place of birth - Native, outside of US (%) - Other Race
Place of birth - Foreign born (%)
Place of birth - Foreign born (%) - White
Place of birth - Foreign born (%) - Black or African American
Place of birth - Foreign born (%) - Asian
Place of birth - Foreign born (%) - Hispanic or Latino
Place of birth - Foreign born (%) - American Indian and Alaska Native
Place of birth - Foreign born (%) - Multirace
Place of birth - Foreign born (%) - Other Race
Residents speaking English at home (%)
Residents speaking English at home - Born in the United States (%)
Residents speaking English at home - Native, born elsewhere (%)
Residents speaking English at home - Foreign born (%)
Residents speaking Spanish at home (%)
Residents speaking Spanish at home - Born in the United States (%)
Residents speaking Spanish at home - Native, born elsewhere (%)
Residents speaking Spanish at home - Foreign born (%)
Residents speaking other language at home (%)
Residents speaking other language at home - Born in the United States (%)
Residents speaking other language at home - Native, born elsewhere (%)
Residents speaking other language at home - Foreign born (%)
Marital status - Never married (%)
Marital status - Now married (%)
Marital status - Separated (%)
Marital status - Widowed (%)
Marital status - Divorced (%)
Ancestries Reported - Arab (%)
Ancestries Reported - Czech (%)
Ancestries Reported - Danish (%)
Ancestries Reported - Dutch (%)
Ancestries Reported - English (%)
Ancestries Reported - French (%)
Ancestries Reported - French Canadian (%)
Ancestries Reported - German (%)
Ancestries Reported - Greek (%)
Ancestries Reported - Hungarian (%)
Ancestries Reported - Irish (%)
Ancestries Reported - Italian (%)
Ancestries Reported - Lithuanian (%)
Ancestries Reported - Norwegian (%)
Ancestries Reported - Polish (%)
Ancestries Reported - Portuguese (%)
Ancestries Reported - Russian (%)
Ancestries Reported - Scotch-Irish (%)
Ancestries Reported - Scottish (%)
Ancestries Reported - Slovak (%)
Ancestries Reported - Subsaharan African (%)
Ancestries Reported - Swedish (%)
Ancestries Reported - Swiss (%)
Ancestries Reported - Ukrainian (%)
Ancestries Reported - United States (%)
Ancestries Reported - Welsh (%)
Ancestries Reported - West Indian (%)
Ancestries Reported - Other (%)
Geographical mobility - Same house 1 year ago (%)
Geographical mobility - Same house 1 year ago (%) - White
Geographical mobility - Same house 1 year ago (%) - Black or African American
Geographical mobility - Same house 1 year ago (%) - Asian
Geographical mobility - Same house 1 year ago (%) - Hispanic or Latino
Geographical mobility - Same house 1 year ago (%) - American Indian and Alaska Native
Geographical mobility - Same house 1 year ago (%) - Multirace
Geographical mobility - Same house 1 year ago (%) - Other Race
Geographical mobility - Moved within same county (%)
Geographical mobility - Moved within same county (%) - White
Geographical mobility - Moved within same county (%) - Black or African American
Geographical mobility - Moved within same county (%) - Asian
Geographical mobility - Moved within same county (%) - Hispanic or Latino
Geographical mobility - Moved within same county (%) - American Indian and Alaska Native
Geographical mobility - Moved within same county (%) - Multirace
Geographical mobility - Moved within same county (%) - Other Race
Geographical mobility - Moved from different county within same state (%)
Geographical mobility - Moved from different county within same state (%) - White
Geographical mobility - Moved from different county within same state (%) - Black or African American
Geographical mobility - Moved from different county within same state (%) - Asian
Geographical mobility - Moved from different county within same state (%) - Hispanic or Latino
Geographical mobility - Moved from different county within same state (%) - American Indian and Alaska Native
Geographical mobility - Moved from different county within same state (%) - Multirace
Geographical mobility - Moved from different county within same state (%) - Other Race
Geographical mobility - Moved from different state (%)
Geographical mobility - Moved from different state (%) - White
Geographical mobility - Moved from different state (%) - Black or African American
Geographical mobility - Moved from different state (%) - Asian
Geographical mobility - Moved from different state (%) - Hispanic or Latino
Geographical mobility - Moved from different state (%) - American Indian and Alaska Native
Geographical mobility - Moved from different state (%) - Multirace
Geographical mobility - Moved from different state (%) - Other Race
Geographical mobility - Moved from abroad (%)
Geographical mobility - Moved from abroad (%) - White
Geographical mobility - Moved from abroad (%) - Black or African American
Geographical mobility - Moved from abroad (%) - Asian
Geographical mobility - Moved from abroad (%) - Hispanic or Latino
Geographical mobility - Moved from abroad (%) - American Indian and Alaska Native
Geographical mobility - Moved from abroad (%) - Multirace
Geographical mobility - Moved from abroad (%) - Other Race
Place of birth for the foreign-born population - Ireland (%)
Place of birth for the foreign-born population - Denmark (%)
Place of birth for the foreign-born population - Norway (%)
Place of birth for the foreign-born population - Sweden (%)
Place of birth for the foreign-born population - United Kingdom (%)
Place of birth for the foreign-born population - England (%)
Place of birth for the foreign-born population - Scotland (%)
Place of birth for the foreign-born population - Other Northern Europe (%)
Place of birth for the foreign-born population - Austria (%)
Place of birth for the foreign-born population - Belgium (%)
Place of birth for the foreign-born population - France (%)
Place of birth for the foreign-born population - Germany (%)
Place of birth for the foreign-born population - Netherlands (%)
Place of birth for the foreign-born population - Switzerland (%)
Place of birth for the foreign-born population - Other Western Europe (%)
Place of birth for the foreign-born population - Greece (%)
Place of birth for the foreign-born population - Italy (%)
Place of birth for the foreign-born population - Portugal (%)
Place of birth for the foreign-born population - Spain (%)
Place of birth for the foreign-born population - Other Southern Europe (%)
Place of birth for the foreign-born population - Albania (%)
Place of birth for the foreign-born population - Belarus (%)
Place of birth for the foreign-born population - Bosnia and Herzegovina (%)
Place of birth for the foreign-born population - Bulgaria (%)
Place of birth for the foreign-born population - Croatia (%)
Place of birth for the foreign-born population - Czechoslovakia (%)
Place of birth for the foreign-born population - Hungary (%)
Place of birth for the foreign-born population - Latvia (%)
Place of birth for the foreign-born population - Lithuania (%)
Place of birth for the foreign-born population - North Macedonia (Macedonia) (%)
Place of birth for the foreign-born population - Moldova (%)
Place of birth for the foreign-born population - Poland (%)
Place of birth for the foreign-born population - Romania (%)
Place of birth for the foreign-born population - Russia (%)
Place of birth for the foreign-born population - Serbia (%)
Place of birth for the foreign-born population - Ukraine (%)
Place of birth for the foreign-born population - Other Eastern Europe (%)
Place of birth for the foreign-born population - China (%)
Place of birth for the foreign-born population - Hong Kong (%)
Place of birth for the foreign-born population - Taiwan (%)
Place of birth for the foreign-born population - Japan (%)
Place of birth for the foreign-born population - Korea (%)
Place of birth for the foreign-born population - Other Eastern Asia (%)
Place of birth for the foreign-born population - Afghanistan (%)
Place of birth for the foreign-born population - Bangladesh (%)
Place of birth for the foreign-born population - India (%)
Place of birth for the foreign-born population - Iran (%)
Place of birth for the foreign-born population - Kazakhstan (%)
Place of birth for the foreign-born population - Nepal (%)
Place of birth for the foreign-born population - Pakistan (%)
Place of birth for the foreign-born population - Sri Lanka (%)
Place of birth for the foreign-born population - Uzbekistan (%)
Place of birth for the foreign-born population - Other South Central Asia (%)
Place of birth for the foreign-born population - Burma (%)
Place of birth for the foreign-born population - Cambodia (%)
Place of birth for the foreign-born population - Indonesia (%)
Place of birth for the foreign-born population - Laos (%)
Place of birth for the foreign-born population - Malaysia (%)
Place of birth for the foreign-born population - Philippines (%)
Place of birth for the foreign-born population - Singapore (%)
Place of birth for the foreign-born population - Thailand (%)
Place of birth for the foreign-born population - Vietnam (%)
Place of birth for the foreign-born population - Other South Eastern Asia (%)
Place of birth for the foreign-born population - Armenia (%)
Place of birth for the foreign-born population - Iraq (%)
Place of birth for the foreign-born population - Israel (%)
Place of birth for the foreign-born population - Jordan (%)
Place of birth for the foreign-born population - Kuwait (%)
Place of birth for the foreign-born population - Lebanon (%)
Place of birth for the foreign-born population - Saudi Arabia (%)
Place of birth for the foreign-born population - Syria (%)
Place of birth for the foreign-born population - Turkey (%)
Place of birth for the foreign-born population - Yemen (%)
Place of birth for the foreign-born population - Other Western Asia (%)
Place of birth for the foreign-born population - Eritrea (%)
Place of birth for the foreign-born population - Ethiopia (%)
Place of birth for the foreign-born population - Kenya (%)
Place of birth for the foreign-born population - Somalia (%)
Place of birth for the foreign-born population - Uganda (%)
Place of birth for the foreign-born population - Zimbabwe (%)
Place of birth for the foreign-born population - Other Eastern Africa (%)
Place of birth for the foreign-born population - Cameroon (%)
Place of birth for the foreign-born population - Congo (%)
Place of birth for the foreign-born population - Democratic Republic of Congo (Zaire) (%)
Place of birth for the foreign-born population - Other Middle Africa (%)
Place of birth for the foreign-born population - Egypt (%)
Place of birth for the foreign-born population - Morocco (%)
Place of birth for the foreign-born population - Sudan (%)
Place of birth for the foreign-born population - Other Northern Africa (%)
Place of birth for the foreign-born population - South Africa (%)
Place of birth for the foreign-born population - Other Southern Africa (%)
Place of birth for the foreign-born population - Cabo Verde (%)
Place of birth for the foreign-born population - Ghana (%)
Place of birth for the foreign-born population - Liberia (%)
Place of birth for the foreign-born population - Nigeria (%)
Place of birth for the foreign-born population - Senegal (%)
Place of birth for the foreign-born population - Sierra Leone (%)
Place of birth for the foreign-born population - Other Western Africa (%)
Place of birth for the foreign-born population - Australia (%)
Place of birth for the foreign-born population - New Zealand (%)
Place of birth for the foreign-born population - Fiji (%)
Place of birth for the foreign-born population - Micronesia (%)
Place of birth for the foreign-born population - Bahamas (%)
Place of birth for the foreign-born population - Barbados (%)
Place of birth for the foreign-born population - Cuba (%)
Place of birth for the foreign-born population - Dominica (%)
Place of birth for the foreign-born population - Dominican Republic (%)
Place of birth for the foreign-born population - Grenada (%)
Place of birth for the foreign-born population - Haiti (%)
Place of birth for the foreign-born population - Jamaica (%)
Place of birth for the foreign-born population - St. Vincent and the Grenadines (%)
Place of birth for the foreign-born population - Trinidad and Tobago (%)
Place of birth for the foreign-born population - West Indies (%)
Place of birth for the foreign-born population - Other Caribbean (%)
Place of birth for the foreign-born population - Belize (%)
Place of birth for the foreign-born population - Costa Rica (%)
Place of birth for the foreign-born population - El Salvador (%)
Place of birth for the foreign-born population - Guatemala (%)
Place of birth for the foreign-born population - Honduras (%)
Place of birth for the foreign-born population - Mexico (%)
Place of birth for the foreign-born population - Nicaragua (%)
Place of birth for the foreign-born population - Panama (%)
Place of birth for the foreign-born population - Other Central America (%)
Place of birth for the foreign-born population - Argentina (%)
Place of birth for the foreign-born population - Bolivia (%)
Place of birth for the foreign-born population - Brazil (%)
Place of birth for the foreign-born population - Chile (%)
Place of birth for the foreign-born population - Colombia (%)
Place of birth for the foreign-born population - Ecuador (%)
Place of birth for the foreign-born population - Guyana (%)
Place of birth for the foreign-born population - Peru (%)
Place of birth for the foreign-born population - Uruguay (%)
Place of birth for the foreign-born population - Venezuela (%)
Place of birth for the foreign-born population - Other South America (%)
Place of birth for the foreign-born population - Canada (%)
Place of birth for the foreign-born population - Other Northern America (%)
Place of birth for the foreign-born population - Other (%)
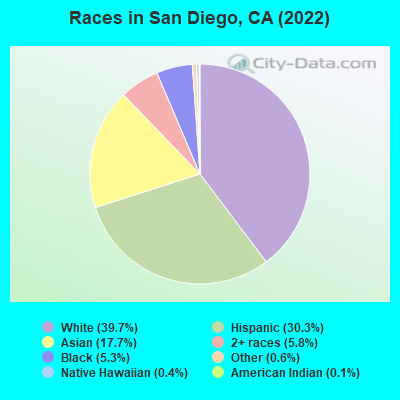
According to 2022 data, the most numerous races in San Diego, CA are Hispanic (439,647 residents), White alone (575,680 residents), and Asian alone (249,761 residents). 59.9% of San Diego residents speak English at home. 24.9% of San Diego, CA residents are foreign-born (11.7% born in Asia, 9.6% born in Latin America), which is 4.3% less than the foreign-born rate of 26.0% across the entire state of California.
Race distribution in San Diego
2000 2022
603,892 49.4% White alone 310,752 25.4% Hispanic 164,895 13.5% Asian alone 92,830 7.6% Black alone 38,388 3.1% Two or more races 5,311 0.4% Native Hawaiian and Other 3,065 0.3% Other race alone 4,267 0.3% American Indian alone
575,680 40.4% White alone 439,647 30.8% Hispanic 249,761 17.5% Asian alone 80,256 5.6% Black alone 65,190 4.6% Two or more races 5,693 0.4% Native Hawaiian and Other 4,767 0.3% Other race alone 2,469 0.2% American Indian alone
2000 2022
15,816,790 46.7% White alone 10,966,556 32.4% Hispanic 3,648,860 10.8% Asian alone 2,181,926 6.4% Black alone 903,115 2.7% Two or more races 178,984 0.5% American Indian alone 103,736 0.3% Native Hawaiian and Other 71,681 0.2% Other race alone
15,732,184 40.3% Hispanic 13,160,426 33.7% White alone 5,957,867 15.3% Asian alone 2,025,218 5.2% Black alone 1,663,222 4.3% Two or more races 251,618 0.6% Other race alone 135,777 0.3% Native Hawaiian and Other 103,030 0.3% American Indian alone
Income and house value in San Diego Median household income in 2022 $117,960 White non-Hispanic householders$66,443 Black householders$80,816 American Indian and Alaska Native householders$122,351 Asian householders$83,515 Native Hawaiian and other Pacific Islander householders$81,638 Some other race householders$102,211 Two or more races householders$78,141 Hispanic or Latino race householdersMedian 2022 house value $944,095 White Non-Hispanic householders$560,050 Black or African American householders$665,149 American Indian or Alaska Native householders $734,616 Asian householders$705,821 Native Hawaiian and other Pacific Islander householders$537,014 Some other race householders$717,699 Two or more races householders$575,887 Hispanic or Latino householders
Median age by race in San Diego
38.8 Median age for White residents38.0 39.9 34.3 Median age for Black or African American residents33.6 36.2 34.6 Median age for American Indian / Alaska Native residents31.7 47.6 37.3 Median age for Asian residents35.9 38.7 45.7 Median age for Native Hawaiian / Pacific Islander residents47.2 46.1 32.6 Median age for Other race residents31.3 33.8 30.1 Median age for Two or more races residents29.9 31.0 40.6 Median age for White alone residents39.8 41.4 31.4 Median age for Hispanic or Latino residents30.8 32.2
Owner/renter occupied households by race in San Diego
House owners and renters - White residents 154,341 49.7% Owner occupied155,992 50.3% Renter occupiedHouse owners and renters - Black or African American residents 8,804 28.8% Owner occupied21,764 71.2% Renter occupiedHouse owners and renters - American Indian / Alaska Native residents 1,277 34.2% Owner occupied2,458 65.8% Renter occupiedHouse owners and renters - Asian residents 46,768 55.3% Owner occupied37,794 44.7% Renter occupiedHouse owners and renters - Native Hawaiian / Pacific Islander residents 344 14.5% Owner occupied2,031 85.5% Renter occupiedHouse owners and renters - Other race residents 7,187 33.3% Owner occupied14,411 66.7% Renter occupiedHouse owners and renters - Two or more races residents 26,904 45.2% Owner occupied32,593 54.8% Renter occupiedHouse owners and renters - White alone residents 136,811 52.8% Owner occupied122,167 47.2% Renter occupiedHouse owners and renters - Hispanic or Latino residents 43,396 35.2% Owner occupied80,024 64.8% Renter occupied
Language usage in San Diego
English speakers - Total 59.9% of residents of San Diego speak English at home.
22.5% of residents speak Spanish at home 197,596 65.6% Speak English very well103,534 34.4% Speak English less than very well17.8% of residents speak other language at home 147,822 62.2% Speak English very well89,822 37.8% Speak English less than very well
English speakers - Born in the United States 91.2% of residents of San Diego speak English at home.
4.8% of residents speak Spanish at home 14,407 87.8% Speak English very well1,999 12.2% Speak English less than very well4.0% of residents speak other language at home 12,118 89.5% Speak English very well1,424 10.5% Speak English less than very well
English speakers - Native, born elsewhere 58.1% of residents of San Diego speak English at home.
23.2% of residents speak Spanish at home 5,395 78.9% Speak English very well1,439 21.1% Speak English less than very well18.6% of residents speak other language at home 4,754 86.7% Speak English very well729 13.3% Speak English less than very well
English speakers - Foreign-born 14.5% of residents of San Diego speak English at home.
36.1% of residents speak Spanish at home 47,795 36.6% Speak English very well82,944 63.4% Speak English less than very well50.3% of residents speak other language at home 99,968 54.8% Speak English very well82,534 45.2% Speak English less than very well
White (Caucasian) - Speak only English Native:
84.7% (520,274)Foreign-born:
21.8% (22,964)
White (Caucasian) - Speak another language Native:
15.3% (94,180)Foreign-born:
79.3% (83,535)
Black or African American - Speak only English Native:
93.0% (61,643)Foreign-born:
15.0% (1,995)
Black or African American - Speak another language Native:
7.2% (4,755)Foreign-born:
84.9% (11,325)
American Indian / Alaska Native - Speak only English Native:
51.9% (3,881)Foreign-born:
19.9% (329)
American Indian / Alaska Native - Speak another language Native:
55.6% (4,162)Foreign-born:
79.8% (1,319)
Asian - Speak only English Native:
70.8% (65,102)Foreign-born:
13.3% (20,019)
Asian - Speak another language Native:
30.1% (27,627)Foreign-born:
86.9% (131,148)
Native Hawaiian / Pacific Islander - Speak only English Native:
87.4% (4,190)Foreign-born:
29.4% (109)
Native Hawaiian / Pacific Islander - Speak another language Native:
16.2% (775)Foreign-born:
74.0% (275)
Other race - Speak only English Native:
38.0% (18,738)Foreign-born:
15.3% (4,476)
Other race - Speak another language Native:
62.9% (31,059)Foreign-born:
87.6% (25,688)
Two or more races - Speak only English Native:
65.2% (99,860)Foreign-born:
11.9% (4,601)
Two or more races - Speak another language Native:
32.5% (49,815)Foreign-born:
85.7% (32,988)
White alone - Speak only English Native:
95.2% (473,328)Foreign-born:
34.5% (19,973)
White alone - Speak another language Native:
4.8% (23,617)Foreign-born:
65.5% (37,933)
Hispanic or Latino - Speak only English Native:
42.7% (121,103)Foreign-born:
8.6% (10,857)
Hispanic or Latino - Speak another language Native:
57.3% (162,501)Foreign-born:
92.2% (116,737)
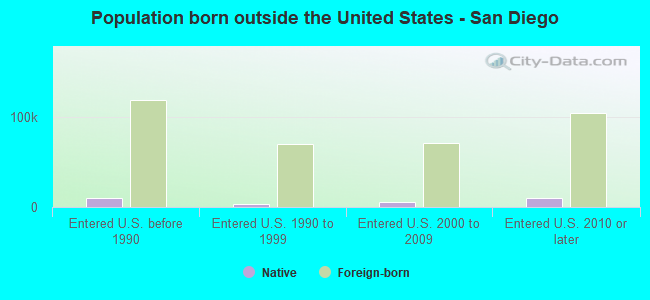
Foreign-born residents in San Diego 355,604 residents are foreign born (11.7% Asia , 9.6% Latin America ).
This city:
24.9%California:
100.0%
Marital status for residents in San Diego Marital status - White (Caucasian) population 15 years and over
Males 41.3% Never married46.8% Now married1.4% Separated1.8% Widowed8.7% DivorcedFemales 35.2% Never married44.3% Now married2.4% Separated6.4% Widowed11.8% DivorcedWomen who gave birth in the past 12 months Now married:
84.3% (6,567)Unmarried:
15.7% (1,224)
Women who did not give birth in the past 12 months Now married:
40.0% (70,220)Unmarried:
60.0% (105,131)
Marital status - Black or African American population 15 years and over
Males 50.8% Never married35.3% Now married4.3% Separated1.6% Widowed8.0% DivorcedFemales 43.2% Never married31.7% Now married1.4% Separated7.9% Widowed15.8% DivorcedWomen who gave birth in the past 12 months Now married:
68.1% (1,023)Unmarried:
31.9% (478)
Women who did not give birth in the past 12 months Now married:
22.6% (4,344)Unmarried:
77.4% (14,844)
Marital status - American Indian / Alaska Native population 15 years and over
Males 52.1% Never married39.1% Now married0.0% Separated0.0% Widowed8.8% DivorcedFemales 33.2% Never married47.6% Now married0.0% Separated6.8% Widowed12.4% DivorcedWomen who gave birth in the past 12 months Now married:
22.7% (32)Unmarried:
77.3% (111)
Women who did not give birth in the past 12 months Now married:
35.7% (728)Unmarried:
64.3% (1,312)
Marital status - Asian population 15 years and over
Males 41.4% Never married52.4% Now married0.7% Separated1.3% Widowed4.2% DivorcedFemales 29.9% Never married53.1% Now married1.2% Separated7.7% Widowed8.1% DivorcedWomen who gave birth in the past 12 months Now married:
76.8% (2,965)Unmarried:
23.2% (898)
Women who did not give birth in the past 12 months Now married:
51.0% (35,645)Unmarried:
49.0% (34,263)
Marital status - Native Hawaiian / Pacific Islander population 15 years and over
Males 21.8% Never married45.3% Now married0.0% Separated15.3% Widowed17.5% DivorcedFemales 44.0% Never married30.3% Now married0.0% Separated1.3% Widowed24.4% DivorcedWomen who gave birth in the past 12 months Now married:
91.5% (76)Unmarried:
8.5% (7)
Women who did not give birth in the past 12 months Now married:
31.8% (604)Unmarried:
68.2% (1,296)
Marital status - Other race population 15 years and over
Males 47.3% Never married43.0% Now married0.9% Separated0.9% Widowed7.8% DivorcedFemales 40.0% Never married45.3% Now married1.4% Separated4.9% Widowed8.4% DivorcedWomen who gave birth in the past 12 months Now married:
73.9% (589)Unmarried:
26.1% (208)
Women who did not give birth in the past 12 months Now married:
41.7% (9,960)Unmarried:
58.3% (13,921)
Marital status - Two or more races population 15 years and over
Males 56.7% Never married36.2% Now married0.7% Separated1.7% Widowed4.6% DivorcedFemales 52.1% Never married33.7% Now married2.2% Separated1.7% Widowed10.4% DivorcedWomen who gave birth in the past 12 months Now married:
70.2% (2,159)Unmarried:
29.8% (916)
Women who did not give birth in the past 12 months Now married:
31.9% (18,273)Unmarried:
68.1% (39,049)
Marital status - White alone, not Hispanic / Latino population 15 years and over
Males 39.5% Never married48.1% Now married0.9% Separated1.8% Widowed9.7% DivorcedFemales 33.0% Never married46.6% Now married1.4% Separated6.4% Widowed12.7% DivorcedWomen who gave birth in the past 12 months Now married:
93.1% (5,668)Unmarried:
6.9% (422)
Women who did not give birth in the past 12 months Now married:
40.7% (52,857)Unmarried:
59.3% (77,091)
Marital status - Hispanic or Latino population 15 years and over
Males 46.8% Never married42.9% Now married2.1% Separated1.6% Widowed6.5% DivorcedFemales 40.6% Never married40.3% Now married3.8% Separated5.7% Widowed9.6% DivorcedWomen who gave birth in the past 12 months Now married:
64.2% (3,246)Unmarried:
35.8% (1,807)
Women who did not give birth in the past 12 months Now married:
39.0% (44,956)Unmarried:
61.0% (70,348)
Ancestries in San Diego
23,158 2.9% American22,964 2.9% European18,111 2.3% German18,050 2.3% English16,923 2.1% Irish14,252 1.8% Italian8,794 1.1% Iranian6,797 0.9% Russian5,832 0.7% Polish4,523 0.6% Scottish4,448 0.6% Eastern European4,109 0.5% Somali4,007 0.5% French3,953 0.5% Portuguese3,315 0.4% Scandinavian3,147 0.4% British3,106 0.4% Brazilian2,780 0.4% Norwegian2,735 0.3% African2,691 0.3% Northern European2,364 0.3% Ethiopian2,225 0.3% Dutch2,179 0.3% Scotch-Irish2,151 0.3% Swedish1,965 0.2% Ukrainian1,910 0.2% Afghan1,702 0.2% Bulgarian1,681 0.2% Armenian1,542 0.2% French Canadian1,496 0.2% Lebanese1,452 0.2% Turkish1,444 0.2% Greek1,250 0.2% Egyptian1,241 0.2% Hungarian1,229 0.2% Ugandan1,087 0.1% South African1,000 0.1% Romanian819 0.1% Slovak817 0.1% Haitian779 0.10% Danish777 0.10% Belgian704 0.09% Nigerian700 0.09% Moroccan655 0.08% Israeli631 0.08% Austrian600 0.08% Finnish563 0.07% Jamaican556 0.07% Serbian526 0.07% Czech484 0.06% Canadian430 0.05% Iraqi413 0.05% Croatian388 0.05% Swiss382 0.05% Lithuanian345 0.04% Assyrian343 0.04% Welsh312 0.04% Czechoslovakian308 0.04% Albanian305 0.04% Jordanian269 0.03% Estonian210 0.03% Yugoslavian198 0.03% Ghanaian176 0.02% British West Indian163 0.02% Palestinian144 0.02% Basque122 0.02% Australian105 0.01% Kenyan105 0.01% Celtic91 0.01% Cypriot83 0.01% Slovene82 0.01% Trinidadian and Tobagonian59 0.01% Cajun58 0.01% West Indian54 0.01% Latvian52 0.01% Cape Verdean52 0.01% Syrian41 0.01% Zimbabwean40 0.01% New Zealander
Geographical mobility in San Diego Same house 1 year ago 649,681 87.0% White (Caucasian)71,389 85.9% Black or African American7,644 85.7% American Indian / Alaska Native215,027 85.8% Asian5,051 86.0% Native Hawaiian / Pacific Islander66,563 82.9% Other race171,771 85.6% Two or more races466,870 82.4% White alone, not Hispanic / Latino377,995 87.9% Hispanic or LatinoMoved within same county 55,979 7.5% White / Caucasian6,722 8.1% Black or African American649 7.3% American Indian / Alaska Native21,526 8.6% Asian426 7.3% Native Hawaiian / Pacific Islander8,436 10.5% Other race16,213 8.1% Two or more races56,580 10.0% White alone, not Hispanic / Latino34,810 8.1% Hispanic or LatinoMoved within same state 14,974 2.0% White / Caucasian1,717 2.1% Black or African American311 3.5% American Indian / Alaska Native4,872 1.9% Asian130 2.2% Native Hawaiian / Pacific Islander1,231 1.5% Other race4,316 2.2% Two or more races11,924 2.1% White alone, not Hispanic / Latino5,980 1.4% Hispanic or LatinoMoved from different state 22,035 3.0% White / Caucasian2,277 2.7% Black or African American98 1.1% American Indian / Alaska Native4,266 1.7% Asian224 3.8% Native Hawaiian / Pacific Islander1,419 1.8% Other race3,816 1.9% Two or more races21,857 3.9% White alone, not Hispanic / Latino5,005 1.2% Hispanic or LatinoMoved from abroad 3,474 0.5% White936 1.1% Black or African American185 2.1% American Indian / Alaska Native4,273 1.7% Asian39 0.7% Native Hawaiian / Pacific Islander1,734 2.2% Other race1,614 0.8% Two or more races5,224 0.9% White alone, not Hispanic / Latino4,512 1.0% Hispanic or Latino
Children Nativity (place of birth) in San Diego
Children under 6 years - Living with two parents Both parents native 37,518 100.0% NativeBoth parents foreign-born 12,881 91.7% Native1,161 8.3% Foreign-bornOne native, one foreign-born parent 14,570 100.0% NativeChildren under 6 years - Living with one parent Native parent 14,616 99.5% Native70 0.5% Foreign-bornForeign-born parent 3,930 93.2% Native285 6.8% Foreign-bornChildren 6 to 17 years - Living with two parents Both parents native 57,677 99.8% Native94 0.2% Foreign-bornBoth parents foreign-born 28,144 75.3% Native9,245 24.7% Foreign-bornOne native, one foreign-born parent 23,292 97.4% Native610 2.6% Foreign-bornChildren 6 to 17 years - Living with one parent Native parent 33,481 100.0% NativeForeign-born parent 19,234 53.1% Native16,970 46.9% Foreign-born
Place of birth for residents in San Diego 164,818 Asia141,430 Americas136,308 Latin America120,973 Central America84,796 South Eastern Asia43,358 Eastern Asia31,954 Europe30,831 South Central Asia26,958 China15,531 Africa15,249 Eastern Europe12,490 South America9,037 Eastern Africa7,218 Western Europe6,330 Northern Europe5,779 Western Asia5,122 Northern America3,091 Southern Europe2,844 Caribbean2,591 Southern Africa2,417 Northern Africa1,870 Oceania1,195 Australia and New Zealand Subregion1,100 Western Africa179 Middle Africa112,943 Mexico48,298 Philippines28,224 Vietnam20,908 China19,890 India9,377 Korea7,558 Iran6,965 Japan5,795 Brazil5,177 Somalia5,122 Canada4,773 Russia4,363 Guatemala3,765 Germany3,174 Taiwan2,960 Laos2,875 Hong Kong2,591 South Africa2,209 United Kingdom2,004 France1,991 Colombia1,849 Ukraine1,779 Argentina1,747 Bulgaria1,744 Thailand1,688 El Salvador1,595 Italy1,580 England1,548 Ethiopia1,435 Haiti1,392 Afghanistan1,333 Cambodia1,264 Indonesia1,184 Turkey1,164 Peru1,032 Egypt967 Romania937 Poland928 Chile915 Pakistan884 Uganda882 Australia846 Iraq750 Saudi Arabia741 Israel729 Spain720 Nicaragua685 Eritrea684 Ireland684 Sweden683 Morocco647 Lebanon639 Belarus594 Honduras574 Panama563 Dominican Republic550 Czechoslovakia533 Kuwait502 Cuba496 Bosnia and Herzegovina468 Lithuania428 Switzerland402 Portugal401 Netherlands395 Ecuador382 Malaysia376 Yemen370 Hungary364 Greece361 Kazakhstan358 Scotland338 Serbia333 Burma325 Zimbabwe315 Nigeria312 New Zealand309 Kenya285 Syria282 Moldova279 Belgium272 Norway266 Sierra Leone258 Venezuela254 Singapore245 Bangladesh179 Jamaica163 Fiji161 Nepal156 Croatia135 Democratic Republic of Congo (Zaire)121 Sri Lanka120 Denmark109 Uzbekistan105 Austria99 Armenia90 Guyana85 Bolivia80 Jordan79 Ghana48 Belize43 Cameroon42 Trinidad and Tobago40 Costa Rica
Grandparents responsible for own grandchildren in San Diego
Grandparents (30 to 59 years) White / Caucasian 1,570 35.8% Responsible for grandchildren2,811 64.2% Not responsible for grandchildrenBlack or African American 331 49.0% Responsible for grandchildren344 51.0% Not responsible for grandchildrenAmerican Indian / Alaska Native 11 20.2% Responsible for grandchildren43 79.8% Not responsible for grandchildrenAsian 127 8.7% Responsible for grandchildren1,337 91.3% Not responsible for grandchildrenNative Hawaiian / Pacific Islander 20 20.2% Responsible for grandchildren78 79.8% Not responsible for grandchildrenOther race 357 20.9% Responsible for grandchildren1,353 79.1% Not responsible for grandchildrenTwo or more races 504 33.1% Responsible for grandchildren1,019 66.9% Not responsible for grandchildrenWhite alone, not Hispanic / Latino 184 19.9% Responsible for grandchildren739 80.1% Not responsible for grandchildrenHispanic or Latino 2,361 32.7% Responsible for grandchildren4,869 67.3% Not responsible for grandchildrenGrandparents (60 years and over) White / Caucasian 1,699 20.1% Responsible for grandchildren6,767 79.9% Not responsible for grandchildrenBlack or African American 443 20.9% Responsible for grandchildren1,676 79.1% Not responsible for grandchildrenAmerican Indian / Alaska Native 21 9.3% Responsible for grandchildren206 90.7% Not responsible for grandchildrenAsian 268 4.9% Responsible for grandchildren5,153 95.1% Not responsible for grandchildrenNative Hawaiian / Pacific Islander 17 38.2% Responsible for grandchildren28 61.8% Not responsible for grandchildrenOther race 1,293 100.0% Not responsible for grandchildrenTwo or more races 260 22.0% Responsible for grandchildren922 78.0% Not responsible for grandchildrenWhite alone, not Hispanic / Latino 866 19.6% Responsible for grandchildren3,559 80.4% Not responsible for grandchildrenHispanic or Latino 1,344 15.6% Responsible for grandchildren7,291 84.4% Not responsible for grandchildren
Zip codes: 92037 , 92101 , 92102 , 92103 , 92104 , 92105 , 92106 , 92107 , 92108 , 92109 , 92110 , 92111 , 92113 , 92114 , 92116 , 92117 , 92119 , 92122 , 92123 , 92124 , 92126 , 92129 , 92132, 92134 , 92140 , 92145 , 92147 , 92173 .