Races in San Angelo, Texas (TX) Detailed Stats
Data:
Races - White alone (%)
Races - White alone (% change since 2000)
Races - Black alone (%)
Races - Black alone (% change since 2000)
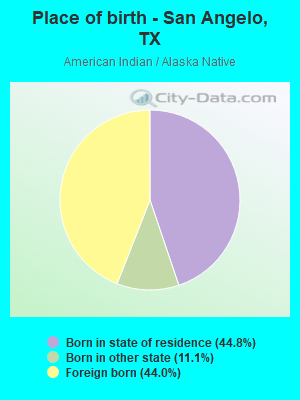
Races - American Indian alone (%)
Races - American Indian alone (% change since 2000)
Races - Asian alone (%)
Races - Asian alone (% change since 2000)
Races - Hispanic (%)
Races - Hispanic (% change since 2000)
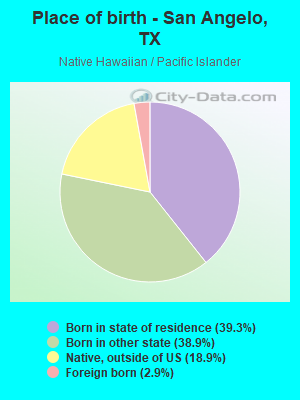
Races - Native Hawaiian and Other Pacific Islander alone (%)
Races - Native Hawaiian and Other Pacific Islander alone (% change since 2000)
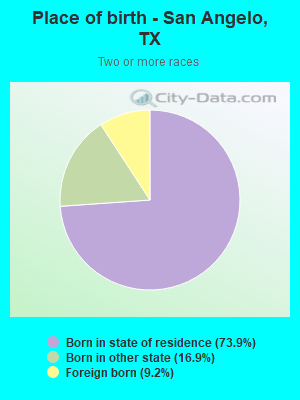
Races - Two or more races(%)
Races - Two or more races(% change since 2000)
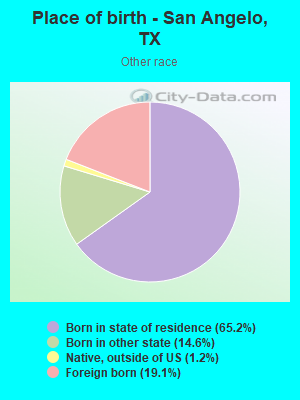
Races - Other race alone (%)
Races - Other race alone (% change since 2000)
Racial diversity
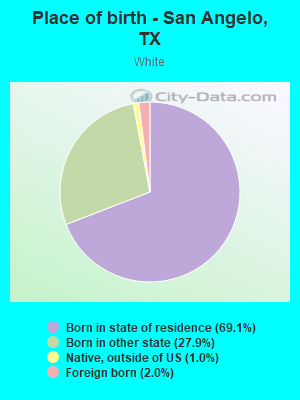
Place of birth - Born in state of residence (%)
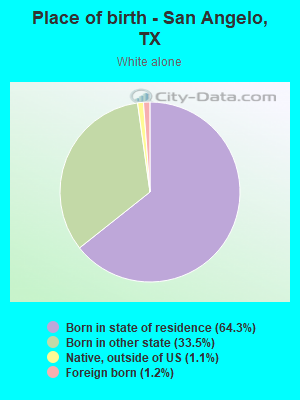
Place of birth - Born in state of residence (%) - White
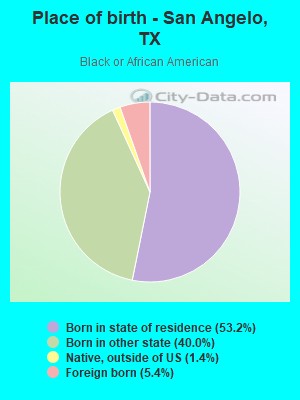
Place of birth - Born in state of residence (%) - Black or African American
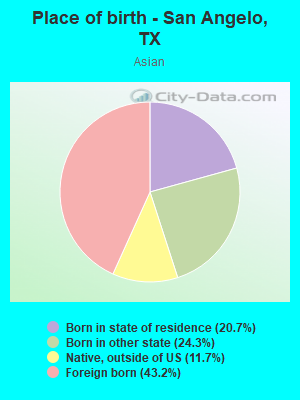
Place of birth - Born in state of residence (%) - Asian
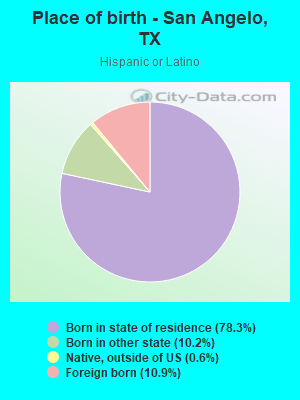
Place of birth - Born in state of residence (%) - Hispanic or Latino
Place of birth - Born in state of residence (%) - American Indian and Alaska Native
Place of birth - Born in state of residence (%) - Multirace
Place of birth - Born in state of residence (%) - Other Race
Place of birth - Born in other state (%)
Place of birth - Born in other state (%) - White
Place of birth - Born in other state (%) - Black or African American
Place of birth - Born in other state (%) - Asian
Place of birth - Born in other state (%) - Hispanic or Latino
Place of birth - Born in other state (%) - American Indian and Alaska Native
Place of birth - Born in other state (%) - Multirace
Place of birth - Born in other state (%) - Other Race
Place of birth - Native, outside of US (%)
Place of birth - Native, outside of US (%) - White
Place of birth - Native, outside of US (%) - Black or African American
Place of birth - Native, outside of US (%) - Asian
Place of birth - Native, outside of US (%) - Hispanic or Latino
Place of birth - Native, outside of US (%) - American Indian and Alaska Native
Place of birth - Native, outside of US (%) - Multirace
Place of birth - Native, outside of US (%) - Other Race
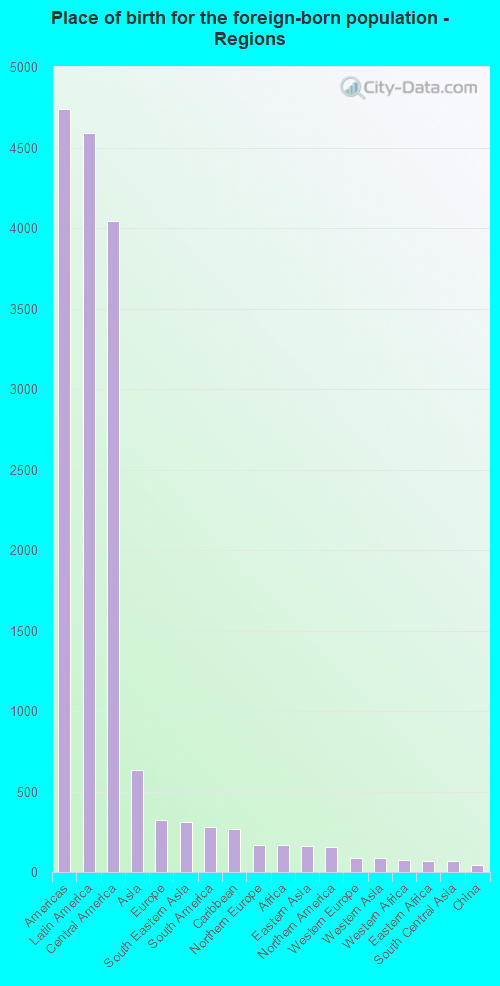
Place of birth - Foreign born (%)
Place of birth - Foreign born (%) - White
Place of birth - Foreign born (%) - Black or African American
Place of birth - Foreign born (%) - Asian
Place of birth - Foreign born (%) - Hispanic or Latino
Place of birth - Foreign born (%) - American Indian and Alaska Native
Place of birth - Foreign born (%) - Multirace
Place of birth - Foreign born (%) - Other Race
Residents speaking English at home (%)
Residents speaking English at home - Born in the United States (%)
Residents speaking English at home - Native, born elsewhere (%)
Residents speaking English at home - Foreign born (%)
Residents speaking Spanish at home (%)
Residents speaking Spanish at home - Born in the United States (%)
Residents speaking Spanish at home - Native, born elsewhere (%)
Residents speaking Spanish at home - Foreign born (%)
Residents speaking other language at home (%)
Residents speaking other language at home - Born in the United States (%)
Residents speaking other language at home - Native, born elsewhere (%)
Residents speaking other language at home - Foreign born (%)
Marital status - Never married (%)
Marital status - Now married (%)
Marital status - Separated (%)
Marital status - Widowed (%)
Marital status - Divorced (%)
Ancestries Reported - Arab (%)
Ancestries Reported - Czech (%)
Ancestries Reported - Danish (%)
Ancestries Reported - Dutch (%)
Ancestries Reported - English (%)
Ancestries Reported - French (%)
Ancestries Reported - French Canadian (%)
Ancestries Reported - German (%)
Ancestries Reported - Greek (%)
Ancestries Reported - Hungarian (%)
Ancestries Reported - Irish (%)
Ancestries Reported - Italian (%)
Ancestries Reported - Lithuanian (%)
Ancestries Reported - Norwegian (%)
Ancestries Reported - Polish (%)
Ancestries Reported - Portuguese (%)
Ancestries Reported - Russian (%)
Ancestries Reported - Scotch-Irish (%)
Ancestries Reported - Scottish (%)
Ancestries Reported - Slovak (%)
Ancestries Reported - Subsaharan African (%)
Ancestries Reported - Swedish (%)
Ancestries Reported - Swiss (%)
Ancestries Reported - Ukrainian (%)
Ancestries Reported - United States (%)
Ancestries Reported - Welsh (%)
Ancestries Reported - West Indian (%)
Ancestries Reported - Other (%)
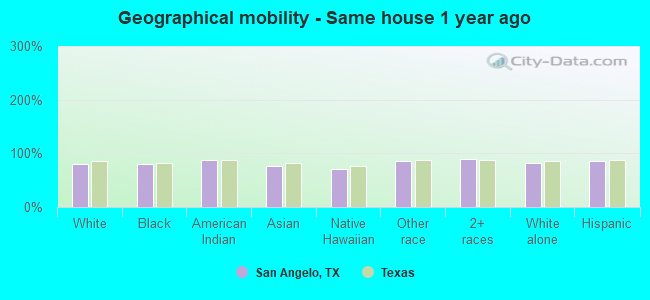
Geographical mobility - Same house 1 year ago (%)
Geographical mobility - Same house 1 year ago (%) - White
Geographical mobility - Same house 1 year ago (%) - Black or African American
Geographical mobility - Same house 1 year ago (%) - Asian
Geographical mobility - Same house 1 year ago (%) - Hispanic or Latino
Geographical mobility - Same house 1 year ago (%) - American Indian and Alaska Native
Geographical mobility - Same house 1 year ago (%) - Multirace
Geographical mobility - Same house 1 year ago (%) - Other Race
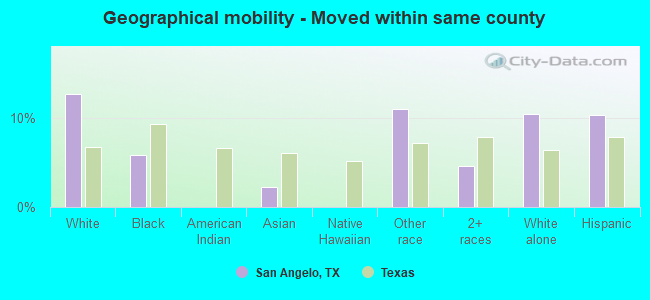
Geographical mobility - Moved within same county (%)
Geographical mobility - Moved within same county (%) - White
Geographical mobility - Moved within same county (%) - Black or African American
Geographical mobility - Moved within same county (%) - Asian
Geographical mobility - Moved within same county (%) - Hispanic or Latino
Geographical mobility - Moved within same county (%) - American Indian and Alaska Native
Geographical mobility - Moved within same county (%) - Multirace
Geographical mobility - Moved within same county (%) - Other Race
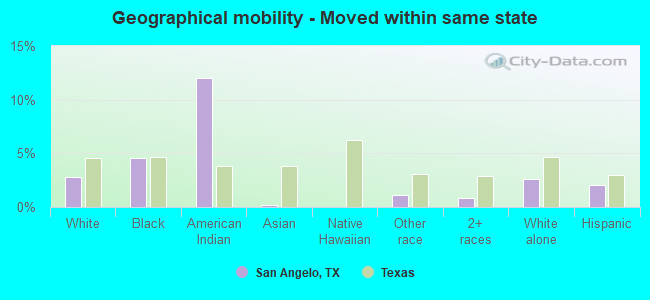
Geographical mobility - Moved from different county within same state (%)
Geographical mobility - Moved from different county within same state (%) - White
Geographical mobility - Moved from different county within same state (%) - Black or African American
Geographical mobility - Moved from different county within same state (%) - Asian
Geographical mobility - Moved from different county within same state (%) - Hispanic or Latino
Geographical mobility - Moved from different county within same state (%) - American Indian and Alaska Native
Geographical mobility - Moved from different county within same state (%) - Multirace
Geographical mobility - Moved from different county within same state (%) - Other Race
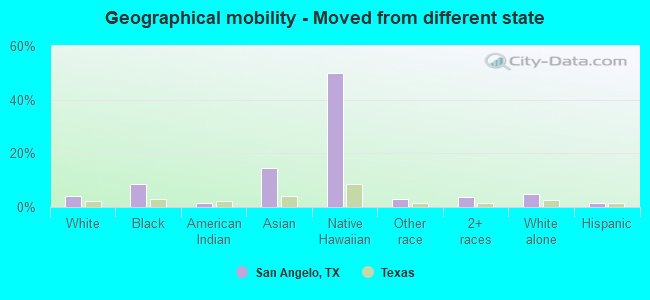
Geographical mobility - Moved from different state (%)
Geographical mobility - Moved from different state (%) - White
Geographical mobility - Moved from different state (%) - Black or African American
Geographical mobility - Moved from different state (%) - Asian
Geographical mobility - Moved from different state (%) - Hispanic or Latino
Geographical mobility - Moved from different state (%) - American Indian and Alaska Native
Geographical mobility - Moved from different state (%) - Multirace
Geographical mobility - Moved from different state (%) - Other Race
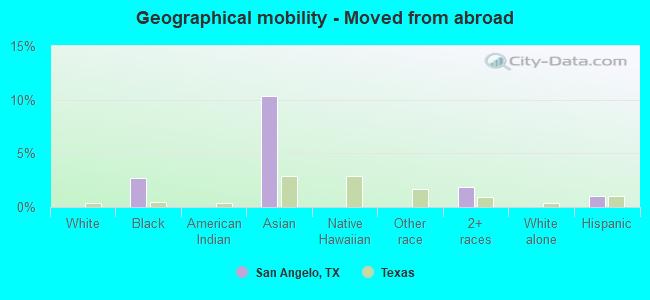
Geographical mobility - Moved from abroad (%)
Geographical mobility - Moved from abroad (%) - White
Geographical mobility - Moved from abroad (%) - Black or African American
Geographical mobility - Moved from abroad (%) - Asian
Geographical mobility - Moved from abroad (%) - Hispanic or Latino
Geographical mobility - Moved from abroad (%) - American Indian and Alaska Native
Geographical mobility - Moved from abroad (%) - Multirace
Geographical mobility - Moved from abroad (%) - Other Race
Place of birth for the foreign-born population - Ireland (%)
Place of birth for the foreign-born population - Denmark (%)
Place of birth for the foreign-born population - Norway (%)
Place of birth for the foreign-born population - Sweden (%)
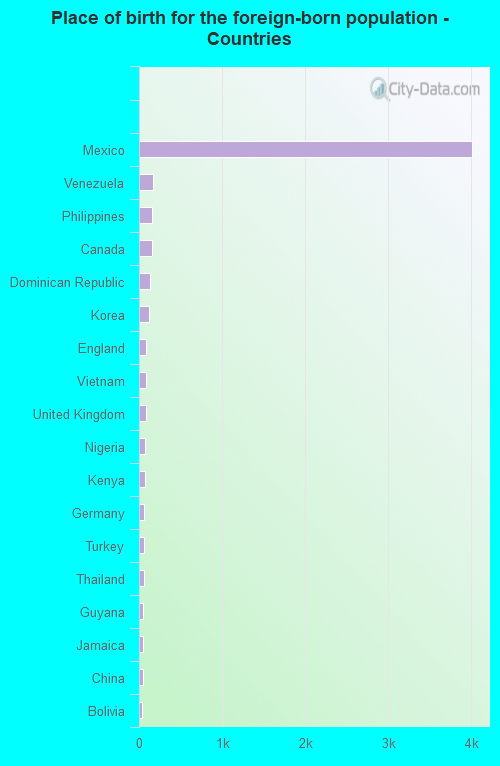
Place of birth for the foreign-born population - United Kingdom (%)
Place of birth for the foreign-born population - England (%)
Place of birth for the foreign-born population - Scotland (%)
Place of birth for the foreign-born population - Other Northern Europe (%)
Place of birth for the foreign-born population - Austria (%)
Place of birth for the foreign-born population - Belgium (%)
Place of birth for the foreign-born population - France (%)
Place of birth for the foreign-born population - Germany (%)
Place of birth for the foreign-born population - Netherlands (%)
Place of birth for the foreign-born population - Switzerland (%)
Place of birth for the foreign-born population - Other Western Europe (%)
Place of birth for the foreign-born population - Greece (%)
Place of birth for the foreign-born population - Italy (%)
Place of birth for the foreign-born population - Portugal (%)
Place of birth for the foreign-born population - Spain (%)
Place of birth for the foreign-born population - Other Southern Europe (%)
Place of birth for the foreign-born population - Albania (%)
Place of birth for the foreign-born population - Belarus (%)
Place of birth for the foreign-born population - Bosnia and Herzegovina (%)
Place of birth for the foreign-born population - Bulgaria (%)
Place of birth for the foreign-born population - Croatia (%)
Place of birth for the foreign-born population - Czechoslovakia (%)
Place of birth for the foreign-born population - Hungary (%)
Place of birth for the foreign-born population - Latvia (%)
Place of birth for the foreign-born population - Lithuania (%)
Place of birth for the foreign-born population - North Macedonia (Macedonia) (%)
Place of birth for the foreign-born population - Moldova (%)
Place of birth for the foreign-born population - Poland (%)
Place of birth for the foreign-born population - Romania (%)
Place of birth for the foreign-born population - Russia (%)
Place of birth for the foreign-born population - Serbia (%)
Place of birth for the foreign-born population - Ukraine (%)
Place of birth for the foreign-born population - Other Eastern Europe (%)
Place of birth for the foreign-born population - China (%)
Place of birth for the foreign-born population - Hong Kong (%)
Place of birth for the foreign-born population - Taiwan (%)
Place of birth for the foreign-born population - Japan (%)
Place of birth for the foreign-born population - Korea (%)
Place of birth for the foreign-born population - Other Eastern Asia (%)
Place of birth for the foreign-born population - Afghanistan (%)
Place of birth for the foreign-born population - Bangladesh (%)
Place of birth for the foreign-born population - India (%)
Place of birth for the foreign-born population - Iran (%)
Place of birth for the foreign-born population - Kazakhstan (%)
Place of birth for the foreign-born population - Nepal (%)
Place of birth for the foreign-born population - Pakistan (%)
Place of birth for the foreign-born population - Sri Lanka (%)
Place of birth for the foreign-born population - Uzbekistan (%)
Place of birth for the foreign-born population - Other South Central Asia (%)
Place of birth for the foreign-born population - Burma (%)
Place of birth for the foreign-born population - Cambodia (%)
Place of birth for the foreign-born population - Indonesia (%)
Place of birth for the foreign-born population - Laos (%)
Place of birth for the foreign-born population - Malaysia (%)
Place of birth for the foreign-born population - Philippines (%)
Place of birth for the foreign-born population - Singapore (%)
Place of birth for the foreign-born population - Thailand (%)
Place of birth for the foreign-born population - Vietnam (%)
Place of birth for the foreign-born population - Other South Eastern Asia (%)
Place of birth for the foreign-born population - Armenia (%)
Place of birth for the foreign-born population - Iraq (%)
Place of birth for the foreign-born population - Israel (%)
Place of birth for the foreign-born population - Jordan (%)
Place of birth for the foreign-born population - Kuwait (%)
Place of birth for the foreign-born population - Lebanon (%)
Place of birth for the foreign-born population - Saudi Arabia (%)
Place of birth for the foreign-born population - Syria (%)
Place of birth for the foreign-born population - Turkey (%)
Place of birth for the foreign-born population - Yemen (%)
Place of birth for the foreign-born population - Other Western Asia (%)
Place of birth for the foreign-born population - Eritrea (%)
Place of birth for the foreign-born population - Ethiopia (%)
Place of birth for the foreign-born population - Kenya (%)
Place of birth for the foreign-born population - Somalia (%)
Place of birth for the foreign-born population - Uganda (%)
Place of birth for the foreign-born population - Zimbabwe (%)
Place of birth for the foreign-born population - Other Eastern Africa (%)
Place of birth for the foreign-born population - Cameroon (%)
Place of birth for the foreign-born population - Congo (%)
Place of birth for the foreign-born population - Democratic Republic of Congo (Zaire) (%)
Place of birth for the foreign-born population - Other Middle Africa (%)
Place of birth for the foreign-born population - Egypt (%)
Place of birth for the foreign-born population - Morocco (%)
Place of birth for the foreign-born population - Sudan (%)
Place of birth for the foreign-born population - Other Northern Africa (%)
Place of birth for the foreign-born population - South Africa (%)
Place of birth for the foreign-born population - Other Southern Africa (%)
Place of birth for the foreign-born population - Cabo Verde (%)
Place of birth for the foreign-born population - Ghana (%)
Place of birth for the foreign-born population - Liberia (%)
Place of birth for the foreign-born population - Nigeria (%)
Place of birth for the foreign-born population - Senegal (%)
Place of birth for the foreign-born population - Sierra Leone (%)
Place of birth for the foreign-born population - Other Western Africa (%)
Place of birth for the foreign-born population - Australia (%)
Place of birth for the foreign-born population - New Zealand (%)
Place of birth for the foreign-born population - Fiji (%)
Place of birth for the foreign-born population - Micronesia (%)
Place of birth for the foreign-born population - Bahamas (%)
Place of birth for the foreign-born population - Barbados (%)
Place of birth for the foreign-born population - Cuba (%)
Place of birth for the foreign-born population - Dominica (%)
Place of birth for the foreign-born population - Dominican Republic (%)
Place of birth for the foreign-born population - Grenada (%)
Place of birth for the foreign-born population - Haiti (%)
Place of birth for the foreign-born population - Jamaica (%)
Place of birth for the foreign-born population - St. Vincent and the Grenadines (%)
Place of birth for the foreign-born population - Trinidad and Tobago (%)
Place of birth for the foreign-born population - West Indies (%)
Place of birth for the foreign-born population - Other Caribbean (%)
Place of birth for the foreign-born population - Belize (%)
Place of birth for the foreign-born population - Costa Rica (%)
Place of birth for the foreign-born population - El Salvador (%)
Place of birth for the foreign-born population - Guatemala (%)
Place of birth for the foreign-born population - Honduras (%)
Place of birth for the foreign-born population - Mexico (%)
Place of birth for the foreign-born population - Nicaragua (%)
Place of birth for the foreign-born population - Panama (%)
Place of birth for the foreign-born population - Other Central America (%)
Place of birth for the foreign-born population - Argentina (%)
Place of birth for the foreign-born population - Bolivia (%)
Place of birth for the foreign-born population - Brazil (%)
Place of birth for the foreign-born population - Chile (%)
Place of birth for the foreign-born population - Colombia (%)
Place of birth for the foreign-born population - Ecuador (%)
Place of birth for the foreign-born population - Guyana (%)
Place of birth for the foreign-born population - Peru (%)
Place of birth for the foreign-born population - Uruguay (%)
Place of birth for the foreign-born population - Venezuela (%)
Place of birth for the foreign-born population - Other South America (%)
Place of birth for the foreign-born population - Canada (%)
Place of birth for the foreign-born population - Other Northern America (%)
Place of birth for the foreign-born population - Other (%)
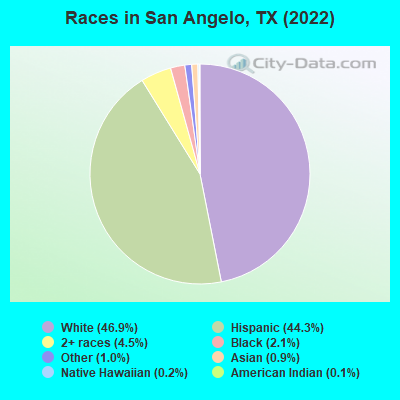
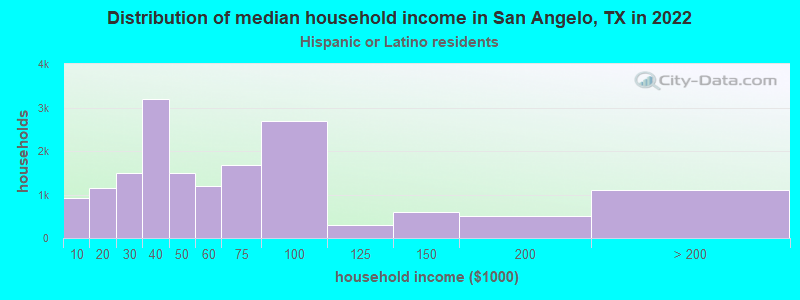
According to 2022 data, the most numerous races in San Angelo, TX are Hispanic (44,244 residents), White alone (46,850 residents), and Black alone (2,062 residents). 73.7% of San Angelo residents speak English at home. 5.9% of San Angelo, TX residents are foreign-born (4.5% born in Latin America, 0.6% born in Asia), which is 186.8% less than the foreign-born rate of 17.0% across the entire state of Texas.
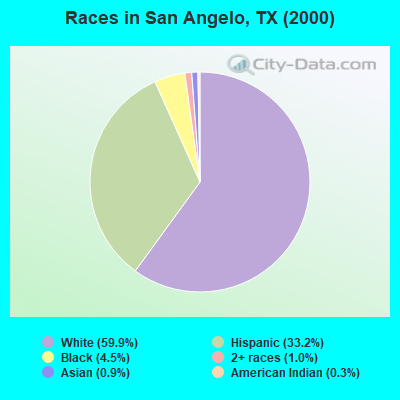
Race distribution in San Angelo
2000 2022
10,933,313 52.4% White alone 6,669,666 32.0% Hispanic 2,364,255 11.3% Black alone 554,445 2.7% Asian alone 230,567 1.1% Two or more races 68,859 0.3% American Indian alone 19,958 0.10% Other race alone 10,757 0.05% Native Hawaiian and Other
12,070,642 40.2% Hispanic 11,683,430 38.9% White alone 3,508,706 11.7% Black alone 1,608,173 5.4% Asian alone 956,560 3.2% Two or more races 125,763 0.4% Other race alone 47,023 0.2% American Indian alone 29,275 0.10% Native Hawaiian and Other
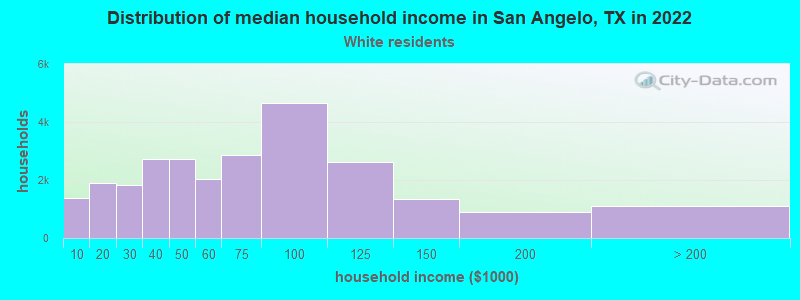
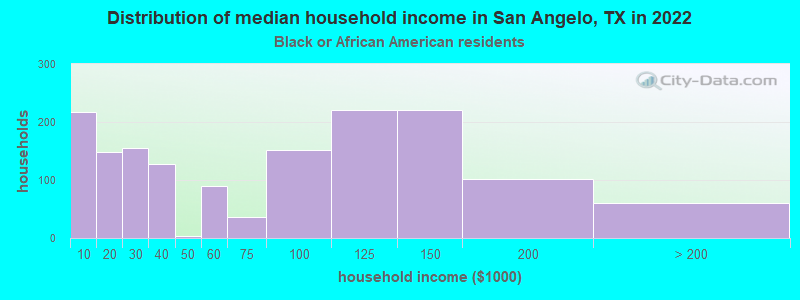
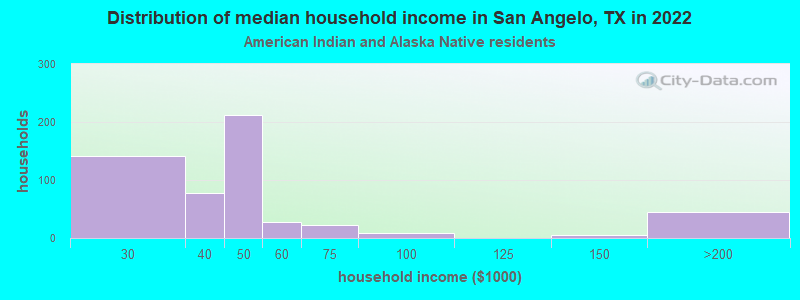
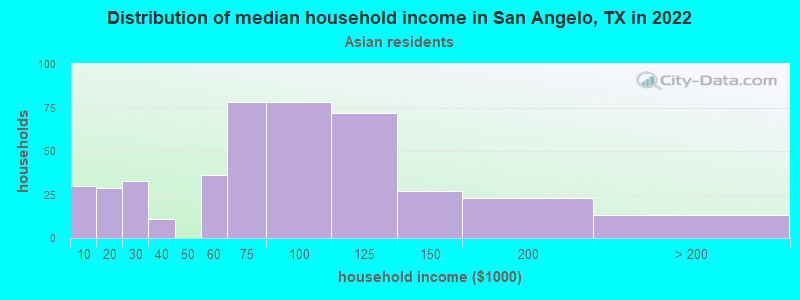
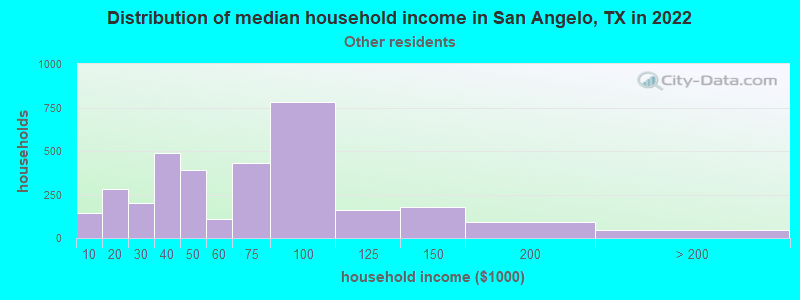
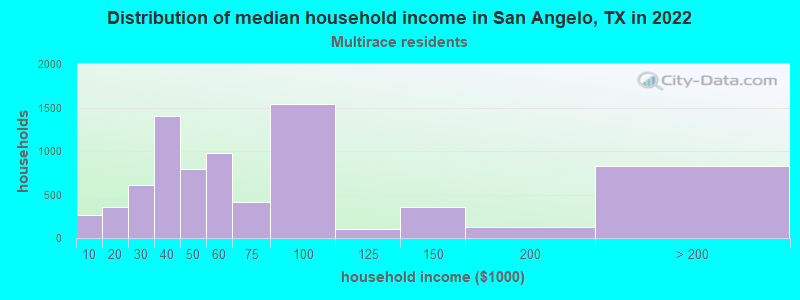
Income and house value in San Angelo Median household income in 2022 $60,785 White non-Hispanic householders$101,840 Black householders$38,313 American Indian and Alaska Native householders$61,816 Asian householders$37,453 Some other race householders$53,621 Two or more races householders$49,424 Hispanic or Latino race householdersMedian 2022 house value $224,464 White Non-Hispanic householders$148,097 Black or African American householders$131,401 American Indian or Alaska Native householders $200,967 Asian householders$123,053 Some other race householders$148,715 Two or more races householders$130,474 Hispanic or Latino householders
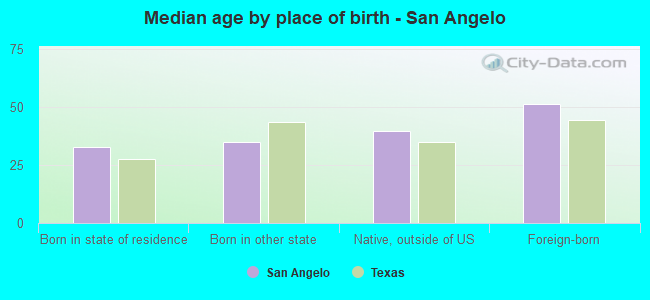
Median age by race in San Angelo
37.3 Median age for White residents33.1 42.3 22.2 Median age for Black or African American residents27.1 22.1 42.3 Median age for American Indian / Alaska Native residents-666,666,666.0 -666,666,666.0 28.8 Median age for Asian residents25.1 32.4 4.1 Median age for Native Hawaiian / Pacific Islander residents-666,666,666.0 4.1 37.6 Median age for Other race residents36.3 39.3 29.8 Median age for Two or more races residents30.6 28.4 40.0 Median age for White alone residents36.0 45.2 32.1 Median age for Hispanic or Latino residents30.8 32.7
Owner/renter occupied households by race in San Angelo
House owners and renters - White residents 16,774 64.4% Owner occupied9,291 35.6% Renter occupiedHouse owners and renters - Black or African American residents 501 38.5% Owner occupied800 61.5% Renter occupiedHouse owners and renters - American Indian / Alaska Native residents 154 31.9% Owner occupied329 68.1% Renter occupiedHouse owners and renters - Asian residents 260 59.6% Owner occupied176 40.4% Renter occupiedHouse owners and renters - Native Hawaiian / Pacific Islander residents 29 100.0% Owner occupiedHouse owners and renters - Other race residents 2,923 61.8% Owner occupied1,809 38.2% Renter occupiedHouse owners and renters - Two or more races residents 4,527 58.2% Owner occupied3,251 41.8% Renter occupiedHouse owners and renters - White alone residents 13,677 64.4% Owner occupied7,561 35.6% Renter occupiedHouse owners and renters - Hispanic or Latino residents 9,797 60.0% Owner occupied6,524 40.0% Renter occupied
Language usage in San Angelo
English speakers - Total 73.7% of residents of San Angelo speak English at home.
24.1% of residents speak Spanish at home 16,490 73.2% Speak English very well6,028 26.8% Speak English less than very well2.2% of residents speak other language at home 1,652 81.0% Speak English very well387 19.0% Speak English less than very well
English speakers - Born in the United States 84.7% of residents of San Angelo speak English at home.
11.0% of residents speak Spanish at home 2,036 81.9% Speak English very well451 18.1% Speak English less than very well4.3% of residents speak other language at home 984 100.0% Speak English very well
English speakers - Native, born elsewhere 62.9% of residents of San Angelo speak English at home.
22.2% of residents speak Spanish at home 193 100.0% Speak English very well14.9% of residents speak other language at home 65 50.0% Speak English very well65 50.0% Speak English less than very well
English speakers - Foreign-born 9.6% of residents of San Angelo speak English at home.
80.0% of residents speak Spanish at home 1,428 29.5% Speak English very well3,416 70.5% Speak English less than very well10.4% of residents speak other language at home 308 48.9% Speak English very well322 51.1% Speak English less than very well
White (Caucasian) - Speak only English Native:
90.0% (49,565)Foreign-born:
35.5% (419)
White (Caucasian) - Speak another language Native:
10.0% (5,481)Foreign-born:
64.5% (760)
Black or African American - Speak only English Native:
97.2% (3,975)Foreign-born:
61.4% (154)
Black or African American - Speak another language Native:
2.9% (117)Foreign-born:
33.9% (85)
American Indian / Alaska Native - Speak another language Native:
30.0% (154)Foreign-born:
98.9% (402)
Asian - Speak only English Native:
49.9% (331)Foreign-born:
29.7% (184)
Asian - Speak another language Native:
50.0% (331)Foreign-born:
71.0% (439)
Other race - Speak another language Native:
62.3% (5,030)Foreign-born:
100.0% (2,155)
Two or more races - Speak only English Native:
58.3% (11,700)Foreign-born:
1.5% (32)
Two or more races - Speak another language Native:
41.7% (8,379)Foreign-born:
98.5% (2,161)
White alone - Speak only English Native:
95.6% (41,101)Foreign-born:
63.6% (381)
White alone - Speak another language Native:
4.5% (1,914)Foreign-born:
34.3% (205)
Hispanic or Latino - Speak another language Native:
47.4% (17,036)Foreign-born:
100.0% (4,844)
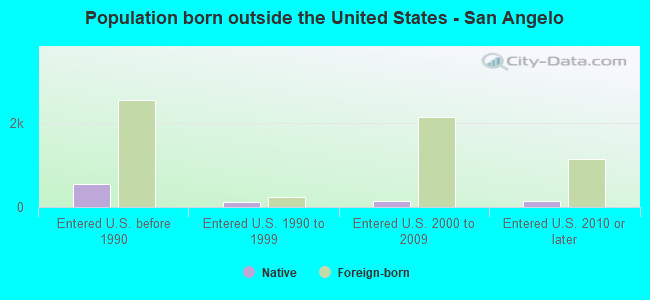
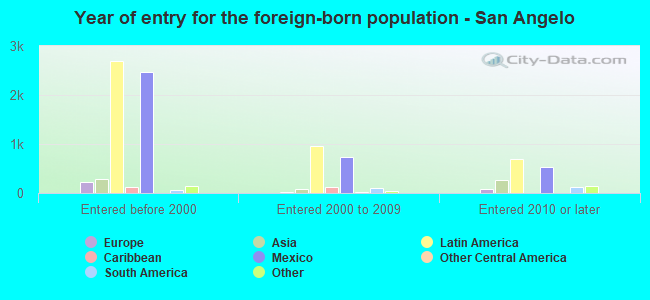
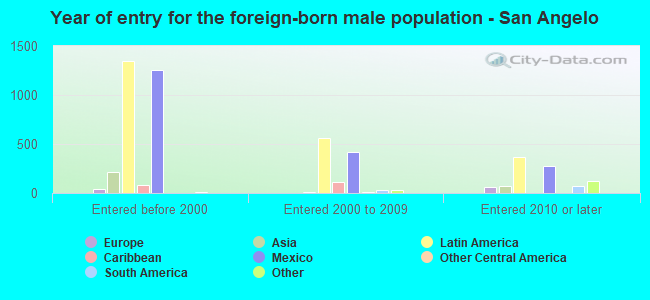
Foreign-born residents in San Angelo 5,875 residents are foreign born (4.5% Latin America , 0.6% Asia ).
This city:
5.9%Texas:
17.1%
Marital status for residents in San Angelo Marital status - White (Caucasian) population 15 years and over
Males 39.0% Never married49.2% Now married0.2% Separated2.3% Widowed9.2% DivorcedFemales 22.7% Never married46.9% Now married3.4% Separated10.2% Widowed16.9% DivorcedWomen who gave birth in the past 12 months Now married:
91.2% (466)Unmarried:
8.8% (45)
Women who did not give birth in the past 12 months Now married:
41.1% (5,187)Unmarried:
58.9% (7,424)
Marital status - Black or African American population 15 years and over
Males 39.3% Never married46.1% Now married1.0% Separated5.8% Widowed7.8% DivorcedFemales 48.5% Never married26.7% Now married7.7% Separated2.1% Widowed14.9% DivorcedWomen who gave birth in the past 12 months Now married:
23.8% (15)Unmarried:
76.2% (49)
Women who did not give birth in the past 12 months Now married:
21.9% (217)Unmarried:
78.1% (775)
Marital status - American Indian / Alaska Native population 15 years and over
Males 59.6% Never married21.1% Now married14.1% Separated0.0% Widowed5.3% DivorcedFemales 15.1% Never married58.1% Now married0.0% Separated2.9% Widowed23.8% DivorcedWomen who gave birth in the past 12 months Now married:
100.0% (16)Unmarried:
0.0% (0)
Women who did not give birth in the past 12 months Now married:
31.1% (40)Unmarried:
68.9% (89)
Marital status - Asian population 15 years and over
Males 61.0% Never married27.7% Now married0.0% Separated11.2% Widowed0.0% DivorcedFemales 52.5% Never married38.8% Now married0.0% Separated0.0% Widowed8.7% DivorcedWomen who gave birth in the past 12 months Now married:
100.0% (42)Unmarried:
0.0% (0)
Women who did not give birth in the past 12 months Now married:
21.9% (88)Unmarried:
78.1% (314)
Marital status - Native Hawaiian / Pacific Islander population 15 years and over
Males 45.5% Never married54.5% Now married0.0% Separated0.0% Widowed0.0% DivorcedFemales 100.0% Never married0.0% Now married0.0% Separated0.0% Widowed0.0% DivorcedWomen who did not give birth in the past 12 months Now married:
0.0% (0)Unmarried:
100.0% (4)
Marital status - Other race population 15 years and over
Males 25.0% Never married51.7% Now married5.0% Separated0.9% Widowed17.4% DivorcedFemales 22.0% Never married55.8% Now married0.0% Separated7.9% Widowed14.3% DivorcedWomen who gave birth in the past 12 months Now married:
100.0% (185)Unmarried:
0.0% (0)
Women who did not give birth in the past 12 months Now married:
31.1% (622)Unmarried:
68.9% (1,379)
Marital status - Two or more races population 15 years and over
Males 31.1% Never married62.3% Now married2.8% Separated0.0% Widowed3.9% DivorcedFemales 29.7% Never married44.4% Now married3.4% Separated3.4% Widowed19.1% DivorcedWomen who gave birth in the past 12 months Now married:
19.6% (44)Unmarried:
80.4% (181)
Women who did not give birth in the past 12 months Now married:
49.9% (3,035)Unmarried:
50.1% (3,043)
Marital status - White alone, not Hispanic / Latino population 15 years and over
Males 34.5% Never married51.5% Now married0.3% Separated2.8% Widowed11.0% DivorcedFemales 20.6% Never married48.6% Now married2.1% Separated10.0% Widowed18.6% DivorcedWomen who gave birth in the past 12 months Now married:
91.2% (466)Unmarried:
8.8% (45)
Women who did not give birth in the past 12 months Now married:
39.0% (3,605)Unmarried:
61.0% (5,634)
Marital status - Hispanic or Latino population 15 years and over
Males 38.2% Never married53.2% Now married2.3% Separated0.3% Widowed6.1% DivorcedFemales 32.3% Never married42.0% Now married4.1% Separated6.1% Widowed15.4% DivorcedWomen who gave birth in the past 12 months Now married:
65.1% (337)Unmarried:
34.9% (181)
Women who did not give birth in the past 12 months Now married:
41.2% (4,521)Unmarried:
58.8% (6,457)
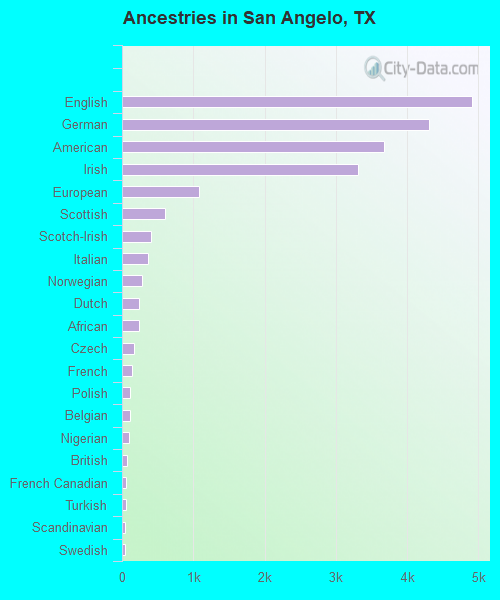
Ancestries in San Angelo
4,903 8.3% English4,302 7.3% German3,677 6.2% American3,311 5.6% Irish1,078 1.8% European598 1.0% Scottish401 0.7% Scotch-Irish364 0.6% Italian279 0.5% Norwegian238 0.4% Dutch236 0.4% African169 0.3% Czech135 0.2% French113 0.2% Polish110 0.2% Belgian92 0.2% Nigerian77 0.1% British63 0.1% French Canadian54 0.09% Turkish47 0.08% Scandinavian45 0.08% Swedish42 0.07% Haitian41 0.07% Swiss40 0.07% Czechoslovakian40 0.07% Jamaican37 0.06% Slavic36 0.06% Kenyan34 0.06% Welsh32 0.05% Portuguese31 0.05% British West Indian30 0.05% Iraqi30 0.05% Russian29 0.05% West Indian25 0.04% Austrian25 0.04% Cajun18 0.03% Finnish12 0.02% Ukrainian12 0.02% Yugoslavian11 0.02% Lebanese10 0.02% Pennsylvania German7 0.01% Brazilian6 0.01% Arab4 0.01% Northern European
Geographical mobility in San Angelo Same house 1 year ago 47,415 80.6% White (Caucasian)3,666 79.7% Black or African American767 87.1% American Indian / Alaska Native992 75.9% Asian84 71.5% Native Hawaiian / Pacific Islander9,172 85.1% Other race21,208 89.1% Two or more races38,070 82.2% White alone, not Hispanic / Latino36,882 85.2% Hispanic or LatinoMoved within same county 7,415 12.6% White / Caucasian266 5.8% Black or African American29 2.2% Asian1,187 11.0% Other race1,103 4.6% Two or more races4,801 10.4% White alone, not Hispanic / Latino4,428 10.2% Hispanic or LatinoMoved within same state 1,662 2.8% White / Caucasian210 4.6% Black or African American106 12.0% American Indian / Alaska Native2 0.2% Asian120 1.1% Other race190 0.8% Two or more races1,215 2.6% White alone, not Hispanic / Latino894 2.1% Hispanic or LatinoMoved from different state 2,353 4.0% White / Caucasian401 8.7% Black or African American13 1.4% American Indian / Alaska Native189 14.5% Asian58 49.8% Native Hawaiian / Pacific Islander302 2.8% Other race855 3.6% Two or more races2,217 4.8% White alone, not Hispanic / Latino611 1.4% Hispanic or LatinoMoved from abroad 123 2.7% Black or African American135 10.3% Asian449 1.9% Two or more races449 1.0% Hispanic or Latino
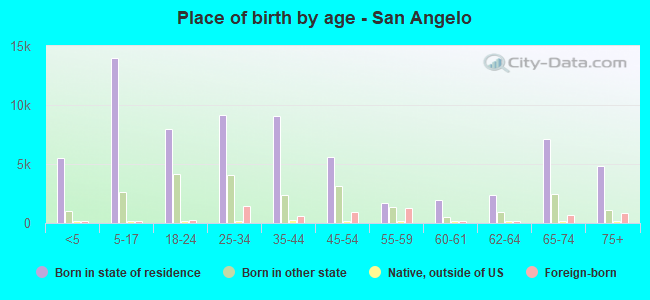
Children Nativity (place of birth) in San Angelo
Children under 6 years - Living with two parents Both parents native 3,826 100.0% NativeBoth parents foreign-born 98 100.0% NativeOne native, one foreign-born parent 374 100.0% NativeChildren under 6 years - Living with one parent Native parent 2,366 100.0% NativeForeign-born parent 146 100.0% NativeChildren 6 to 17 years - Living with two parents Both parents native 8,917 100.0% NativeBoth parents foreign-born 239 93.3% Native17 6.7% Foreign-bornOne native, one foreign-born parent 471 94.5% Native27 5.5% Foreign-bornChildren 6 to 17 years - Living with one parent Native parent 5,104 100.0% NativeForeign-born parent 582 50.5% Native571 49.5% Foreign-born
Grandparents responsible for own grandchildren in San Angelo
Grandparents (30 to 59 years) White / Caucasian 268 45.8% Responsible for grandchildren317 54.2% Not responsible for grandchildrenBlack or African American 62 60.1% Responsible for grandchildren41 39.9% Not responsible for grandchildrenOther race 35 100.0% Not responsible for grandchildrenTwo or more races 214 69.8% Responsible for grandchildren93 30.2% Not responsible for grandchildrenWhite alone, not Hispanic / Latino 286 49.4% Responsible for grandchildren293 50.6% Not responsible for grandchildrenHispanic or Latino 196 41.1% Responsible for grandchildren280 58.9% Not responsible for grandchildrenGrandparents (60 years and over) White / Caucasian 186 46.6% Responsible for grandchildren213 53.4% Not responsible for grandchildrenBlack or African American 7 17.2% Responsible for grandchildren35 82.8% Not responsible for grandchildrenOther race 7 3.4% Responsible for grandchildren196 96.6% Not responsible for grandchildrenTwo or more races 24 22.0% Responsible for grandchildren87 78.0% Not responsible for grandchildrenWhite alone, not Hispanic / Latino 181 49.4% Responsible for grandchildren185 50.6% Not responsible for grandchildrenHispanic or Latino 49 13.3% Responsible for grandchildren320 86.7% Not responsible for grandchildren