Races in Rio Rancho, New Mexico (NM) Detailed Stats
Data:
Races - White alone (%)
Races - White alone (% change since 2000)
Races - Black alone (%)
Races - Black alone (% change since 2000)
Races - American Indian alone (%)
Races - American Indian alone (% change since 2000)
Races - Asian alone (%)
Races - Asian alone (% change since 2000)
Races - Hispanic (%)
Races - Hispanic (% change since 2000)
Races - Native Hawaiian and Other Pacific Islander alone (%)
Races - Native Hawaiian and Other Pacific Islander alone (% change since 2000)
Races - Two or more races(%)
Races - Two or more races(% change since 2000)
Races - Other race alone (%)
Races - Other race alone (% change since 2000)
Racial diversity
Place of birth - Born in state of residence (%)
Place of birth - Born in state of residence (%) - White
Place of birth - Born in state of residence (%) - Black or African American
Place of birth - Born in state of residence (%) - Asian
Place of birth - Born in state of residence (%) - Hispanic or Latino
Place of birth - Born in state of residence (%) - American Indian and Alaska Native
Place of birth - Born in state of residence (%) - Multirace
Place of birth - Born in state of residence (%) - Other Race
Place of birth - Born in other state (%)
Place of birth - Born in other state (%) - White
Place of birth - Born in other state (%) - Black or African American
Place of birth - Born in other state (%) - Asian
Place of birth - Born in other state (%) - Hispanic or Latino
Place of birth - Born in other state (%) - American Indian and Alaska Native
Place of birth - Born in other state (%) - Multirace
Place of birth - Born in other state (%) - Other Race
Place of birth - Native, outside of US (%)
Place of birth - Native, outside of US (%) - White
Place of birth - Native, outside of US (%) - Black or African American
Place of birth - Native, outside of US (%) - Asian
Place of birth - Native, outside of US (%) - Hispanic or Latino
Place of birth - Native, outside of US (%) - American Indian and Alaska Native
Place of birth - Native, outside of US (%) - Multirace
Place of birth - Native, outside of US (%) - Other Race
Place of birth - Foreign born (%)
Place of birth - Foreign born (%) - White
Place of birth - Foreign born (%) - Black or African American
Place of birth - Foreign born (%) - Asian
Place of birth - Foreign born (%) - Hispanic or Latino
Place of birth - Foreign born (%) - American Indian and Alaska Native
Place of birth - Foreign born (%) - Multirace
Place of birth - Foreign born (%) - Other Race
Residents speaking English at home (%)
Residents speaking English at home - Born in the United States (%)
Residents speaking English at home - Native, born elsewhere (%)
Residents speaking English at home - Foreign born (%)
Residents speaking Spanish at home (%)
Residents speaking Spanish at home - Born in the United States (%)
Residents speaking Spanish at home - Native, born elsewhere (%)
Residents speaking Spanish at home - Foreign born (%)
Residents speaking other language at home (%)
Residents speaking other language at home - Born in the United States (%)
Residents speaking other language at home - Native, born elsewhere (%)
Residents speaking other language at home - Foreign born (%)
Marital status - Never married (%)
Marital status - Now married (%)
Marital status - Separated (%)
Marital status - Widowed (%)
Marital status - Divorced (%)
Ancestries Reported - Arab (%)
Ancestries Reported - Czech (%)
Ancestries Reported - Danish (%)
Ancestries Reported - Dutch (%)
Ancestries Reported - English (%)
Ancestries Reported - French (%)
Ancestries Reported - French Canadian (%)
Ancestries Reported - German (%)
Ancestries Reported - Greek (%)
Ancestries Reported - Hungarian (%)
Ancestries Reported - Irish (%)
Ancestries Reported - Italian (%)
Ancestries Reported - Lithuanian (%)
Ancestries Reported - Norwegian (%)
Ancestries Reported - Polish (%)
Ancestries Reported - Portuguese (%)
Ancestries Reported - Russian (%)
Ancestries Reported - Scotch-Irish (%)
Ancestries Reported - Scottish (%)
Ancestries Reported - Slovak (%)
Ancestries Reported - Subsaharan African (%)
Ancestries Reported - Swedish (%)
Ancestries Reported - Swiss (%)
Ancestries Reported - Ukrainian (%)
Ancestries Reported - United States (%)
Ancestries Reported - Welsh (%)
Ancestries Reported - West Indian (%)
Ancestries Reported - Other (%)
Geographical mobility - Same house 1 year ago (%)
Geographical mobility - Same house 1 year ago (%) - White
Geographical mobility - Same house 1 year ago (%) - Black or African American
Geographical mobility - Same house 1 year ago (%) - Asian
Geographical mobility - Same house 1 year ago (%) - Hispanic or Latino
Geographical mobility - Same house 1 year ago (%) - American Indian and Alaska Native
Geographical mobility - Same house 1 year ago (%) - Multirace
Geographical mobility - Same house 1 year ago (%) - Other Race
Geographical mobility - Moved within same county (%)
Geographical mobility - Moved within same county (%) - White
Geographical mobility - Moved within same county (%) - Black or African American
Geographical mobility - Moved within same county (%) - Asian
Geographical mobility - Moved within same county (%) - Hispanic or Latino
Geographical mobility - Moved within same county (%) - American Indian and Alaska Native
Geographical mobility - Moved within same county (%) - Multirace
Geographical mobility - Moved within same county (%) - Other Race
Geographical mobility - Moved from different county within same state (%)
Geographical mobility - Moved from different county within same state (%) - White
Geographical mobility - Moved from different county within same state (%) - Black or African American
Geographical mobility - Moved from different county within same state (%) - Asian
Geographical mobility - Moved from different county within same state (%) - Hispanic or Latino
Geographical mobility - Moved from different county within same state (%) - American Indian and Alaska Native
Geographical mobility - Moved from different county within same state (%) - Multirace
Geographical mobility - Moved from different county within same state (%) - Other Race
Geographical mobility - Moved from different state (%)
Geographical mobility - Moved from different state (%) - White
Geographical mobility - Moved from different state (%) - Black or African American
Geographical mobility - Moved from different state (%) - Asian
Geographical mobility - Moved from different state (%) - Hispanic or Latino
Geographical mobility - Moved from different state (%) - American Indian and Alaska Native
Geographical mobility - Moved from different state (%) - Multirace
Geographical mobility - Moved from different state (%) - Other Race
Geographical mobility - Moved from abroad (%)
Geographical mobility - Moved from abroad (%) - White
Geographical mobility - Moved from abroad (%) - Black or African American
Geographical mobility - Moved from abroad (%) - Asian
Geographical mobility - Moved from abroad (%) - Hispanic or Latino
Geographical mobility - Moved from abroad (%) - American Indian and Alaska Native
Geographical mobility - Moved from abroad (%) - Multirace
Geographical mobility - Moved from abroad (%) - Other Race
Place of birth for the foreign-born population - Ireland (%)
Place of birth for the foreign-born population - Denmark (%)
Place of birth for the foreign-born population - Norway (%)
Place of birth for the foreign-born population - Sweden (%)
Place of birth for the foreign-born population - United Kingdom (%)
Place of birth for the foreign-born population - England (%)
Place of birth for the foreign-born population - Scotland (%)
Place of birth for the foreign-born population - Other Northern Europe (%)
Place of birth for the foreign-born population - Austria (%)
Place of birth for the foreign-born population - Belgium (%)
Place of birth for the foreign-born population - France (%)
Place of birth for the foreign-born population - Germany (%)
Place of birth for the foreign-born population - Netherlands (%)
Place of birth for the foreign-born population - Switzerland (%)
Place of birth for the foreign-born population - Other Western Europe (%)
Place of birth for the foreign-born population - Greece (%)
Place of birth for the foreign-born population - Italy (%)
Place of birth for the foreign-born population - Portugal (%)
Place of birth for the foreign-born population - Spain (%)
Place of birth for the foreign-born population - Other Southern Europe (%)
Place of birth for the foreign-born population - Albania (%)
Place of birth for the foreign-born population - Belarus (%)
Place of birth for the foreign-born population - Bosnia and Herzegovina (%)
Place of birth for the foreign-born population - Bulgaria (%)
Place of birth for the foreign-born population - Croatia (%)
Place of birth for the foreign-born population - Czechoslovakia (%)
Place of birth for the foreign-born population - Hungary (%)
Place of birth for the foreign-born population - Latvia (%)
Place of birth for the foreign-born population - Lithuania (%)
Place of birth for the foreign-born population - North Macedonia (Macedonia) (%)
Place of birth for the foreign-born population - Moldova (%)
Place of birth for the foreign-born population - Poland (%)
Place of birth for the foreign-born population - Romania (%)
Place of birth for the foreign-born population - Russia (%)
Place of birth for the foreign-born population - Serbia (%)
Place of birth for the foreign-born population - Ukraine (%)
Place of birth for the foreign-born population - Other Eastern Europe (%)
Place of birth for the foreign-born population - China (%)
Place of birth for the foreign-born population - Hong Kong (%)
Place of birth for the foreign-born population - Taiwan (%)
Place of birth for the foreign-born population - Japan (%)
Place of birth for the foreign-born population - Korea (%)
Place of birth for the foreign-born population - Other Eastern Asia (%)
Place of birth for the foreign-born population - Afghanistan (%)
Place of birth for the foreign-born population - Bangladesh (%)
Place of birth for the foreign-born population - India (%)
Place of birth for the foreign-born population - Iran (%)
Place of birth for the foreign-born population - Kazakhstan (%)
Place of birth for the foreign-born population - Nepal (%)
Place of birth for the foreign-born population - Pakistan (%)
Place of birth for the foreign-born population - Sri Lanka (%)
Place of birth for the foreign-born population - Uzbekistan (%)
Place of birth for the foreign-born population - Other South Central Asia (%)
Place of birth for the foreign-born population - Burma (%)
Place of birth for the foreign-born population - Cambodia (%)
Place of birth for the foreign-born population - Indonesia (%)
Place of birth for the foreign-born population - Laos (%)
Place of birth for the foreign-born population - Malaysia (%)
Place of birth for the foreign-born population - Philippines (%)
Place of birth for the foreign-born population - Singapore (%)
Place of birth for the foreign-born population - Thailand (%)
Place of birth for the foreign-born population - Vietnam (%)
Place of birth for the foreign-born population - Other South Eastern Asia (%)
Place of birth for the foreign-born population - Armenia (%)
Place of birth for the foreign-born population - Iraq (%)
Place of birth for the foreign-born population - Israel (%)
Place of birth for the foreign-born population - Jordan (%)
Place of birth for the foreign-born population - Kuwait (%)
Place of birth for the foreign-born population - Lebanon (%)
Place of birth for the foreign-born population - Saudi Arabia (%)
Place of birth for the foreign-born population - Syria (%)
Place of birth for the foreign-born population - Turkey (%)
Place of birth for the foreign-born population - Yemen (%)
Place of birth for the foreign-born population - Other Western Asia (%)
Place of birth for the foreign-born population - Eritrea (%)
Place of birth for the foreign-born population - Ethiopia (%)
Place of birth for the foreign-born population - Kenya (%)
Place of birth for the foreign-born population - Somalia (%)
Place of birth for the foreign-born population - Uganda (%)
Place of birth for the foreign-born population - Zimbabwe (%)
Place of birth for the foreign-born population - Other Eastern Africa (%)
Place of birth for the foreign-born population - Cameroon (%)
Place of birth for the foreign-born population - Congo (%)
Place of birth for the foreign-born population - Democratic Republic of Congo (Zaire) (%)
Place of birth for the foreign-born population - Other Middle Africa (%)
Place of birth for the foreign-born population - Egypt (%)
Place of birth for the foreign-born population - Morocco (%)
Place of birth for the foreign-born population - Sudan (%)
Place of birth for the foreign-born population - Other Northern Africa (%)
Place of birth for the foreign-born population - South Africa (%)
Place of birth for the foreign-born population - Other Southern Africa (%)
Place of birth for the foreign-born population - Cabo Verde (%)
Place of birth for the foreign-born population - Ghana (%)
Place of birth for the foreign-born population - Liberia (%)
Place of birth for the foreign-born population - Nigeria (%)
Place of birth for the foreign-born population - Senegal (%)
Place of birth for the foreign-born population - Sierra Leone (%)
Place of birth for the foreign-born population - Other Western Africa (%)
Place of birth for the foreign-born population - Australia (%)
Place of birth for the foreign-born population - New Zealand (%)
Place of birth for the foreign-born population - Fiji (%)
Place of birth for the foreign-born population - Micronesia (%)
Place of birth for the foreign-born population - Bahamas (%)
Place of birth for the foreign-born population - Barbados (%)
Place of birth for the foreign-born population - Cuba (%)
Place of birth for the foreign-born population - Dominica (%)
Place of birth for the foreign-born population - Dominican Republic (%)
Place of birth for the foreign-born population - Grenada (%)
Place of birth for the foreign-born population - Haiti (%)
Place of birth for the foreign-born population - Jamaica (%)
Place of birth for the foreign-born population - St. Vincent and the Grenadines (%)
Place of birth for the foreign-born population - Trinidad and Tobago (%)
Place of birth for the foreign-born population - West Indies (%)
Place of birth for the foreign-born population - Other Caribbean (%)
Place of birth for the foreign-born population - Belize (%)
Place of birth for the foreign-born population - Costa Rica (%)
Place of birth for the foreign-born population - El Salvador (%)
Place of birth for the foreign-born population - Guatemala (%)
Place of birth for the foreign-born population - Honduras (%)
Place of birth for the foreign-born population - Mexico (%)
Place of birth for the foreign-born population - Nicaragua (%)
Place of birth for the foreign-born population - Panama (%)
Place of birth for the foreign-born population - Other Central America (%)
Place of birth for the foreign-born population - Argentina (%)
Place of birth for the foreign-born population - Bolivia (%)
Place of birth for the foreign-born population - Brazil (%)
Place of birth for the foreign-born population - Chile (%)
Place of birth for the foreign-born population - Colombia (%)
Place of birth for the foreign-born population - Ecuador (%)
Place of birth for the foreign-born population - Guyana (%)
Place of birth for the foreign-born population - Peru (%)
Place of birth for the foreign-born population - Uruguay (%)
Place of birth for the foreign-born population - Venezuela (%)
Place of birth for the foreign-born population - Other South America (%)
Place of birth for the foreign-born population - Canada (%)
Place of birth for the foreign-born population - Other Northern America (%)
Place of birth for the foreign-born population - Other (%)
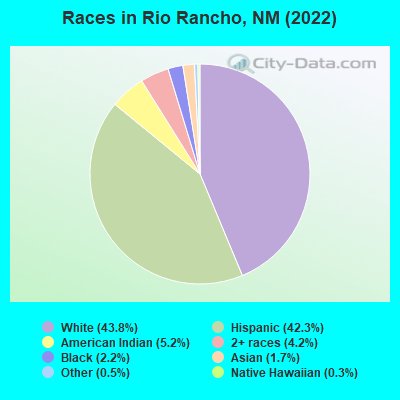
According to 2022 data, the most numerous races in Rio Rancho, NM are Hispanic (45,683 residents), White alone (47,300 residents), and American Indian alone (5,599 residents). 87.6% of Rio Rancho residents speak English at home. 5.4% of Rio Rancho, NM residents are foreign-born (2.8% born in Latin America, 1.3% born in Asia, 0.8% born in Europe), which is 66.2% less than the foreign-born rate of 9.0% across the entire state of New Mexico.
Race distribution in Rio Rancho
2000 2022
33,176 64.1% White alone 14,329 27.7% Hispanic 1,286 2.5% Black alone 1,023 2.0% American Indian alone 1,026 2.0% Two or more races 736 1.4% Asian alone 109 0.2% Other race alone 80 0.2% Native Hawaiian and Other
47,300 43.8% White alone 45,683 42.3% Hispanic 5,599 5.2% American Indian alone 4,494 4.2% Two or more races 2,380 2.2% Black alone 1,790 1.7% Asian alone 540 0.5% Other race alone 286 0.3% Native Hawaiian and Other
2000 2022
813,495 44.7% White alone 765,386 42.1% Hispanic 161,460 8.9% American Indian alone 30,654 1.7% Black alone 25,793 1.4% Two or more races 18,257 1.0% Asian alone 3,009 0.2% Other race alone 992 0.05% Native Hawaiian and Other
1,059,867 50.2% Hispanic 735,478 34.8% White alone 171,808 8.1% American Indian alone 65,084 3.1% Two or more races 36,870 1.7% Black alone 35,870 1.7% Asian alone 7,582 0.4% Other race alone 785 0.04% Native Hawaiian and Other
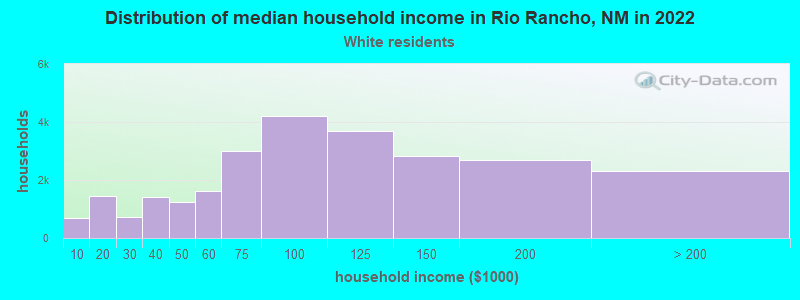
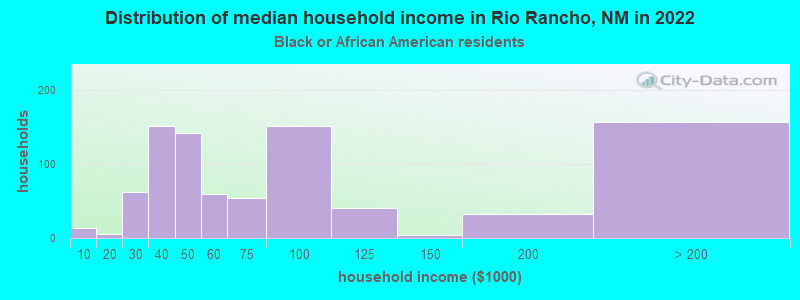
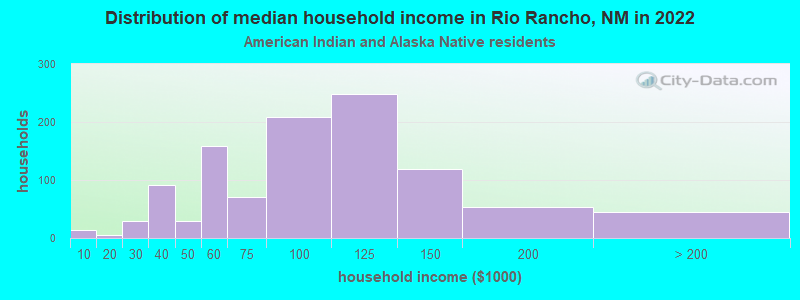
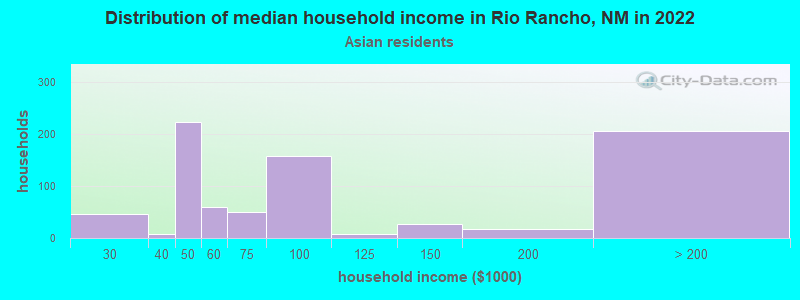
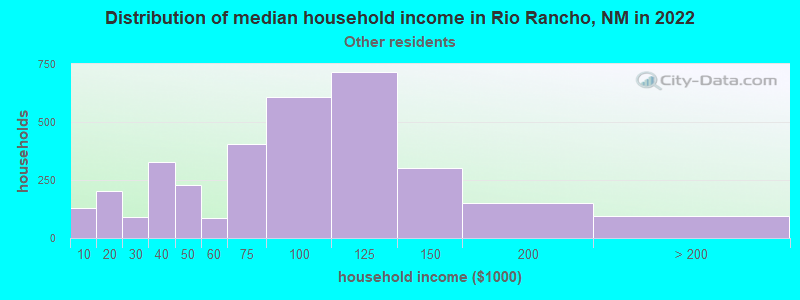
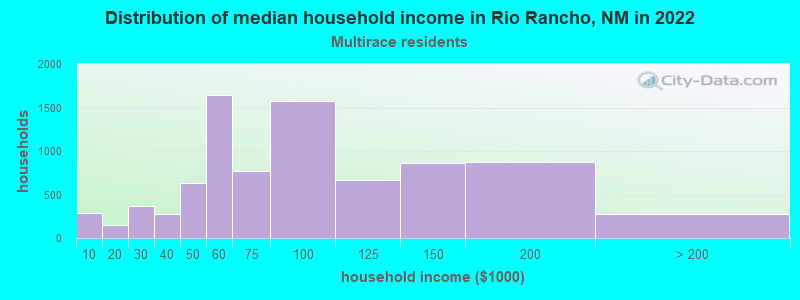
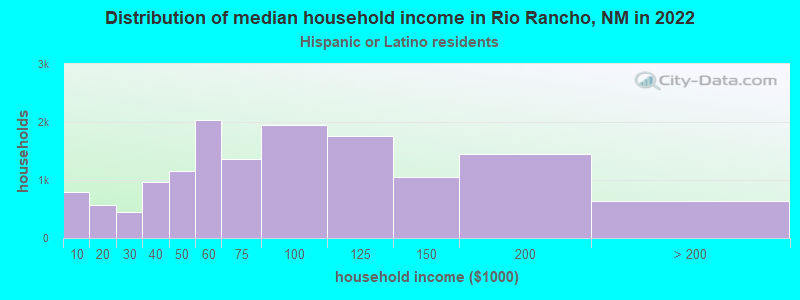
Income and house value in Rio Rancho Median household income in 2022 $96,136 White non-Hispanic householders$85,925 Black householders$86,945 American Indian and Alaska Native householdersover $200,000 Asian householders$53,270 Some other race householders$78,790 Two or more races householders$68,499 Hispanic or Latino race householdersMedian 2022 house value $310,537 White Non-Hispanic householders$312,181 Black or African American householders$266,409 American Indian or Alaska Native householders $387,280 Asian householders$297,655 Some other race householders$337,671 Two or more races householders$304,507 Hispanic or Latino householders
Median age by race in Rio Rancho
41.2 Median age for White residents40.7 42.7 37.9 Median age for Black or African American residents41.2 33.1 28.8 Median age for American Indian / Alaska Native residents28.7 28.8 43.9 Median age for Asian residents32.5 47.2 32.8 Median age for Native Hawaiian / Pacific Islander residents-666,666,666.0 -666,666,666.0 38.2 Median age for Other race residents37.6 40.4 37.0 Median age for Two or more races residents35.8 38.0 48.6 Median age for White alone residents47.7 49.6 31.8 Median age for Hispanic or Latino residents31.3 33.3
Owner/renter occupied households by race in Rio Rancho
House owners and renters - White residents 22,554 87.2% Owner occupied3,320 12.8% Renter occupiedHouse owners and renters - Black or African American residents 641 67.3% Owner occupied311 32.7% Renter occupiedHouse owners and renters - American Indian / Alaska Native residents 1,112 64.2% Owner occupied619 35.8% Renter occupiedHouse owners and renters - Asian residents 718 88.0% Owner occupied98 12.0% Renter occupiedHouse owners and renters - Native Hawaiian / Pacific Islander residents 221 100.0% Owner occupiedHouse owners and renters - Other race residents 1,949 79.1% Owner occupied516 20.9% Renter occupiedHouse owners and renters - Two or more races residents 6,885 82.4% Owner occupied1,472 17.6% Renter occupiedHouse owners and renters - White alone residents 18,229 89.1% Owner occupied2,222 10.9% Renter occupiedHouse owners and renters - Hispanic or Latino residents 11,669 82.4% Owner occupied2,484 17.6% Renter occupied
Language usage in Rio Rancho
English speakers - Total 87.6% of residents of Rio Rancho speak English at home.
10.4% of residents speak Spanish at home 7,648 71.4% Speak English very well3,068 28.6% Speak English less than very well2.0% of residents speak other language at home 1,782 86.8% Speak English very well270 13.2% Speak English less than very well
English speakers - Born in the United States 91.6% of residents of Rio Rancho speak English at home.
6.4% of residents speak Spanish at home 2,279 82.8% Speak English very well474 17.2% Speak English less than very well2.0% of residents speak other language at home 684 77.8% Speak English very well195 22.2% Speak English less than very well
English speakers - Native, born elsewhere 96.2% of residents of Rio Rancho speak English at home.
3.8% of residents speak Spanish at home 89 94.7% Speak English very well5 5.3% Speak English less than very well
English speakers - Foreign-born 44.5% of residents of Rio Rancho speak English at home.
38.3% of residents speak Spanish at home 775 35.0% Speak English very well1,440 65.0% Speak English less than very well17.3% of residents speak other language at home 925 92.5% Speak English very well75 7.5% Speak English less than very well
White (Caucasian) - Speak only English Native:
93.3% (55,561)Foreign-born:
73.0% (908)
White (Caucasian) - Speak another language Native:
6.7% (4,012)Foreign-born:
27.0% (335)
Black or African American - Speak only English Native:
97.3% (2,789)Foreign-born:
56.5% (162)
Black or African American - Speak another language Native:
3.0% (86)Foreign-born:
51.5% (148)
American Indian / Alaska Native - Speak only English Native:
86.6% (2,994)Foreign-born:
3.8% (8)
American Indian / Alaska Native - Speak another language Native:
17.9% (619)Foreign-born:
96.8% (208)
Asian - Speak only English Native:
84.7% (706)Foreign-born:
34.1% (425)
Asian - Speak another language Native:
18.3% (152)Foreign-born:
69.3% (863)
Native Hawaiian / Pacific Islander - Speak another language Native:
15.4% (34)Foreign-born:
100.0% (60)
Other race - Speak only English Native:
76.0% (6,091)Foreign-born:
15.0% (107)
Other race - Speak another language Native:
24.0% (1,923)Foreign-born:
85.0% (607)
Two or more races - Speak only English Native:
84.3% (16,364)Foreign-born:
50.5% (1,341)
Two or more races - Speak another language Native:
15.7% (3,055)Foreign-born:
49.5% (1,317)
White alone - Speak only English Native:
96.7% (43,027)Foreign-born:
76.4% (860)
White alone - Speak another language Native:
3.3% (1,467)Foreign-born:
23.6% (266)
Hispanic or Latino - Speak only English Native:
81.1% (31,762)Foreign-born:
37.7% (1,340)
Hispanic or Latino - Speak another language Native:
18.9% (7,390)Foreign-born:
62.3% (2,215)
Foreign-born residents in Rio Rancho 5,633 residents are foreign born (2.8% Latin America , 1.3% Asia , 0.8% Europe ).
This city:
5.4%New Mexico:
9.2%
Marital status for residents in Rio Rancho Marital status - White (Caucasian) population 15 years and over
Males 29.1% Never married58.8% Now married0.6% Separated2.3% Widowed9.2% DivorcedFemales 21.6% Never married57.0% Now married1.5% Separated7.4% Widowed12.4% DivorcedWomen who gave birth in the past 12 months Now married:
81.7% (443)Unmarried:
18.3% (99)
Women who did not give birth in the past 12 months Now married:
53.7% (6,863)Unmarried:
46.3% (5,919)
Marital status - Black or African American population 15 years and over
Males 40.0% Never married50.8% Now married0.8% Separated1.3% Widowed7.1% DivorcedFemales 23.5% Never married63.6% Now married0.0% Separated8.1% Widowed4.9% DivorcedWomen who gave birth in the past 12 months Now married:
100.0% (48)Unmarried:
0.0% (0)
Women who did not give birth in the past 12 months Now married:
58.4% (338)Unmarried:
41.6% (241)
Marital status - American Indian / Alaska Native population 15 years and over
Males 56.7% Never married38.5% Now married0.0% Separated0.0% Widowed4.8% DivorcedFemales 49.5% Never married37.3% Now married6.8% Separated3.1% Widowed3.3% DivorcedWomen who gave birth in the past 12 months Now married:
100.0% (22)Unmarried:
0.0% (0)
Women who did not give birth in the past 12 months Now married:
31.4% (332)Unmarried:
68.6% (725)
Marital status - Asian population 15 years and over
Males 36.0% Never married50.3% Now married0.0% Separated0.0% Widowed13.7% DivorcedFemales 21.8% Never married52.3% Now married0.0% Separated12.0% Widowed13.9% DivorcedWomen who gave birth in the past 12 months Now married:
100.0% (6)Unmarried:
0.0% (0)
Women who did not give birth in the past 12 months Now married:
45.0% (191)Unmarried:
55.0% (234)
Marital status - Native Hawaiian / Pacific Islander population 15 years and over
Males 29.5% Never married70.5% Now married0.0% Separated0.0% Widowed0.0% DivorcedFemales 10.8% Never married89.2% Now married0.0% Separated0.0% Widowed0.0% DivorcedWomen who gave birth in the past 12 months Now married:
100.0% (38)Unmarried:
0.0% (0)
Women who did not give birth in the past 12 months Now married:
78.4% (61)Unmarried:
21.6% (17)
Marital status - Other race population 15 years and over
Males 47.3% Never married51.4% Now married0.0% Separated0.0% Widowed1.3% DivorcedFemales 39.6% Never married38.5% Now married4.3% Separated7.0% Widowed10.6% DivorcedWomen who gave birth in the past 12 months Now married:
90.2% (193)Unmarried:
9.8% (21)
Women who did not give birth in the past 12 months Now married:
36.2% (1,272)Unmarried:
63.8% (2,237)
Marital status - Two or more races population 15 years and over
Males 33.0% Never married55.0% Now married1.5% Separated2.8% Widowed7.8% DivorcedFemales 28.8% Never married49.2% Now married0.0% Separated5.6% Widowed16.4% DivorcedWomen who gave birth in the past 12 months Now married:
73.4% (244)Unmarried:
26.6% (89)
Women who did not give birth in the past 12 months Now married:
36.2% (1,769)Unmarried:
63.8% (3,116)
Marital status - White alone, not Hispanic / Latino population 15 years and over
Males 25.0% Never married60.4% Now married0.8% Separated2.9% Widowed10.7% DivorcedFemales 17.0% Never married60.0% Now married0.6% Separated8.7% Widowed13.7% DivorcedWomen who gave birth in the past 12 months Now married:
77.5% (341)Unmarried:
22.5% (99)
Women who did not give birth in the past 12 months Now married:
57.9% (5,134)Unmarried:
42.1% (3,735)
Marital status - Hispanic or Latino population 15 years and over
Males 39.1% Never married53.2% Now married0.8% Separated1.6% Widowed5.3% DivorcedFemales 37.8% Never married42.3% Now married2.7% Separated5.4% Widowed11.7% DivorcedWomen who gave birth in the past 12 months Now married:
52.0% (216)Unmarried:
48.0% (199)
Women who did not give birth in the past 12 months Now married:
40.1% (4,612)Unmarried:
59.9% (6,892)
Ancestries in Rio Rancho
3,551 6.6% English3,239 6.0% German2,978 5.5% American2,106 3.9% Irish1,965 3.6% European1,735 3.2% Italian677 1.3% Scottish668 1.2% Polish488 0.9% Scotch-Irish447 0.8% French Canadian412 0.8% Dutch284 0.5% Norwegian278 0.5% Canadian259 0.5% Danish254 0.5% Nigerian212 0.4% French205 0.4% Swedish161 0.3% British122 0.2% Portuguese117 0.2% Ukrainian103 0.2% African100 0.2% Eastern European97 0.2% Scandinavian93 0.2% Greek90 0.2% Finnish81 0.2% Afghan78 0.1% Welsh72 0.1% Northern European60 0.1% Russian51 0.09% Sierra Leonean41 0.08% Turkish40 0.07% Haitian36 0.07% Slavic35 0.06% Trinidadian and Tobagonian32 0.06% Lebanese31 0.06% Hungarian28 0.05% Iranian23 0.04% Swiss21 0.04% Jamaican20 0.04% Celtic18 0.03% Lithuanian17 0.03% Czechoslovakian17 0.03% Yugoslavian14 0.03% Slovene11 0.02% Pennsylvania German9 0.02% Bulgarian8 0.01% Romanian7 0.01% Moroccan7 0.01% Alsatian7 0.01% Czech7 0.01% Austrian
Geographical mobility in Rio Rancho Same house 1 year ago 56,487 89.9% White (Caucasian)2,967 90.9% Black or African American3,012 84.1% American Indian / Alaska Native1,657 76.4% Asian332 100.0% Native Hawaiian / Pacific Islander8,918 85.2% Other race21,299 90.7% Two or more races43,055 91.6% White alone, not Hispanic / Latino39,631 87.9% Hispanic or LatinoMoved within same county 2,457 3.9% White / Caucasian74 2.3% Black or African American286 8.0% American Indian / Alaska Native150 6.9% Asian1 0.3% Native Hawaiian / Pacific Islander366 3.5% Other race716 3.0% Two or more races630 1.3% White alone, not Hispanic / Latino2,673 5.9% Hispanic or LatinoMoved within same state 1,166 1.9% White / Caucasian33 1.0% Black or African American167 4.7% American Indian / Alaska Native47 2.2% Asian330 3.2% Other race1,026 4.4% Two or more races728 1.5% White alone, not Hispanic / Latino2,405 5.3% Hispanic or LatinoMoved from different state 2,598 4.1% White / Caucasian152 4.6% Black or African American86 2.4% American Indian / Alaska Native226 10.4% Asian221 2.1% Other race443 1.9% Two or more races2,483 5.3% White alone, not Hispanic / Latino301 0.7% Hispanic or LatinoMoved from abroad 130 0.2% White72 2.2% Black or African American52 2.4% Asian18 0.2% Other race130 0.3% White alone, not Hispanic / Latino69 0.2% Hispanic or Latino
Children Nativity (place of birth) in Rio Rancho
Children under 6 years - Living with two parents Both parents native 3,476 99.9% Native2 0.1% Foreign-bornBoth parents foreign-born 63 92.0% Native5 8.0% Foreign-bornOne native, one foreign-born parent 632 100.0% NativeChildren under 6 years - Living with one parent Native parent 1,672 100.0% NativeForeign-born parent 15 100.0% NativeChildren 6 to 17 years - Living with two parents Both parents native 10,259 98.7% Native135 1.3% Foreign-bornBoth parents foreign-born 447 92.1% Native39 7.9% Foreign-bornOne native, one foreign-born parent 1,134 100.0% NativeChildren 6 to 17 years - Living with one parent Native parent 4,630 100.0% NativeForeign-born parent 308 54.7% Native255 45.3% Foreign-born
Grandparents responsible for own grandchildren in Rio Rancho
Grandparents (30 to 59 years) White / Caucasian 36 25.2% Responsible for grandchildren105 74.8% Not responsible for grandchildrenAmerican Indian / Alaska Native 12 100.0% Responsible for grandchildrenOther race 57 100.0% Not responsible for grandchildrenTwo or more races 65 73.1% Responsible for grandchildren24 26.9% Not responsible for grandchildrenWhite alone, not Hispanic / Latino 35 33.1% Responsible for grandchildren70 66.9% Not responsible for grandchildrenHispanic or Latino 45 27.0% Responsible for grandchildren122 73.0% Not responsible for grandchildrenGrandparents (60 years and over) White / Caucasian 376 39.0% Responsible for grandchildren587 61.0% Not responsible for grandchildrenAmerican Indian / Alaska Native 32 60.3% Responsible for grandchildren21 39.7% Not responsible for grandchildrenOther race 9 28.0% Responsible for grandchildren23 72.0% Not responsible for grandchildrenTwo or more races 142 53.4% Responsible for grandchildren124 46.6% Not responsible for grandchildrenWhite alone, not Hispanic / Latino 311 31.6% Responsible for grandchildren673 68.4% Not responsible for grandchildrenHispanic or Latino 201 50.0% Responsible for grandchildren201 50.0% Not responsible for grandchildren