Races in Rio Pinar, Florida (FL) Detailed Stats
Data:
Races - White alone (%)
Races - White alone (% change since 2000)
Races - Black alone (%)
Races - Black alone (% change since 2000)
Races - American Indian alone (%)
Races - American Indian alone (% change since 2000)
Races - Asian alone (%)
Races - Asian alone (% change since 2000)
Races - Hispanic (%)
Races - Hispanic (% change since 2000)
Races - Native Hawaiian and Other Pacific Islander alone (%)
Races - Native Hawaiian and Other Pacific Islander alone (% change since 2000)
Races - Two or more races(%)
Races - Two or more races(% change since 2000)
Races - Other race alone (%)
Races - Other race alone (% change since 2000)
Racial diversity
Place of birth - Born in state of residence (%)
Place of birth - Born in state of residence (%) - White
Place of birth - Born in state of residence (%) - Black or African American
Place of birth - Born in state of residence (%) - Asian
Place of birth - Born in state of residence (%) - Hispanic or Latino
Place of birth - Born in state of residence (%) - American Indian and Alaska Native
Place of birth - Born in state of residence (%) - Multirace
Place of birth - Born in state of residence (%) - Other Race
Place of birth - Born in other state (%)
Place of birth - Born in other state (%) - White
Place of birth - Born in other state (%) - Black or African American
Place of birth - Born in other state (%) - Asian
Place of birth - Born in other state (%) - Hispanic or Latino
Place of birth - Born in other state (%) - American Indian and Alaska Native
Place of birth - Born in other state (%) - Multirace
Place of birth - Born in other state (%) - Other Race
Place of birth - Native, outside of US (%)
Place of birth - Native, outside of US (%) - White
Place of birth - Native, outside of US (%) - Black or African American
Place of birth - Native, outside of US (%) - Asian
Place of birth - Native, outside of US (%) - Hispanic or Latino
Place of birth - Native, outside of US (%) - American Indian and Alaska Native
Place of birth - Native, outside of US (%) - Multirace
Place of birth - Native, outside of US (%) - Other Race
Place of birth - Foreign born (%)
Place of birth - Foreign born (%) - White
Place of birth - Foreign born (%) - Black or African American
Place of birth - Foreign born (%) - Asian
Place of birth - Foreign born (%) - Hispanic or Latino
Place of birth - Foreign born (%) - American Indian and Alaska Native
Place of birth - Foreign born (%) - Multirace
Place of birth - Foreign born (%) - Other Race
Residents speaking English at home (%)
Residents speaking English at home - Born in the United States (%)
Residents speaking English at home - Native, born elsewhere (%)
Residents speaking English at home - Foreign born (%)
Residents speaking Spanish at home (%)
Residents speaking Spanish at home - Born in the United States (%)
Residents speaking Spanish at home - Native, born elsewhere (%)
Residents speaking Spanish at home - Foreign born (%)
Residents speaking other language at home (%)
Residents speaking other language at home - Born in the United States (%)
Residents speaking other language at home - Native, born elsewhere (%)
Residents speaking other language at home - Foreign born (%)
Marital status - Never married (%)
Marital status - Now married (%)
Marital status - Separated (%)
Marital status - Widowed (%)
Marital status - Divorced (%)
Ancestries Reported - Arab (%)
Ancestries Reported - Czech (%)
Ancestries Reported - Danish (%)
Ancestries Reported - Dutch (%)
Ancestries Reported - English (%)
Ancestries Reported - French (%)
Ancestries Reported - French Canadian (%)
Ancestries Reported - German (%)
Ancestries Reported - Greek (%)
Ancestries Reported - Hungarian (%)
Ancestries Reported - Irish (%)
Ancestries Reported - Italian (%)
Ancestries Reported - Lithuanian (%)
Ancestries Reported - Norwegian (%)
Ancestries Reported - Polish (%)
Ancestries Reported - Portuguese (%)
Ancestries Reported - Russian (%)
Ancestries Reported - Scotch-Irish (%)
Ancestries Reported - Scottish (%)
Ancestries Reported - Slovak (%)
Ancestries Reported - Subsaharan African (%)
Ancestries Reported - Swedish (%)
Ancestries Reported - Swiss (%)
Ancestries Reported - Ukrainian (%)
Ancestries Reported - United States (%)
Ancestries Reported - Welsh (%)
Ancestries Reported - West Indian (%)
Ancestries Reported - Other (%)
Geographical mobility - Same house 1 year ago (%)
Geographical mobility - Same house 1 year ago (%) - White
Geographical mobility - Same house 1 year ago (%) - Black or African American
Geographical mobility - Same house 1 year ago (%) - Asian
Geographical mobility - Same house 1 year ago (%) - Hispanic or Latino
Geographical mobility - Same house 1 year ago (%) - American Indian and Alaska Native
Geographical mobility - Same house 1 year ago (%) - Multirace
Geographical mobility - Same house 1 year ago (%) - Other Race
Geographical mobility - Moved within same county (%)
Geographical mobility - Moved within same county (%) - White
Geographical mobility - Moved within same county (%) - Black or African American
Geographical mobility - Moved within same county (%) - Asian
Geographical mobility - Moved within same county (%) - Hispanic or Latino
Geographical mobility - Moved within same county (%) - American Indian and Alaska Native
Geographical mobility - Moved within same county (%) - Multirace
Geographical mobility - Moved within same county (%) - Other Race
Geographical mobility - Moved from different county within same state (%)
Geographical mobility - Moved from different county within same state (%) - White
Geographical mobility - Moved from different county within same state (%) - Black or African American
Geographical mobility - Moved from different county within same state (%) - Asian
Geographical mobility - Moved from different county within same state (%) - Hispanic or Latino
Geographical mobility - Moved from different county within same state (%) - American Indian and Alaska Native
Geographical mobility - Moved from different county within same state (%) - Multirace
Geographical mobility - Moved from different county within same state (%) - Other Race
Geographical mobility - Moved from different state (%)
Geographical mobility - Moved from different state (%) - White
Geographical mobility - Moved from different state (%) - Black or African American
Geographical mobility - Moved from different state (%) - Asian
Geographical mobility - Moved from different state (%) - Hispanic or Latino
Geographical mobility - Moved from different state (%) - American Indian and Alaska Native
Geographical mobility - Moved from different state (%) - Multirace
Geographical mobility - Moved from different state (%) - Other Race
Geographical mobility - Moved from abroad (%)
Geographical mobility - Moved from abroad (%) - White
Geographical mobility - Moved from abroad (%) - Black or African American
Geographical mobility - Moved from abroad (%) - Asian
Geographical mobility - Moved from abroad (%) - Hispanic or Latino
Geographical mobility - Moved from abroad (%) - American Indian and Alaska Native
Geographical mobility - Moved from abroad (%) - Multirace
Geographical mobility - Moved from abroad (%) - Other Race
Place of birth for the foreign-born population - Ireland (%)
Place of birth for the foreign-born population - Denmark (%)
Place of birth for the foreign-born population - Norway (%)
Place of birth for the foreign-born population - Sweden (%)
Place of birth for the foreign-born population - United Kingdom (%)
Place of birth for the foreign-born population - England (%)
Place of birth for the foreign-born population - Scotland (%)
Place of birth for the foreign-born population - Other Northern Europe (%)
Place of birth for the foreign-born population - Austria (%)
Place of birth for the foreign-born population - Belgium (%)
Place of birth for the foreign-born population - France (%)
Place of birth for the foreign-born population - Germany (%)
Place of birth for the foreign-born population - Netherlands (%)
Place of birth for the foreign-born population - Switzerland (%)
Place of birth for the foreign-born population - Other Western Europe (%)
Place of birth for the foreign-born population - Greece (%)
Place of birth for the foreign-born population - Italy (%)
Place of birth for the foreign-born population - Portugal (%)
Place of birth for the foreign-born population - Spain (%)
Place of birth for the foreign-born population - Other Southern Europe (%)
Place of birth for the foreign-born population - Albania (%)
Place of birth for the foreign-born population - Belarus (%)
Place of birth for the foreign-born population - Bosnia and Herzegovina (%)
Place of birth for the foreign-born population - Bulgaria (%)
Place of birth for the foreign-born population - Croatia (%)
Place of birth for the foreign-born population - Czechoslovakia (%)
Place of birth for the foreign-born population - Hungary (%)
Place of birth for the foreign-born population - Latvia (%)
Place of birth for the foreign-born population - Lithuania (%)
Place of birth for the foreign-born population - North Macedonia (Macedonia) (%)
Place of birth for the foreign-born population - Moldova (%)
Place of birth for the foreign-born population - Poland (%)
Place of birth for the foreign-born population - Romania (%)
Place of birth for the foreign-born population - Russia (%)
Place of birth for the foreign-born population - Serbia (%)
Place of birth for the foreign-born population - Ukraine (%)
Place of birth for the foreign-born population - Other Eastern Europe (%)
Place of birth for the foreign-born population - China (%)
Place of birth for the foreign-born population - Hong Kong (%)
Place of birth for the foreign-born population - Taiwan (%)
Place of birth for the foreign-born population - Japan (%)
Place of birth for the foreign-born population - Korea (%)
Place of birth for the foreign-born population - Other Eastern Asia (%)
Place of birth for the foreign-born population - Afghanistan (%)
Place of birth for the foreign-born population - Bangladesh (%)
Place of birth for the foreign-born population - India (%)
Place of birth for the foreign-born population - Iran (%)
Place of birth for the foreign-born population - Kazakhstan (%)
Place of birth for the foreign-born population - Nepal (%)
Place of birth for the foreign-born population - Pakistan (%)
Place of birth for the foreign-born population - Sri Lanka (%)
Place of birth for the foreign-born population - Uzbekistan (%)
Place of birth for the foreign-born population - Other South Central Asia (%)
Place of birth for the foreign-born population - Burma (%)
Place of birth for the foreign-born population - Cambodia (%)
Place of birth for the foreign-born population - Indonesia (%)
Place of birth for the foreign-born population - Laos (%)
Place of birth for the foreign-born population - Malaysia (%)
Place of birth for the foreign-born population - Philippines (%)
Place of birth for the foreign-born population - Singapore (%)
Place of birth for the foreign-born population - Thailand (%)
Place of birth for the foreign-born population - Vietnam (%)
Place of birth for the foreign-born population - Other South Eastern Asia (%)
Place of birth for the foreign-born population - Armenia (%)
Place of birth for the foreign-born population - Iraq (%)
Place of birth for the foreign-born population - Israel (%)
Place of birth for the foreign-born population - Jordan (%)
Place of birth for the foreign-born population - Kuwait (%)
Place of birth for the foreign-born population - Lebanon (%)
Place of birth for the foreign-born population - Saudi Arabia (%)
Place of birth for the foreign-born population - Syria (%)
Place of birth for the foreign-born population - Turkey (%)
Place of birth for the foreign-born population - Yemen (%)
Place of birth for the foreign-born population - Other Western Asia (%)
Place of birth for the foreign-born population - Eritrea (%)
Place of birth for the foreign-born population - Ethiopia (%)
Place of birth for the foreign-born population - Kenya (%)
Place of birth for the foreign-born population - Somalia (%)
Place of birth for the foreign-born population - Uganda (%)
Place of birth for the foreign-born population - Zimbabwe (%)
Place of birth for the foreign-born population - Other Eastern Africa (%)
Place of birth for the foreign-born population - Cameroon (%)
Place of birth for the foreign-born population - Congo (%)
Place of birth for the foreign-born population - Democratic Republic of Congo (Zaire) (%)
Place of birth for the foreign-born population - Other Middle Africa (%)
Place of birth for the foreign-born population - Egypt (%)
Place of birth for the foreign-born population - Morocco (%)
Place of birth for the foreign-born population - Sudan (%)
Place of birth for the foreign-born population - Other Northern Africa (%)
Place of birth for the foreign-born population - South Africa (%)
Place of birth for the foreign-born population - Other Southern Africa (%)
Place of birth for the foreign-born population - Cabo Verde (%)
Place of birth for the foreign-born population - Ghana (%)
Place of birth for the foreign-born population - Liberia (%)
Place of birth for the foreign-born population - Nigeria (%)
Place of birth for the foreign-born population - Senegal (%)
Place of birth for the foreign-born population - Sierra Leone (%)
Place of birth for the foreign-born population - Other Western Africa (%)
Place of birth for the foreign-born population - Australia (%)
Place of birth for the foreign-born population - New Zealand (%)
Place of birth for the foreign-born population - Fiji (%)
Place of birth for the foreign-born population - Micronesia (%)
Place of birth for the foreign-born population - Bahamas (%)
Place of birth for the foreign-born population - Barbados (%)
Place of birth for the foreign-born population - Cuba (%)
Place of birth for the foreign-born population - Dominica (%)
Place of birth for the foreign-born population - Dominican Republic (%)
Place of birth for the foreign-born population - Grenada (%)
Place of birth for the foreign-born population - Haiti (%)
Place of birth for the foreign-born population - Jamaica (%)
Place of birth for the foreign-born population - St. Vincent and the Grenadines (%)
Place of birth for the foreign-born population - Trinidad and Tobago (%)
Place of birth for the foreign-born population - West Indies (%)
Place of birth for the foreign-born population - Other Caribbean (%)
Place of birth for the foreign-born population - Belize (%)
Place of birth for the foreign-born population - Costa Rica (%)
Place of birth for the foreign-born population - El Salvador (%)
Place of birth for the foreign-born population - Guatemala (%)
Place of birth for the foreign-born population - Honduras (%)
Place of birth for the foreign-born population - Mexico (%)
Place of birth for the foreign-born population - Nicaragua (%)
Place of birth for the foreign-born population - Panama (%)
Place of birth for the foreign-born population - Other Central America (%)
Place of birth for the foreign-born population - Argentina (%)
Place of birth for the foreign-born population - Bolivia (%)
Place of birth for the foreign-born population - Brazil (%)
Place of birth for the foreign-born population - Chile (%)
Place of birth for the foreign-born population - Colombia (%)
Place of birth for the foreign-born population - Ecuador (%)
Place of birth for the foreign-born population - Guyana (%)
Place of birth for the foreign-born population - Peru (%)
Place of birth for the foreign-born population - Uruguay (%)
Place of birth for the foreign-born population - Venezuela (%)
Place of birth for the foreign-born population - Other South America (%)
Place of birth for the foreign-born population - Canada (%)
Place of birth for the foreign-born population - Other Northern America (%)
Place of birth for the foreign-born population - Other (%)
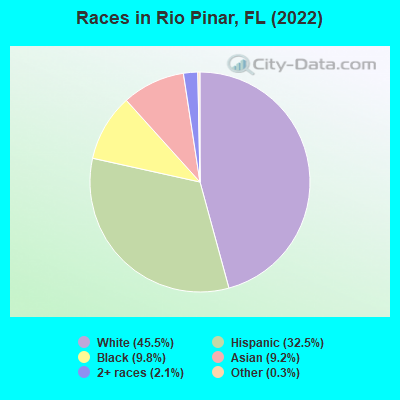
According to 2022 data, the most numerous races in Rio Pinar, FL are White alone (2,620 residents), Hispanic (1,872 residents), and Black alone (564 residents). 61.5% of Rio Pinar residents speak English at home.
Race distribution in Rio Pinar 2,620 45.5% White alone 1,872 32.5% Hispanic 564 9.8% Black alone 529 9.2% Asian alone 123 2.1% Two or more races 15 0.3% Other race alone
2000 2022
10,458,509 65.4% White alone 2,682,715 16.8% Hispanic 2,264,268 14.2% Black alone 261,693 1.6% Asian alone 236,954 1.5% Two or more races 42,358 0.3% American Indian alone 28,994 0.2% Other race alone 6,887 0.04% Native Hawaiian and Other
11,309,403 50.8% White alone 6,025,039 27.1% Hispanic 3,241,015 14.6% Black alone 861,630 3.9% Two or more races 623,692 2.8% Asian alone 152,054 0.7% Other race alone 22,504 0.1% American Indian alone 9,486 0.04% Native Hawaiian and Other
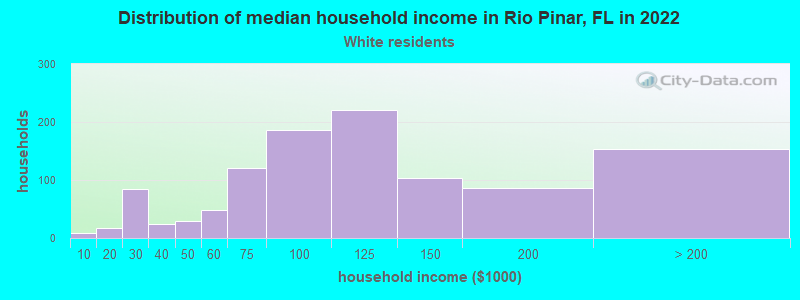
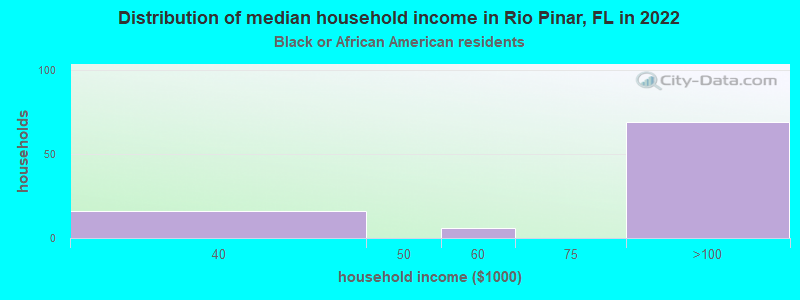
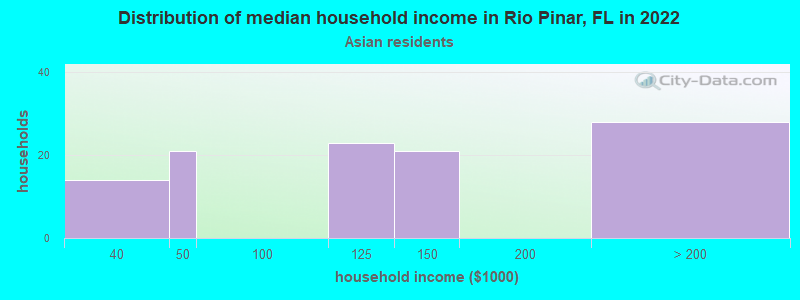
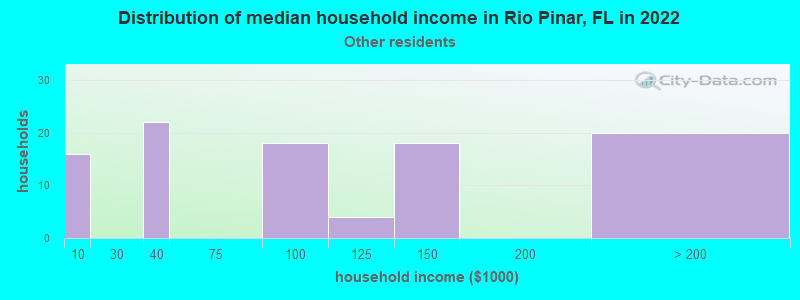
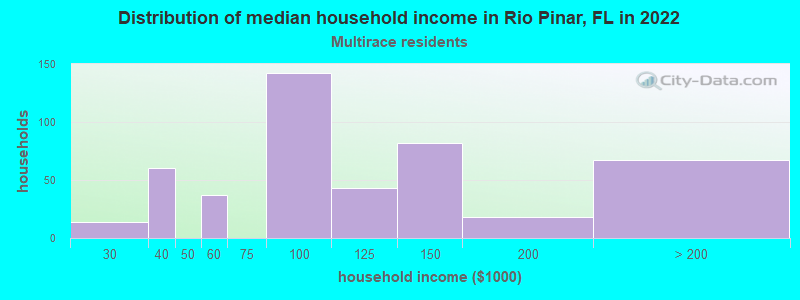
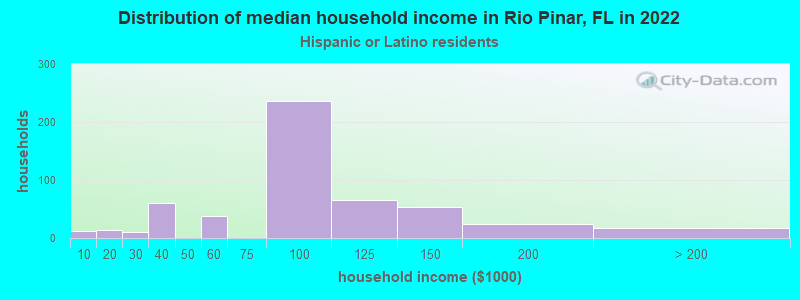
Income and house value in Rio Pinar Median household income in 2022 $97,434 White non-Hispanic householders$87,602 Black householders$108,841 Asian householders$93,786 Two or more races householders$83,727 Hispanic or Latino race householders
Median age by race in Rio Pinar
54.7 Median age for White residents53.1 56.5 22.1 Median age for Black or African American residents22.0 39.2 -614,300,100.1 Median age for American Indian / Alaska Native residents-735,632,183.2 -529,680,364.8 35.7 Median age for Asian residents47.4 31.6 -679,790,025.6 Median age for Native Hawaiian / Pacific Islander residents-1,327,635,326.3 -611,111,110.5 37.7 Median age for Other race residents37.2 37.8 39.5 Median age for Two or more races residents37.4 40.9 55.8 Median age for White alone residents54.4 59.3 38.9 Median age for Hispanic or Latino residents42.1 38.2
Owner/renter occupied households by race in Rio Pinar
House owners and renters - White residents 1,032 92.2% Owner occupied88 7.8% Renter occupiedHouse owners and renters - Black or African American residents 28 26.8% Owner occupied76 73.2% Renter occupiedHouse owners and renters - Asian residents 112 89.0% Owner occupied14 11.0% Renter occupiedHouse owners and renters - Other race residents 102 100.0% Owner occupiedHouse owners and renters - Two or more races residents 387 81.0% Owner occupied91 19.0% Renter occupiedHouse owners and renters - White alone residents 1,003 91.7% Owner occupied91 8.3% Renter occupiedHouse owners and renters - Hispanic or Latino residents 431 81.3% Owner occupied99 18.7% Renter occupied
Language usage in Rio Pinar
English speakers - Total 61.5% of residents of Rio Pinar speak English at home.
25.9% of residents speak Spanish at home 882 61.2% Speak English very well560 38.8% Speak English less than very well12.5% of residents speak other language at home 488 70.1% Speak English very well208 29.9% Speak English less than very well
English speakers - Born in the United States 82.3% of residents of Rio Pinar speak English at home.
13.1% of residents speak Spanish at home 259 100.0% Speak English very well4.3% of residents speak other language at home 84 100.0% Speak English very well
English speakers - Native, born elsewhere 5.7% of residents of Rio Pinar speak English at home.
79.5% of residents speak Spanish at home 153 52.0% Speak English very well141 48.0% Speak English less than very well9.7% of residents speak other language at home 36 100.0% Speak English very well
English speakers - Foreign-born 21.6% of residents of Rio Pinar speak English at home.
41.9% of residents speak Spanish at home 244 43.8% Speak English very well313 56.2% Speak English less than very well36.2% of residents speak other language at home 279 58.0% Speak English very well202 42.0% Speak English less than very well
White (Caucasian) - Speak only English Native:
95.6% (2,276)Foreign-born:
25.6% (53)
White (Caucasian) - Speak another language Native:
7.2% (172)Foreign-born:
75.6% (156)
Black or African American - Speak only English Native:
92.1% (402)Foreign-born:
100.0% (106)
Asian - Speak only English Native:
28.5% (47)Foreign-born:
22.5% (79)
Asian - Speak another language Native:
65.9% (110)Foreign-born:
77.2% (272)
Other race - Speak only English Native:
21.2% (34)Foreign-born:
4.8% (12)
Other race - Speak another language Native:
77.4% (123)Foreign-born:
96.2% (246)
Two or more races - Speak only English Native:
29.7% (323)Foreign-born:
4.2% (18)
Two or more races - Speak another language Native:
71.5% (778)Foreign-born:
95.9% (418)
White alone - Speak only English Native:
95.3% (2,244)Foreign-born:
25.7% (63)
White alone - Speak another language Native:
4.7% (110)Foreign-born:
73.9% (180)
Hispanic or Latino - Speak only English Native:
28.3% (337)Foreign-born:
3.8% (22)
Hispanic or Latino - Speak another language Native:
70.3% (836)Foreign-born:
96.4% (558)
Foreign-born residents in Rio Pinar
Marital status for residents in Rio Pinar Marital status - White (Caucasian) population 15 years and over
Males 29.9% Never married60.7% Now married0.7% Separated4.3% Widowed4.3% DivorcedFemales 23.9% Never married57.1% Now married0.6% Separated9.5% Widowed8.9% DivorcedWomen who did not give birth in the past 12 months Now married:
46.0% (195)Unmarried:
54.0% (229)
Marital status - Black or African American population 15 years and over
Males 65.7% Never married21.6% Now married0.0% Separated0.0% Widowed12.7% DivorcedFemales 45.5% Never married43.9% Now married10.6% Separated0.0% Widowed0.0% DivorcedWomen who did not give birth in the past 12 months Now married:
34.8% (32)Unmarried:
65.2% (60)
Marital status - Asian population 15 years and over
Males 42.9% Never married57.1% Now married0.0% Separated0.0% Widowed0.0% DivorcedFemales 42.0% Never married43.1% Now married0.0% Separated8.5% Widowed6.4% DivorcedWomen who did not give birth in the past 12 months Now married:
38.6% (79)Unmarried:
61.4% (126)
Marital status - Other race population 15 years and over
Males 28.6% Never married71.4% Now married0.0% Separated0.0% Widowed0.0% DivorcedFemales 32.6% Never married39.9% Now married0.0% Separated4.3% Widowed23.2% DivorcedWomen who did not give birth in the past 12 months Now married:
48.3% (98)Unmarried:
51.7% (105)
Marital status - Two or more races population 15 years and over
Males 41.6% Never married45.0% Now married0.0% Separated0.0% Widowed13.4% DivorcedFemales 27.3% Never married60.9% Now married0.0% Separated7.2% Widowed4.6% DivorcedWomen who gave birth in the past 12 months Now married:
100.0% (23)Unmarried:
0.0% (0)
Women who did not give birth in the past 12 months Now married:
55.4% (243)Unmarried:
44.6% (196)
Marital status - White alone, not Hispanic / Latino population 15 years and over
Males 24.8% Never married65.1% Now married0.9% Separated5.3% Widowed4.0% DivorcedFemales 21.7% Never married58.7% Now married0.7% Separated10.1% Widowed8.8% DivorcedWomen who did not give birth in the past 12 months Now married:
51.7% (210)Unmarried:
48.3% (196)
Marital status - Hispanic or Latino population 15 years and over
Males 44.6% Never married45.1% Now married0.0% Separated0.0% Widowed10.3% DivorcedFemales 33.3% Never married50.7% Now married0.0% Separated6.3% Widowed9.8% DivorcedWomen who gave birth in the past 12 months Now married:
100.0% (16)Unmarried:
0.0% (0)
Women who did not give birth in the past 12 months Now married:
46.2% (268)Unmarried:
53.8% (313)
Ancestries in Rio Pinar
367 12.7% African239 8.3% English234 8.1% Italian132 4.6% Irish100 3.5% Jamaican96 3.3% Jordanian93 3.2% Lebanese83 2.9% American75 2.6% German68 2.4% Swedish34 1.2% Brazilian24 0.8% European23 0.8% French19 0.7% Polish18 0.6% British12 0.4% Arab12 0.4% Greek10 0.3% Scotch-Irish8 0.3% Danish6 0.2% Australian4 0.1% Dutch3 0.1% Eastern European
Children Nativity (place of birth) in Rio Pinar
Children under 6 years - Living with two parents Both parents native 41 100.0% NativeBoth parents foreign-born 18 100.0% NativeOne native, one foreign-born parent 49 100.0% NativeChildren under 6 years - Living with one parent Native parent 117 100.0% NativeChildren 6 to 17 years - Living with two parents Both parents native 267 99.9% Native0 0.1% Foreign-bornBoth parents foreign-born 186 87.8% Native26 12.2% Foreign-bornOne native, one foreign-born parent 195 100.0% NativeChildren 6 to 17 years - Living with one parent Native parent 159 100.0% NativeForeign-born parent 4 49.1% Native4 50.9% Foreign-born
Grandparents responsible for own grandchildren in Rio Pinar
Grandparents (30 to 59 years) White / Caucasian 19 100.0% Responsible for grandchildrenOther race 42 100.0% Not responsible for grandchildrenWhite alone, not Hispanic / Latino 22 100.0% Responsible for grandchildrenHispanic or Latino 39 100.0% Not responsible for grandchildrenGrandparents (60 years and over) White / Caucasian 18 53.5% Responsible for grandchildren16 46.5% Not responsible for grandchildrenOther race 48 100.0% Responsible for grandchildrenWhite alone, not Hispanic / Latino 26 66.7% Responsible for grandchildren13 33.3% Not responsible for grandchildrenHispanic or Latino 41 64.1% Responsible for grandchildren23 35.9% Not responsible for grandchildren