Races in Potomac, Maryland (MD) Detailed Stats
Data:
Races - White alone (%)
Races - White alone (% change since 2000)
Races - Black alone (%)
Races - Black alone (% change since 2000)
Races - American Indian alone (%)
Races - American Indian alone (% change since 2000)
Races - Asian alone (%)
Races - Asian alone (% change since 2000)
Races - Hispanic (%)
Races - Hispanic (% change since 2000)
Races - Native Hawaiian and Other Pacific Islander alone (%)
Races - Native Hawaiian and Other Pacific Islander alone (% change since 2000)
Races - Two or more races(%)
Races - Two or more races(% change since 2000)
Races - Other race alone (%)
Races - Other race alone (% change since 2000)
Racial diversity
Place of birth - Born in state of residence (%)
Place of birth - Born in state of residence (%) - White
Place of birth - Born in state of residence (%) - Black or African American
Place of birth - Born in state of residence (%) - Asian
Place of birth - Born in state of residence (%) - Hispanic or Latino
Place of birth - Born in state of residence (%) - American Indian and Alaska Native
Place of birth - Born in state of residence (%) - Multirace
Place of birth - Born in state of residence (%) - Other Race
Place of birth - Born in other state (%)
Place of birth - Born in other state (%) - White
Place of birth - Born in other state (%) - Black or African American
Place of birth - Born in other state (%) - Asian
Place of birth - Born in other state (%) - Hispanic or Latino
Place of birth - Born in other state (%) - American Indian and Alaska Native
Place of birth - Born in other state (%) - Multirace
Place of birth - Born in other state (%) - Other Race
Place of birth - Native, outside of US (%)
Place of birth - Native, outside of US (%) - White
Place of birth - Native, outside of US (%) - Black or African American
Place of birth - Native, outside of US (%) - Asian
Place of birth - Native, outside of US (%) - Hispanic or Latino
Place of birth - Native, outside of US (%) - American Indian and Alaska Native
Place of birth - Native, outside of US (%) - Multirace
Place of birth - Native, outside of US (%) - Other Race
Place of birth - Foreign born (%)
Place of birth - Foreign born (%) - White
Place of birth - Foreign born (%) - Black or African American
Place of birth - Foreign born (%) - Asian
Place of birth - Foreign born (%) - Hispanic or Latino
Place of birth - Foreign born (%) - American Indian and Alaska Native
Place of birth - Foreign born (%) - Multirace
Place of birth - Foreign born (%) - Other Race
Residents speaking English at home (%)
Residents speaking English at home - Born in the United States (%)
Residents speaking English at home - Native, born elsewhere (%)
Residents speaking English at home - Foreign born (%)
Residents speaking Spanish at home (%)
Residents speaking Spanish at home - Born in the United States (%)
Residents speaking Spanish at home - Native, born elsewhere (%)
Residents speaking Spanish at home - Foreign born (%)
Residents speaking other language at home (%)
Residents speaking other language at home - Born in the United States (%)
Residents speaking other language at home - Native, born elsewhere (%)
Residents speaking other language at home - Foreign born (%)
Marital status - Never married (%)
Marital status - Now married (%)
Marital status - Separated (%)
Marital status - Widowed (%)
Marital status - Divorced (%)
Ancestries Reported - Arab (%)
Ancestries Reported - Czech (%)
Ancestries Reported - Danish (%)
Ancestries Reported - Dutch (%)
Ancestries Reported - English (%)
Ancestries Reported - French (%)
Ancestries Reported - French Canadian (%)
Ancestries Reported - German (%)
Ancestries Reported - Greek (%)
Ancestries Reported - Hungarian (%)
Ancestries Reported - Irish (%)
Ancestries Reported - Italian (%)
Ancestries Reported - Lithuanian (%)
Ancestries Reported - Norwegian (%)
Ancestries Reported - Polish (%)
Ancestries Reported - Portuguese (%)
Ancestries Reported - Russian (%)
Ancestries Reported - Scotch-Irish (%)
Ancestries Reported - Scottish (%)
Ancestries Reported - Slovak (%)
Ancestries Reported - Subsaharan African (%)
Ancestries Reported - Swedish (%)
Ancestries Reported - Swiss (%)
Ancestries Reported - Ukrainian (%)
Ancestries Reported - United States (%)
Ancestries Reported - Welsh (%)
Ancestries Reported - West Indian (%)
Ancestries Reported - Other (%)
Geographical mobility - Same house 1 year ago (%)
Geographical mobility - Same house 1 year ago (%) - White
Geographical mobility - Same house 1 year ago (%) - Black or African American
Geographical mobility - Same house 1 year ago (%) - Asian
Geographical mobility - Same house 1 year ago (%) - Hispanic or Latino
Geographical mobility - Same house 1 year ago (%) - American Indian and Alaska Native
Geographical mobility - Same house 1 year ago (%) - Multirace
Geographical mobility - Same house 1 year ago (%) - Other Race
Geographical mobility - Moved within same county (%)
Geographical mobility - Moved within same county (%) - White
Geographical mobility - Moved within same county (%) - Black or African American
Geographical mobility - Moved within same county (%) - Asian
Geographical mobility - Moved within same county (%) - Hispanic or Latino
Geographical mobility - Moved within same county (%) - American Indian and Alaska Native
Geographical mobility - Moved within same county (%) - Multirace
Geographical mobility - Moved within same county (%) - Other Race
Geographical mobility - Moved from different county within same state (%)
Geographical mobility - Moved from different county within same state (%) - White
Geographical mobility - Moved from different county within same state (%) - Black or African American
Geographical mobility - Moved from different county within same state (%) - Asian
Geographical mobility - Moved from different county within same state (%) - Hispanic or Latino
Geographical mobility - Moved from different county within same state (%) - American Indian and Alaska Native
Geographical mobility - Moved from different county within same state (%) - Multirace
Geographical mobility - Moved from different county within same state (%) - Other Race
Geographical mobility - Moved from different state (%)
Geographical mobility - Moved from different state (%) - White
Geographical mobility - Moved from different state (%) - Black or African American
Geographical mobility - Moved from different state (%) - Asian
Geographical mobility - Moved from different state (%) - Hispanic or Latino
Geographical mobility - Moved from different state (%) - American Indian and Alaska Native
Geographical mobility - Moved from different state (%) - Multirace
Geographical mobility - Moved from different state (%) - Other Race
Geographical mobility - Moved from abroad (%)
Geographical mobility - Moved from abroad (%) - White
Geographical mobility - Moved from abroad (%) - Black or African American
Geographical mobility - Moved from abroad (%) - Asian
Geographical mobility - Moved from abroad (%) - Hispanic or Latino
Geographical mobility - Moved from abroad (%) - American Indian and Alaska Native
Geographical mobility - Moved from abroad (%) - Multirace
Geographical mobility - Moved from abroad (%) - Other Race
Place of birth for the foreign-born population - Ireland (%)
Place of birth for the foreign-born population - Denmark (%)
Place of birth for the foreign-born population - Norway (%)
Place of birth for the foreign-born population - Sweden (%)
Place of birth for the foreign-born population - United Kingdom (%)
Place of birth for the foreign-born population - England (%)
Place of birth for the foreign-born population - Scotland (%)
Place of birth for the foreign-born population - Other Northern Europe (%)
Place of birth for the foreign-born population - Austria (%)
Place of birth for the foreign-born population - Belgium (%)
Place of birth for the foreign-born population - France (%)
Place of birth for the foreign-born population - Germany (%)
Place of birth for the foreign-born population - Netherlands (%)
Place of birth for the foreign-born population - Switzerland (%)
Place of birth for the foreign-born population - Other Western Europe (%)
Place of birth for the foreign-born population - Greece (%)
Place of birth for the foreign-born population - Italy (%)
Place of birth for the foreign-born population - Portugal (%)
Place of birth for the foreign-born population - Spain (%)
Place of birth for the foreign-born population - Other Southern Europe (%)
Place of birth for the foreign-born population - Albania (%)
Place of birth for the foreign-born population - Belarus (%)
Place of birth for the foreign-born population - Bosnia and Herzegovina (%)
Place of birth for the foreign-born population - Bulgaria (%)
Place of birth for the foreign-born population - Croatia (%)
Place of birth for the foreign-born population - Czechoslovakia (%)
Place of birth for the foreign-born population - Hungary (%)
Place of birth for the foreign-born population - Latvia (%)
Place of birth for the foreign-born population - Lithuania (%)
Place of birth for the foreign-born population - North Macedonia (Macedonia) (%)
Place of birth for the foreign-born population - Moldova (%)
Place of birth for the foreign-born population - Poland (%)
Place of birth for the foreign-born population - Romania (%)
Place of birth for the foreign-born population - Russia (%)
Place of birth for the foreign-born population - Serbia (%)
Place of birth for the foreign-born population - Ukraine (%)
Place of birth for the foreign-born population - Other Eastern Europe (%)
Place of birth for the foreign-born population - China (%)
Place of birth for the foreign-born population - Hong Kong (%)
Place of birth for the foreign-born population - Taiwan (%)
Place of birth for the foreign-born population - Japan (%)
Place of birth for the foreign-born population - Korea (%)
Place of birth for the foreign-born population - Other Eastern Asia (%)
Place of birth for the foreign-born population - Afghanistan (%)
Place of birth for the foreign-born population - Bangladesh (%)
Place of birth for the foreign-born population - India (%)
Place of birth for the foreign-born population - Iran (%)
Place of birth for the foreign-born population - Kazakhstan (%)
Place of birth for the foreign-born population - Nepal (%)
Place of birth for the foreign-born population - Pakistan (%)
Place of birth for the foreign-born population - Sri Lanka (%)
Place of birth for the foreign-born population - Uzbekistan (%)
Place of birth for the foreign-born population - Other South Central Asia (%)
Place of birth for the foreign-born population - Burma (%)
Place of birth for the foreign-born population - Cambodia (%)
Place of birth for the foreign-born population - Indonesia (%)
Place of birth for the foreign-born population - Laos (%)
Place of birth for the foreign-born population - Malaysia (%)
Place of birth for the foreign-born population - Philippines (%)
Place of birth for the foreign-born population - Singapore (%)
Place of birth for the foreign-born population - Thailand (%)
Place of birth for the foreign-born population - Vietnam (%)
Place of birth for the foreign-born population - Other South Eastern Asia (%)
Place of birth for the foreign-born population - Armenia (%)
Place of birth for the foreign-born population - Iraq (%)
Place of birth for the foreign-born population - Israel (%)
Place of birth for the foreign-born population - Jordan (%)
Place of birth for the foreign-born population - Kuwait (%)
Place of birth for the foreign-born population - Lebanon (%)
Place of birth for the foreign-born population - Saudi Arabia (%)
Place of birth for the foreign-born population - Syria (%)
Place of birth for the foreign-born population - Turkey (%)
Place of birth for the foreign-born population - Yemen (%)
Place of birth for the foreign-born population - Other Western Asia (%)
Place of birth for the foreign-born population - Eritrea (%)
Place of birth for the foreign-born population - Ethiopia (%)
Place of birth for the foreign-born population - Kenya (%)
Place of birth for the foreign-born population - Somalia (%)
Place of birth for the foreign-born population - Uganda (%)
Place of birth for the foreign-born population - Zimbabwe (%)
Place of birth for the foreign-born population - Other Eastern Africa (%)
Place of birth for the foreign-born population - Cameroon (%)
Place of birth for the foreign-born population - Congo (%)
Place of birth for the foreign-born population - Democratic Republic of Congo (Zaire) (%)
Place of birth for the foreign-born population - Other Middle Africa (%)
Place of birth for the foreign-born population - Egypt (%)
Place of birth for the foreign-born population - Morocco (%)
Place of birth for the foreign-born population - Sudan (%)
Place of birth for the foreign-born population - Other Northern Africa (%)
Place of birth for the foreign-born population - South Africa (%)
Place of birth for the foreign-born population - Other Southern Africa (%)
Place of birth for the foreign-born population - Cabo Verde (%)
Place of birth for the foreign-born population - Ghana (%)
Place of birth for the foreign-born population - Liberia (%)
Place of birth for the foreign-born population - Nigeria (%)
Place of birth for the foreign-born population - Senegal (%)
Place of birth for the foreign-born population - Sierra Leone (%)
Place of birth for the foreign-born population - Other Western Africa (%)
Place of birth for the foreign-born population - Australia (%)
Place of birth for the foreign-born population - New Zealand (%)
Place of birth for the foreign-born population - Fiji (%)
Place of birth for the foreign-born population - Micronesia (%)
Place of birth for the foreign-born population - Bahamas (%)
Place of birth for the foreign-born population - Barbados (%)
Place of birth for the foreign-born population - Cuba (%)
Place of birth for the foreign-born population - Dominica (%)
Place of birth for the foreign-born population - Dominican Republic (%)
Place of birth for the foreign-born population - Grenada (%)
Place of birth for the foreign-born population - Haiti (%)
Place of birth for the foreign-born population - Jamaica (%)
Place of birth for the foreign-born population - St. Vincent and the Grenadines (%)
Place of birth for the foreign-born population - Trinidad and Tobago (%)
Place of birth for the foreign-born population - West Indies (%)
Place of birth for the foreign-born population - Other Caribbean (%)
Place of birth for the foreign-born population - Belize (%)
Place of birth for the foreign-born population - Costa Rica (%)
Place of birth for the foreign-born population - El Salvador (%)
Place of birth for the foreign-born population - Guatemala (%)
Place of birth for the foreign-born population - Honduras (%)
Place of birth for the foreign-born population - Mexico (%)
Place of birth for the foreign-born population - Nicaragua (%)
Place of birth for the foreign-born population - Panama (%)
Place of birth for the foreign-born population - Other Central America (%)
Place of birth for the foreign-born population - Argentina (%)
Place of birth for the foreign-born population - Bolivia (%)
Place of birth for the foreign-born population - Brazil (%)
Place of birth for the foreign-born population - Chile (%)
Place of birth for the foreign-born population - Colombia (%)
Place of birth for the foreign-born population - Ecuador (%)
Place of birth for the foreign-born population - Guyana (%)
Place of birth for the foreign-born population - Peru (%)
Place of birth for the foreign-born population - Uruguay (%)
Place of birth for the foreign-born population - Venezuela (%)
Place of birth for the foreign-born population - Other South America (%)
Place of birth for the foreign-born population - Canada (%)
Place of birth for the foreign-born population - Other Northern America (%)
Place of birth for the foreign-born population - Other (%)
Latest news about races in Potomac, MD collected exclusively by city-data.com from local newspapers, TV, and radio stations
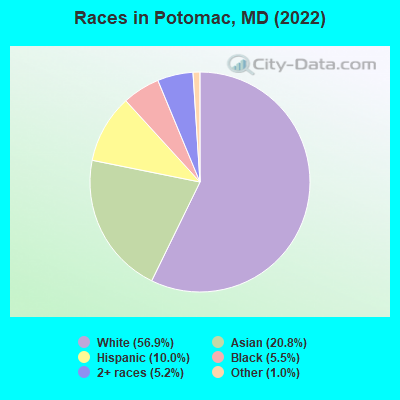
According to 2022 data, the most numerous races in Potomac, MD are White alone (26,356 residents), Black alone (2,549 residents), and Hispanic (4,612 residents). 60.5% of Potomac residents speak English at home. 30.5% of Potomac, MD residents are foreign-born (17.1% born in Asia, 5.1% born in Europe, 4.6% born in Latin America), which is 47.5% greater than the foreign-born rate of 16.0% across the entire state of Maryland.
Race distribution in Potomac
2000 2022
3,286,547 62.1% White alone 1,464,735 27.7% Black alone 227,916 4.3% Hispanic 209,738 4.0% Asian alone 82,946 1.6% Two or more races 13,312 0.3% American Indian alone 9,379 0.2% Other race alone 1,913 0.04% Native Hawaiian and Other
2,906,492 47.1% White alone 1,800,914 29.2% Black alone 705,842 11.4% Hispanic 401,818 6.5% Asian alone 291,317 4.7% Two or more races 46,930 0.8% Other race alone 8,930 0.1% American Indian alone 2,417 0.04% Native Hawaiian and Other
Income and house value in Potomac Median household income in 2022 over $200,000 White non-Hispanic householders$104,697 Black householdersover $200,000 Asian householdersover $200,000 Two or more races householders$167,338 Hispanic or Latino race householdersMedian 2022 house value over $1,000,000 White Non-Hispanic householdersover $1,000,000 Black or African American householders$868,174 American Indian or Alaska Native householders over $1,000,000 Asian householders$437,560 Some other race householdersover $1,000,000 Two or more races householders$992,199 Hispanic or Latino householders
Median age by race in Potomac
53.3 Median age for White residents51.5 53.8 43.5 Median age for Black or African American residents23.4 46.8 -610,526,315.2 Median age for American Indian / Alaska Native residents-555,555,555.0 -671,704,449.4 46.5 Median age for Asian residents44.6 47.1 -763,333,332.6 Median age for Native Hawaiian / Pacific Islander residents-720,061,021.4 -760,942,760.2 49.2 Median age for Other race residents38.3 50.6 32.6 Median age for Two or more races residents22.9 39.9 52.9 Median age for White alone residents52.3 53.4 36.1 Median age for Hispanic or Latino residents31.3 37.1
Owner/renter occupied households by race in Potomac
House owners and renters - White residents 9,415 87.0% Owner occupied1,410 13.0% Renter occupiedHouse owners and renters - Black or African American residents 393 51.1% Owner occupied377 48.9% Renter occupiedHouse owners and renters - Asian residents 2,949 90.5% Owner occupied310 9.5% Renter occupiedHouse owners and renters - Other race residents 384 87.1% Owner occupied57 12.9% Renter occupiedHouse owners and renters - Two or more races residents 755 82.3% Owner occupied162 17.7% Renter occupiedHouse owners and renters - White alone residents 9,344 87.3% Owner occupied1,354 12.7% Renter occupiedHouse owners and renters - Hispanic or Latino residents 843 78.7% Owner occupied228 21.3% Renter occupied
Language usage in Potomac
English speakers - Total 60.5% of residents of Potomac speak English at home.
6.8% of residents speak Spanish at home 2,504 83.1% Speak English very well510 16.9% Speak English less than very well32.8% of residents speak other language at home 11,041 76.1% Speak English very well3,470 23.9% Speak English less than very well
English speakers - Born in the United States 84.5% of residents of Potomac speak English at home.
4.4% of residents speak Spanish at home 889 98.6% Speak English very well13 1.4% Speak English less than very well11.8% of residents speak other language at home 2,120 86.8% Speak English very well322 13.2% Speak English less than very well
English speakers - Native, born elsewhere 62.2% of residents of Potomac speak English at home.
19.0% of residents speak Spanish at home 130 83.3% Speak English very well26 16.7% Speak English less than very well16.6% of residents speak other language at home 107 78.7% Speak English very well29 21.3% Speak English less than very well
English speakers - Foreign-born 15.0% of residents of Potomac speak English at home.
11.9% of residents speak Spanish at home 1,186 71.1% Speak English very well482 28.9% Speak English less than very well72.9% of residents speak other language at home 7,380 72.0% Speak English very well2,867 28.0% Speak English less than very well
White (Caucasian) - Speak only English Native:
91.5% (19,598)Foreign-born:
27.5% (1,118)
White (Caucasian) - Speak another language Native:
8.2% (1,746)Foreign-born:
73.8% (2,997)
Black or African American - Speak only English Native:
80.1% (1,575)Foreign-born:
15.8% (95)
Black or African American - Speak another language Native:
20.6% (404)Foreign-born:
85.5% (515)
Asian - Speak only English Native:
39.4% (1,243)Foreign-born:
11.4% (702)
Asian - Speak another language Native:
62.1% (1,958)Foreign-born:
88.5% (5,436)
Other race - Speak only English Native:
73.6% (300)Foreign-born:
13.2% (77)
Other race - Speak another language Native:
39.4% (161)Foreign-born:
85.2% (499)
Two or more races - Speak only English Native:
67.6% (1,829)Foreign-born:
11.6% (207)
Two or more races - Speak another language Native:
31.7% (858)Foreign-born:
88.3% (1,581)
White alone - Speak only English Native:
91.6% (19,349)Foreign-born:
23.2% (1,043)
White alone - Speak another language Native:
8.2% (1,725)Foreign-born:
76.8% (3,453)
Hispanic or Latino - Speak only English Native:
48.4% (1,029)Foreign-born:
8.4% (156)
Hispanic or Latino - Speak another language Native:
53.3% (1,133)Foreign-born:
91.2% (1,682)
Foreign-born residents in Potomac 14,107 residents are foreign born (17.1% Asia , 5.1% Europe , 4.6% Latin America ).
This city:
30.5%Maryland:
15.7%
Marital status for residents in Potomac Marital status - White (Caucasian) population 15 years and over
Males 24.6% Never married68.9% Now married0.7% Separated1.9% Widowed3.9% DivorcedFemales 19.8% Never married61.5% Now married0.8% Separated9.3% Widowed8.5% DivorcedWomen who gave birth in the past 12 months Now married:
100.0% (163)Unmarried:
0.0% (0)
Women who did not give birth in the past 12 months Now married:
49.0% (2,077)Unmarried:
51.0% (2,157)
Marital status - Black or African American population 15 years and over
Males 35.7% Never married55.7% Now married1.2% Separated0.0% Widowed7.4% DivorcedFemales 36.2% Never married37.8% Now married3.9% Separated12.2% Widowed9.9% DivorcedWomen who gave birth in the past 12 months Now married:
0.0% (0)Unmarried:
100.0% (9)
Women who did not give birth in the past 12 months Now married:
47.9% (314)Unmarried:
52.1% (342)
Marital status - Asian population 15 years and over
Males 21.5% Never married75.1% Now married0.0% Separated1.2% Widowed2.2% DivorcedFemales 18.3% Never married68.1% Now married0.3% Separated8.6% Widowed4.6% DivorcedWomen who gave birth in the past 12 months Now married:
100.0% (40)Unmarried:
0.0% (0)
Women who did not give birth in the past 12 months Now married:
63.9% (1,480)Unmarried:
36.1% (838)
Marital status - Other race population 15 years and over
Males 41.7% Never married58.3% Now married0.0% Separated0.0% Widowed0.0% DivorcedFemales 25.8% Never married60.0% Now married4.7% Separated2.2% Widowed7.3% DivorcedWomen who did not give birth in the past 12 months Now married:
66.1% (141)Unmarried:
33.9% (72)
Marital status - Two or more races population 15 years and over
Males 28.0% Never married69.6% Now married0.0% Separated0.0% Widowed2.4% DivorcedFemales 33.2% Never married59.4% Now married0.8% Separated2.6% Widowed3.9% DivorcedWomen who gave birth in the past 12 months Now married:
100.0% (89)Unmarried:
0.0% (0)
Women who did not give birth in the past 12 months Now married:
47.9% (412)Unmarried:
52.1% (448)
Marital status - White alone, not Hispanic / Latino population 15 years and over
Males 25.2% Never married68.1% Now married0.8% Separated1.9% Widowed4.1% DivorcedFemales 19.3% Never married61.3% Now married0.8% Separated10.0% Widowed8.6% DivorcedWomen who gave birth in the past 12 months Now married:
100.0% (148)Unmarried:
0.0% (0)
Women who did not give birth in the past 12 months Now married:
48.7% (2,006)Unmarried:
51.3% (2,117)
Marital status - Hispanic or Latino population 15 years and over
Males 24.6% Never married73.4% Now married0.0% Separated0.7% Widowed1.4% DivorcedFemales 33.6% Never married59.3% Now married1.3% Separated0.6% Widowed5.1% DivorcedWomen who gave birth in the past 12 months Now married:
100.0% (89)Unmarried:
0.0% (0)
Women who did not give birth in the past 12 months Now married:
50.3% (510)Unmarried:
49.7% (504)
Ancestries in Potomac
1,754 6.3% Iranian1,671 6.0% German1,434 5.2% American1,083 3.9% Irish866 3.1% European813 2.9% Russian784 2.8% Eastern European702 2.5% English676 2.4% Polish492 1.8% Italian379 1.4% Ukrainian374 1.4% African323 1.2% French257 0.9% Greek240 0.9% Romanian180 0.7% Belgian166 0.6% British142 0.5% Brazilian141 0.5% Northern European139 0.5% Nigerian129 0.5% Egyptian102 0.4% Sierra Leonean100 0.4% Scottish98 0.4% Turkish98 0.4% Lebanese95 0.3% Scotch-Irish78 0.3% Moroccan77 0.3% Lithuanian76 0.3% Ethiopian74 0.3% Norwegian70 0.3% Portuguese69 0.2% Hungarian58 0.2% Swedish57 0.2% Finnish56 0.2% Swiss52 0.2% Armenian48 0.2% Iraqi44 0.2% Kenyan42 0.2% Czech41 0.1% Bulgarian37 0.1% Haitian28 0.1% Dutch25 0.09% Slovak24 0.09% Austrian22 0.08% Canadian21 0.08% Jamaican18 0.07% Slovene17 0.06% West Indian14 0.05% Barbadian13 0.05% Latvian12 0.04% Syrian11 0.04% Trinidadian and Tobagonian11 0.04% U.S. Virgin Islander9 0.03% Serbian8 0.03% Australian8 0.03% Welsh3 0.01% French Canadian
Geographical mobility in Potomac Same house 1 year ago 24,599 93.6% White (Caucasian)2,253 85.2% Black or African American1 98.9% American Indian / Alaska Native8,280 86.6% Asian20 100.0% Native Hawaiian / Pacific Islander969 90.3% Other race4,443 90.3% Two or more races24,503 93.6% White alone, not Hispanic / Latino3,935 86.8% Hispanic or LatinoMoved within same county 1,114 4.2% White / Caucasian229 8.7% Black or African American662 6.9% Asian22 2.0% Other race172 3.5% Two or more races1,087 4.2% White alone, not Hispanic / Latino278 6.1% Hispanic or LatinoMoved within same state 98 0.4% White / Caucasian16 0.6% Black or African American27 0.3% Asian6 0.1% Two or more races106 0.4% White alone, not Hispanic / Latino6 0.1% Hispanic or LatinoMoved from different state 604 2.3% White / Caucasian26 1.0% Black or African American270 2.8% Asian86 8.0% Other race123 2.5% Two or more races611 2.3% White alone, not Hispanic / Latino151 3.3% Hispanic or LatinoMoved from abroad 34 0.1% White70 2.6% Black or African American289 3.0% Asian254 5.2% Two or more races23 0.1% White alone, not Hispanic / Latino129 2.8% Hispanic or Latino
Children Nativity (place of birth) in Potomac
Children under 6 years - Living with two parents Both parents native 1,426 100.0% NativeBoth parents foreign-born 624 98.5% Native10 1.5% Foreign-bornOne native, one foreign-born parent 318 100.0% NativeChildren under 6 years - Living with one parent Native parent 85 100.0% NativeForeign-born parent 37 100.0% NativeChildren 6 to 17 years - Living with two parents Both parents native 3,062 98.6% Native43 1.4% Foreign-bornBoth parents foreign-born 2,115 80.2% Native523 19.8% Foreign-bornOne native, one foreign-born parent 1,040 97.2% Native30 2.8% Foreign-bornChildren 6 to 17 years - Living with one parent Native parent 616 100.0% NativeForeign-born parent 450 60.7% Native292 39.3% Foreign-born
Place of birth for residents in Potomac 8,236 Asia4,055 Eastern Asia3,199 South Central Asia3,152 China2,463 Europe2,354 Americas2,238 Latin America1,529 South America1,000 Africa982 Western Europe969 Eastern Europe658 South Eastern Asia598 Central America352 Northern Europe329 Northern Africa319 Eastern Africa314 Western Asia305 Western Africa159 Southern Europe116 Northern America110 Caribbean51 Oceania51 Australia and New Zealand Subregion38 Southern Africa7 Middle Africa2,318 China1,372 India1,220 Iran746 Korea704 Taiwan443 Germany436 Colombia334 Russia294 Brazil287 France286 Pakistan267 Vietnam227 Mexico207 Ukraine206 Peru180 Bangladesh174 Egypt173 Chile167 El Salvador159 Argentina131 Eritrea130 Nigeria129 Hong Kong126 Romania125 Ecuador121 Israel120 United Kingdom116 Canada114 Philippines112 England103 Switzerland101 Belgium91 Japan90 Morocco87 Thailand86 Sierra Leone73 Spain71 Ireland70 Kenya70 Malaysia69 Honduras68 Turkey66 Sri Lanka62 Bulgaria57 Cambodia50 Bolivia47 Iraq44 Singapore42 Nicaragua42 Poland40 Cuba40 Venezuela38 Czechoslovakia38 South Africa35 Lebanon34 Azerbaijan34 Netherlands32 Costa Rica32 Nepal31 Trinidad and Tobago30 Moldova30 Panama29 Portugal29 Italy29 Guatemala28 Greece25 Australia25 New Zealand25 Uzbekistan25 Algeria24 Guyana22 Belarus19 Barbados18 Serbia16 Zimbabwe16 Indonesia16 Uruguay14 Norway14 Afghanistan11 Austria10 Togo10 Ethiopia10 Liberia10 Ghana9 Haiti9 Jamaica8 Uganda7 Syria7 Democratic Republic of Congo (Zaire)5 Scotland2 Latvia1 Hungary
Grandparents responsible for own grandchildren in Potomac
Grandparents (30 to 59 years) White / Caucasian 24 68.7% Responsible for grandchildren11 31.3% Not responsible for grandchildrenBlack or African American 13 100.0% Responsible for grandchildrenAsian 13 100.0% Not responsible for grandchildrenTwo or more races 56 100.0% Not responsible for grandchildrenWhite alone, not Hispanic / Latino 25 56.5% Responsible for grandchildren19 43.5% Not responsible for grandchildrenHispanic or Latino 47 100.0% Not responsible for grandchildrenGrandparents (60 years and over) White / Caucasian 29 11.9% Responsible for grandchildren217 88.1% Not responsible for grandchildrenBlack or African American 27 38.9% Responsible for grandchildren43 61.1% Not responsible for grandchildrenAsian 64 23.2% Responsible for grandchildren211 76.8% Not responsible for grandchildrenTwo or more races 118 100.0% Not responsible for grandchildrenWhite alone, not Hispanic / Latino 24 8.1% Responsible for grandchildren270 91.9% Not responsible for grandchildren