Races in Port Charlotte, Florida (FL) Detailed Stats
Data:
Races - White alone (%)
Races - White alone (% change since 2000)
Races - Black alone (%)
Races - Black alone (% change since 2000)
Races - American Indian alone (%)
Races - American Indian alone (% change since 2000)
Races - Asian alone (%)
Races - Asian alone (% change since 2000)
Races - Hispanic (%)
Races - Hispanic (% change since 2000)
Races - Native Hawaiian and Other Pacific Islander alone (%)
Races - Native Hawaiian and Other Pacific Islander alone (% change since 2000)
Races - Two or more races(%)
Races - Two or more races(% change since 2000)
Races - Other race alone (%)
Races - Other race alone (% change since 2000)
Racial diversity
Place of birth - Born in state of residence (%)
Place of birth - Born in state of residence (%) - White
Place of birth - Born in state of residence (%) - Black or African American
Place of birth - Born in state of residence (%) - Asian
Place of birth - Born in state of residence (%) - Hispanic or Latino
Place of birth - Born in state of residence (%) - American Indian and Alaska Native
Place of birth - Born in state of residence (%) - Multirace
Place of birth - Born in state of residence (%) - Other Race
Place of birth - Born in other state (%)
Place of birth - Born in other state (%) - White
Place of birth - Born in other state (%) - Black or African American
Place of birth - Born in other state (%) - Asian
Place of birth - Born in other state (%) - Hispanic or Latino
Place of birth - Born in other state (%) - American Indian and Alaska Native
Place of birth - Born in other state (%) - Multirace
Place of birth - Born in other state (%) - Other Race
Place of birth - Native, outside of US (%)
Place of birth - Native, outside of US (%) - White
Place of birth - Native, outside of US (%) - Black or African American
Place of birth - Native, outside of US (%) - Asian
Place of birth - Native, outside of US (%) - Hispanic or Latino
Place of birth - Native, outside of US (%) - American Indian and Alaska Native
Place of birth - Native, outside of US (%) - Multirace
Place of birth - Native, outside of US (%) - Other Race
Place of birth - Foreign born (%)
Place of birth - Foreign born (%) - White
Place of birth - Foreign born (%) - Black or African American
Place of birth - Foreign born (%) - Asian
Place of birth - Foreign born (%) - Hispanic or Latino
Place of birth - Foreign born (%) - American Indian and Alaska Native
Place of birth - Foreign born (%) - Multirace
Place of birth - Foreign born (%) - Other Race
Residents speaking English at home (%)
Residents speaking English at home - Born in the United States (%)
Residents speaking English at home - Native, born elsewhere (%)
Residents speaking English at home - Foreign born (%)
Residents speaking Spanish at home (%)
Residents speaking Spanish at home - Born in the United States (%)
Residents speaking Spanish at home - Native, born elsewhere (%)
Residents speaking Spanish at home - Foreign born (%)
Residents speaking other language at home (%)
Residents speaking other language at home - Born in the United States (%)
Residents speaking other language at home - Native, born elsewhere (%)
Residents speaking other language at home - Foreign born (%)
Marital status - Never married (%)
Marital status - Now married (%)
Marital status - Separated (%)
Marital status - Widowed (%)
Marital status - Divorced (%)
Ancestries Reported - Arab (%)
Ancestries Reported - Czech (%)
Ancestries Reported - Danish (%)
Ancestries Reported - Dutch (%)
Ancestries Reported - English (%)
Ancestries Reported - French (%)
Ancestries Reported - French Canadian (%)
Ancestries Reported - German (%)
Ancestries Reported - Greek (%)
Ancestries Reported - Hungarian (%)
Ancestries Reported - Irish (%)
Ancestries Reported - Italian (%)
Ancestries Reported - Lithuanian (%)
Ancestries Reported - Norwegian (%)
Ancestries Reported - Polish (%)
Ancestries Reported - Portuguese (%)
Ancestries Reported - Russian (%)
Ancestries Reported - Scotch-Irish (%)
Ancestries Reported - Scottish (%)
Ancestries Reported - Slovak (%)
Ancestries Reported - Subsaharan African (%)
Ancestries Reported - Swedish (%)
Ancestries Reported - Swiss (%)
Ancestries Reported - Ukrainian (%)
Ancestries Reported - United States (%)
Ancestries Reported - Welsh (%)
Ancestries Reported - West Indian (%)
Ancestries Reported - Other (%)
Geographical mobility - Same house 1 year ago (%)
Geographical mobility - Same house 1 year ago (%) - White
Geographical mobility - Same house 1 year ago (%) - Black or African American
Geographical mobility - Same house 1 year ago (%) - Asian
Geographical mobility - Same house 1 year ago (%) - Hispanic or Latino
Geographical mobility - Same house 1 year ago (%) - American Indian and Alaska Native
Geographical mobility - Same house 1 year ago (%) - Multirace
Geographical mobility - Same house 1 year ago (%) - Other Race
Geographical mobility - Moved within same county (%)
Geographical mobility - Moved within same county (%) - White
Geographical mobility - Moved within same county (%) - Black or African American
Geographical mobility - Moved within same county (%) - Asian
Geographical mobility - Moved within same county (%) - Hispanic or Latino
Geographical mobility - Moved within same county (%) - American Indian and Alaska Native
Geographical mobility - Moved within same county (%) - Multirace
Geographical mobility - Moved within same county (%) - Other Race
Geographical mobility - Moved from different county within same state (%)
Geographical mobility - Moved from different county within same state (%) - White
Geographical mobility - Moved from different county within same state (%) - Black or African American
Geographical mobility - Moved from different county within same state (%) - Asian
Geographical mobility - Moved from different county within same state (%) - Hispanic or Latino
Geographical mobility - Moved from different county within same state (%) - American Indian and Alaska Native
Geographical mobility - Moved from different county within same state (%) - Multirace
Geographical mobility - Moved from different county within same state (%) - Other Race
Geographical mobility - Moved from different state (%)
Geographical mobility - Moved from different state (%) - White
Geographical mobility - Moved from different state (%) - Black or African American
Geographical mobility - Moved from different state (%) - Asian
Geographical mobility - Moved from different state (%) - Hispanic or Latino
Geographical mobility - Moved from different state (%) - American Indian and Alaska Native
Geographical mobility - Moved from different state (%) - Multirace
Geographical mobility - Moved from different state (%) - Other Race
Geographical mobility - Moved from abroad (%)
Geographical mobility - Moved from abroad (%) - White
Geographical mobility - Moved from abroad (%) - Black or African American
Geographical mobility - Moved from abroad (%) - Asian
Geographical mobility - Moved from abroad (%) - Hispanic or Latino
Geographical mobility - Moved from abroad (%) - American Indian and Alaska Native
Geographical mobility - Moved from abroad (%) - Multirace
Geographical mobility - Moved from abroad (%) - Other Race
Place of birth for the foreign-born population - Ireland (%)
Place of birth for the foreign-born population - Denmark (%)
Place of birth for the foreign-born population - Norway (%)
Place of birth for the foreign-born population - Sweden (%)
Place of birth for the foreign-born population - United Kingdom (%)
Place of birth for the foreign-born population - England (%)
Place of birth for the foreign-born population - Scotland (%)
Place of birth for the foreign-born population - Other Northern Europe (%)
Place of birth for the foreign-born population - Austria (%)
Place of birth for the foreign-born population - Belgium (%)
Place of birth for the foreign-born population - France (%)
Place of birth for the foreign-born population - Germany (%)
Place of birth for the foreign-born population - Netherlands (%)
Place of birth for the foreign-born population - Switzerland (%)
Place of birth for the foreign-born population - Other Western Europe (%)
Place of birth for the foreign-born population - Greece (%)
Place of birth for the foreign-born population - Italy (%)
Place of birth for the foreign-born population - Portugal (%)
Place of birth for the foreign-born population - Spain (%)
Place of birth for the foreign-born population - Other Southern Europe (%)
Place of birth for the foreign-born population - Albania (%)
Place of birth for the foreign-born population - Belarus (%)
Place of birth for the foreign-born population - Bosnia and Herzegovina (%)
Place of birth for the foreign-born population - Bulgaria (%)
Place of birth for the foreign-born population - Croatia (%)
Place of birth for the foreign-born population - Czechoslovakia (%)
Place of birth for the foreign-born population - Hungary (%)
Place of birth for the foreign-born population - Latvia (%)
Place of birth for the foreign-born population - Lithuania (%)
Place of birth for the foreign-born population - North Macedonia (Macedonia) (%)
Place of birth for the foreign-born population - Moldova (%)
Place of birth for the foreign-born population - Poland (%)
Place of birth for the foreign-born population - Romania (%)
Place of birth for the foreign-born population - Russia (%)
Place of birth for the foreign-born population - Serbia (%)
Place of birth for the foreign-born population - Ukraine (%)
Place of birth for the foreign-born population - Other Eastern Europe (%)
Place of birth for the foreign-born population - China (%)
Place of birth for the foreign-born population - Hong Kong (%)
Place of birth for the foreign-born population - Taiwan (%)
Place of birth for the foreign-born population - Japan (%)
Place of birth for the foreign-born population - Korea (%)
Place of birth for the foreign-born population - Other Eastern Asia (%)
Place of birth for the foreign-born population - Afghanistan (%)
Place of birth for the foreign-born population - Bangladesh (%)
Place of birth for the foreign-born population - India (%)
Place of birth for the foreign-born population - Iran (%)
Place of birth for the foreign-born population - Kazakhstan (%)
Place of birth for the foreign-born population - Nepal (%)
Place of birth for the foreign-born population - Pakistan (%)
Place of birth for the foreign-born population - Sri Lanka (%)
Place of birth for the foreign-born population - Uzbekistan (%)
Place of birth for the foreign-born population - Other South Central Asia (%)
Place of birth for the foreign-born population - Burma (%)
Place of birth for the foreign-born population - Cambodia (%)
Place of birth for the foreign-born population - Indonesia (%)
Place of birth for the foreign-born population - Laos (%)
Place of birth for the foreign-born population - Malaysia (%)
Place of birth for the foreign-born population - Philippines (%)
Place of birth for the foreign-born population - Singapore (%)
Place of birth for the foreign-born population - Thailand (%)
Place of birth for the foreign-born population - Vietnam (%)
Place of birth for the foreign-born population - Other South Eastern Asia (%)
Place of birth for the foreign-born population - Armenia (%)
Place of birth for the foreign-born population - Iraq (%)
Place of birth for the foreign-born population - Israel (%)
Place of birth for the foreign-born population - Jordan (%)
Place of birth for the foreign-born population - Kuwait (%)
Place of birth for the foreign-born population - Lebanon (%)
Place of birth for the foreign-born population - Saudi Arabia (%)
Place of birth for the foreign-born population - Syria (%)
Place of birth for the foreign-born population - Turkey (%)
Place of birth for the foreign-born population - Yemen (%)
Place of birth for the foreign-born population - Other Western Asia (%)
Place of birth for the foreign-born population - Eritrea (%)
Place of birth for the foreign-born population - Ethiopia (%)
Place of birth for the foreign-born population - Kenya (%)
Place of birth for the foreign-born population - Somalia (%)
Place of birth for the foreign-born population - Uganda (%)
Place of birth for the foreign-born population - Zimbabwe (%)
Place of birth for the foreign-born population - Other Eastern Africa (%)
Place of birth for the foreign-born population - Cameroon (%)
Place of birth for the foreign-born population - Congo (%)
Place of birth for the foreign-born population - Democratic Republic of Congo (Zaire) (%)
Place of birth for the foreign-born population - Other Middle Africa (%)
Place of birth for the foreign-born population - Egypt (%)
Place of birth for the foreign-born population - Morocco (%)
Place of birth for the foreign-born population - Sudan (%)
Place of birth for the foreign-born population - Other Northern Africa (%)
Place of birth for the foreign-born population - South Africa (%)
Place of birth for the foreign-born population - Other Southern Africa (%)
Place of birth for the foreign-born population - Cabo Verde (%)
Place of birth for the foreign-born population - Ghana (%)
Place of birth for the foreign-born population - Liberia (%)
Place of birth for the foreign-born population - Nigeria (%)
Place of birth for the foreign-born population - Senegal (%)
Place of birth for the foreign-born population - Sierra Leone (%)
Place of birth for the foreign-born population - Other Western Africa (%)
Place of birth for the foreign-born population - Australia (%)
Place of birth for the foreign-born population - New Zealand (%)
Place of birth for the foreign-born population - Fiji (%)
Place of birth for the foreign-born population - Micronesia (%)
Place of birth for the foreign-born population - Bahamas (%)
Place of birth for the foreign-born population - Barbados (%)
Place of birth for the foreign-born population - Cuba (%)
Place of birth for the foreign-born population - Dominica (%)
Place of birth for the foreign-born population - Dominican Republic (%)
Place of birth for the foreign-born population - Grenada (%)
Place of birth for the foreign-born population - Haiti (%)
Place of birth for the foreign-born population - Jamaica (%)
Place of birth for the foreign-born population - St. Vincent and the Grenadines (%)
Place of birth for the foreign-born population - Trinidad and Tobago (%)
Place of birth for the foreign-born population - West Indies (%)
Place of birth for the foreign-born population - Other Caribbean (%)
Place of birth for the foreign-born population - Belize (%)
Place of birth for the foreign-born population - Costa Rica (%)
Place of birth for the foreign-born population - El Salvador (%)
Place of birth for the foreign-born population - Guatemala (%)
Place of birth for the foreign-born population - Honduras (%)
Place of birth for the foreign-born population - Mexico (%)
Place of birth for the foreign-born population - Nicaragua (%)
Place of birth for the foreign-born population - Panama (%)
Place of birth for the foreign-born population - Other Central America (%)
Place of birth for the foreign-born population - Argentina (%)
Place of birth for the foreign-born population - Bolivia (%)
Place of birth for the foreign-born population - Brazil (%)
Place of birth for the foreign-born population - Chile (%)
Place of birth for the foreign-born population - Colombia (%)
Place of birth for the foreign-born population - Ecuador (%)
Place of birth for the foreign-born population - Guyana (%)
Place of birth for the foreign-born population - Peru (%)
Place of birth for the foreign-born population - Uruguay (%)
Place of birth for the foreign-born population - Venezuela (%)
Place of birth for the foreign-born population - Other South America (%)
Place of birth for the foreign-born population - Canada (%)
Place of birth for the foreign-born population - Other Northern America (%)
Place of birth for the foreign-born population - Other (%)
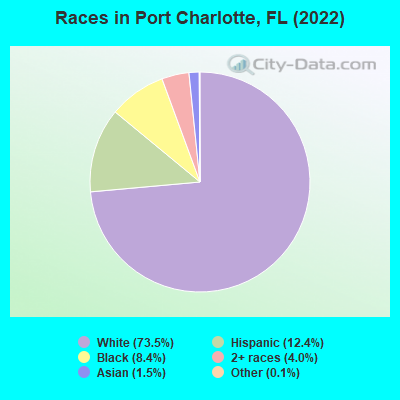
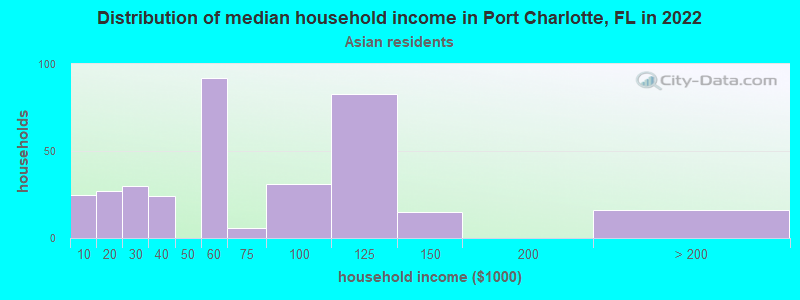
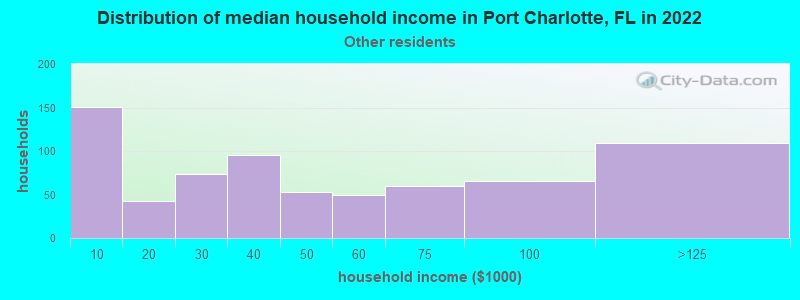
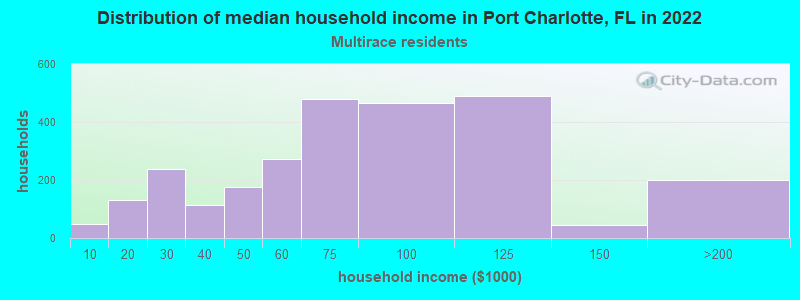
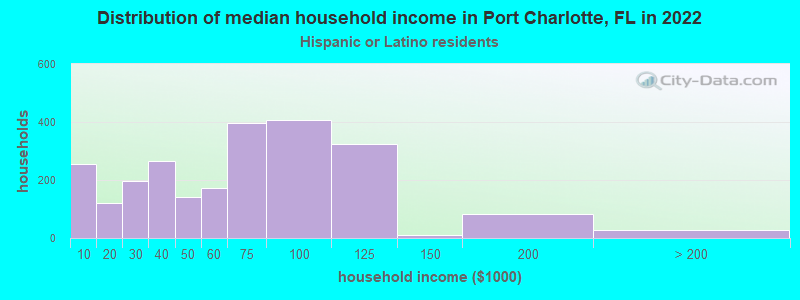
According to 2022 data, the most numerous races in Port Charlotte, FL are White alone (51,192 residents), Hispanic (8,659 residents), and Black alone (5,821 residents). 85.9% of Port Charlotte residents speak English at home. 12.2% of Port Charlotte, FL residents are foreign-born (7.9% born in Latin America, 2.2% born in Europe, 1.4% born in Asia), which is 72.7% less than the foreign-born rate of 21.0% across the entire state of Florida.
Race distribution in Port Charlotte
2000 2022
10,458,509 65.4% White alone 2,682,715 16.8% Hispanic 2,264,268 14.2% Black alone 261,693 1.6% Asian alone 236,954 1.5% Two or more races 42,358 0.3% American Indian alone 28,994 0.2% Other race alone 6,887 0.04% Native Hawaiian and Other
11,309,403 50.8% White alone 6,025,039 27.1% Hispanic 3,241,015 14.6% Black alone 861,630 3.9% Two or more races 623,692 2.8% Asian alone 152,054 0.7% Other race alone 22,504 0.1% American Indian alone 9,486 0.04% Native Hawaiian and Other
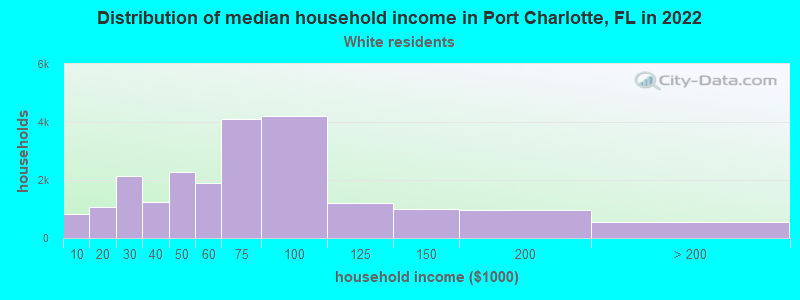
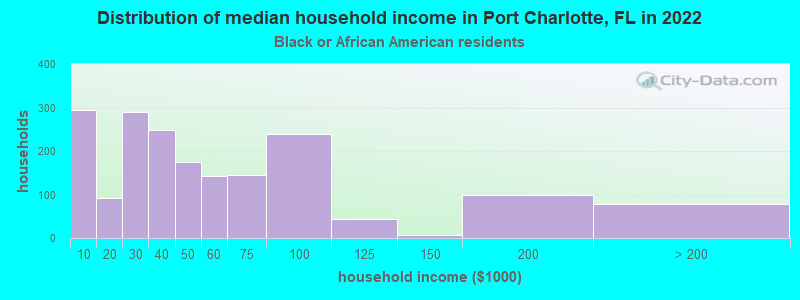
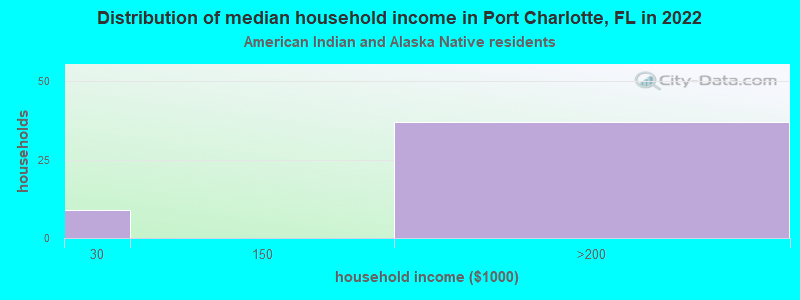
Income and house value in Port Charlotte Median household income in 2022 $65,021 White non-Hispanic householders$42,813 Black householders$77,966 Asian householders$40,908 Some other race householders$70,396 Two or more races householders$72,132 Hispanic or Latino race householdersMedian 2022 house value $275,145 White Non-Hispanic householders$290,810 Black or African American householders$226,790 American Indian or Alaska Native householders $345,294 Asian householders$297,961 Some other race householders$247,222 Two or more races householders$282,977 Hispanic or Latino householders
Median age by race in Port Charlotte
55.8 Median age for White residents51.8 57.6 33.3 Median age for Black or African American residents33.5 31.4 -666,666,666.0 Median age for American Indian / Alaska Native residents-666,666,666.0 -666,666,666.0 65.3 Median age for Asian residents72.9 62.4 -666,666,666.0 Median age for Native Hawaiian / Pacific Islander residents-666,666,666.0 -666,666,666.0 36.5 Median age for Other race residents69.4 36.4 36.8 Median age for Two or more races residents33.7 37.6 56.5 Median age for White alone residents53.0 57.7 36.6 Median age for Hispanic or Latino residents37.0 36.6
Owner/renter occupied households by race in Port Charlotte
House owners and renters - White residents 18,194 84.5% Owner occupied3,332 15.5% Renter occupiedHouse owners and renters - Black or African American residents 1,297 74.8% Owner occupied436 25.2% Renter occupiedHouse owners and renters - American Indian / Alaska Native residents 34 100.0% Owner occupiedHouse owners and renters - Asian residents 409 95.3% Owner occupied20 4.7% Renter occupiedHouse owners and renters - Native Hawaiian / Pacific Islander residents 9 19.7% Owner occupied38 80.3% Renter occupiedHouse owners and renters - Other race residents 387 55.4% Owner occupied311 44.6% Renter occupiedHouse owners and renters - Two or more races residents 2,338 80.7% Owner occupied558 19.3% Renter occupiedHouse owners and renters - White alone residents 17,851 84.6% Owner occupied3,260 15.4% Renter occupiedHouse owners and renters - Hispanic or Latino residents 2,440 85.6% Owner occupied412 14.4% Renter occupied
Language usage in Port Charlotte
English speakers - Total 85.9% of residents of Port Charlotte speak English at home.
9.1% of residents speak Spanish at home 4,651 76.7% Speak English very well1,411 23.3% Speak English less than very well5.0% of residents speak other language at home 2,685 80.9% Speak English very well634 19.1% Speak English less than very well
English speakers - Born in the United States 95.4% of residents of Port Charlotte speak English at home.
3.7% of residents speak Spanish at home 1,063 69.9% Speak English very well458 30.1% Speak English less than very well1.0% of residents speak other language at home 413 100.0% Speak English very well
English speakers - Native, born elsewhere 31.4% of residents of Port Charlotte speak English at home.
66.0% of residents speak Spanish at home 1,122 87.5% Speak English very well160 12.5% Speak English less than very well2.6% of residents speak other language at home 50 100.0% Speak English very well
English speakers - Foreign-born 48.0% of residents of Port Charlotte speak English at home.
21.6% of residents speak Spanish at home 1,101 58.1% Speak English very well793 41.9% Speak English less than very well30.4% of residents speak other language at home 2,040 76.3% Speak English very well634 23.7% Speak English less than very well
White (Caucasian) - Speak only English Native:
97.8% (46,983)Foreign-born:
52.9% (1,288)
White (Caucasian) - Speak another language Native:
2.2% (1,063)Foreign-born:
47.1% (1,147)
Black or African American - Speak only English Native:
86.5% (1,951)Foreign-born:
58.2% (1,412)
Black or African American - Speak another language Native:
13.6% (308)Foreign-born:
40.9% (991)
American Indian / Alaska Native - Speak another language Native:
30.8% (40)Foreign-born:
100.0% (63)
Asian - Speak only English Native:
63.9% (175)Foreign-born:
39.5% (322)
Asian - Speak another language Native:
18.6% (51)Foreign-born:
55.6% (452)
Other race - Speak only English Native:
39.9% (403)Foreign-born:
14.6% (136)
Other race - Speak another language Native:
60.3% (609)Foreign-born:
85.3% (793)
Two or more races - Speak only English Native:
54.9% (3,480)Foreign-born:
29.5% (739)
Two or more races - Speak another language Native:
45.1% (2,860)Foreign-born:
70.5% (1,768)
White alone - Speak only English Native:
98.9% (46,540)Foreign-born:
52.9% (1,288)
White alone - Speak another language Native:
1.1% (525)Foreign-born:
47.1% (1,147)
Hispanic or Latino - Speak only English Native:
32.0% (1,891)Foreign-born:
14.7% (326)
Hispanic or Latino - Speak another language Native:
68.0% (4,018)Foreign-born:
85.3% (1,894)
Foreign-born residents in Port Charlotte 8,292 residents are foreign born (7.9% Latin America , 2.2% Europe , 1.4% Asia ).
This city:
12.2%Florida:
21.1%
Marital status for residents in Port Charlotte Marital status - White (Caucasian) population 15 years and over
Males 31.9% Never married48.2% Now married0.4% Separated6.1% Widowed13.4% DivorcedFemales 24.2% Never married41.4% Now married1.5% Separated15.2% Widowed17.8% DivorcedWomen who gave birth in the past 12 months Now married:
22.4% (115)Unmarried:
77.6% (399)
Women who did not give birth in the past 12 months Now married:
33.3% (2,645)Unmarried:
66.7% (5,302)
Marital status - Black or African American population 15 years and over
Males 35.7% Never married46.6% Now married4.2% Separated0.6% Widowed12.8% DivorcedFemales 31.4% Never married40.1% Now married6.7% Separated10.2% Widowed11.6% DivorcedWomen who did not give birth in the past 12 months Now married:
33.4% (316)Unmarried:
66.6% (629)
Marital status - American Indian / Alaska Native population 15 years and over
Males 0.0% Never married17.5% Now married82.5% Separated0.0% Widowed0.0% DivorcedFemales 2.9% Never married91.3% Now married0.0% Separated0.0% Widowed5.8% DivorcedWomen who did not give birth in the past 12 months Now married:
91.3% (34)Unmarried:
8.7% (3)
Marital status - Asian population 15 years and over
Males 34.9% Never married25.3% Now married0.0% Separated26.5% Widowed13.4% DivorcedFemales 20.0% Never married44.2% Now married0.0% Separated21.3% Widowed14.5% DivorcedWomen who gave birth in the past 12 months Now married:
100.0% (14)Unmarried:
0.0% (0)
Women who did not give birth in the past 12 months Now married:
44.0% (98)Unmarried:
56.0% (125)
Marital status - Other race population 15 years and over
Males 4.0% Never married82.5% Now married9.2% Separated0.0% Widowed4.3% DivorcedFemales 40.6% Never married37.9% Now married0.9% Separated1.4% Widowed19.1% DivorcedWomen who gave birth in the past 12 months Now married:
100.0% (63)Unmarried:
0.0% (0)
Women who did not give birth in the past 12 months Now married:
34.1% (272)Unmarried:
65.9% (527)
Marital status - Two or more races population 15 years and over
Males 33.1% Never married38.2% Now married0.0% Separated0.0% Widowed28.7% DivorcedFemales 44.8% Never married36.9% Now married0.9% Separated3.2% Widowed14.2% DivorcedWomen who gave birth in the past 12 months Now married:
0.0% (0)Unmarried:
100.0% (124)
Women who did not give birth in the past 12 months Now married:
38.6% (533)Unmarried:
61.4% (848)
Marital status - White alone, not Hispanic / Latino population 15 years and over
Males 30.6% Never married49.0% Now married0.4% Separated6.3% Widowed13.8% DivorcedFemales 23.9% Never married41.6% Now married1.5% Separated15.4% Widowed17.7% DivorcedWomen who gave birth in the past 12 months Now married:
22.4% (115)Unmarried:
77.6% (399)
Women who did not give birth in the past 12 months Now married:
34.1% (2,645)Unmarried:
65.9% (5,116)
Marital status - Hispanic or Latino population 15 years and over
Males 35.0% Never married41.3% Now married0.0% Separated0.0% Widowed23.7% DivorcedFemales 43.5% Never married41.7% Now married0.0% Separated4.6% Widowed10.2% DivorcedWomen who gave birth in the past 12 months Now married:
50.4% (138)Unmarried:
49.6% (136)
Women who did not give birth in the past 12 months Now married:
40.3% (621)Unmarried:
59.7% (922)
Ancestries in Port Charlotte
6,863 20.2% American3,821 11.3% English3,382 10.0% German2,662 7.8% Italian2,054 6.0% Irish1,007 3.0% Jamaican827 2.4% Haitian760 2.2% Polish660 1.9% European422 1.2% West Indian358 1.1% Scottish353 1.0% Russian318 0.9% Dutch287 0.8% Scotch-Irish282 0.8% French Canadian251 0.7% French250 0.7% Guyanese184 0.5% Swedish168 0.5% Norwegian166 0.5% Czech158 0.5% British156 0.5% Canadian141 0.4% Cape Verdean113 0.3% Hungarian106 0.3% Palestinian103 0.3% Portuguese101 0.3% Greek81 0.2% Slovak78 0.2% Eastern European74 0.2% Latvian69 0.2% Iranian63 0.2% Welsh63 0.2% Barbadian62 0.2% Northern European59 0.2% Trinidadian and Tobagonian57 0.2% Belgian55 0.2% Scandinavian50 0.1% Serbian49 0.1% Danish49 0.1% Ukrainian40 0.1% Estonian39 0.1% Finnish35 0.1% Australian33 0.10% Maltese33 0.10% Czechoslovakian32 0.09% Nigerian31 0.09% Swiss27 0.08% Lithuanian22 0.06% Austrian15 0.04% Slovene14 0.04% British West Indian11 0.03% Lebanese6 0.02% Slavic3 0.01% Brazilian
Geographical mobility in Port Charlotte Same house 1 year ago 45,013 87.2% White (Caucasian)4,187 89.0% Black or African American204 100.0% American Indian / Alaska Native941 90.9% Asian43 100.0% Native Hawaiian / Pacific Islander1,575 76.6% Other race7,282 76.9% Two or more races44,495 87.9% White alone, not Hispanic / Latino6,666 81.0% Hispanic or LatinoMoved within same county 1,256 2.4% White / Caucasian254 5.4% Black or African American44 4.3% Asian319 15.5% Other race357 3.8% Two or more races1,256 2.5% White alone, not Hispanic / Latino251 3.1% Hispanic or LatinoMoved within same state 1,111 2.2% White / Caucasian194 4.1% Black or African American1 0.7% American Indian / Alaska Native12 1.1% Asian89 4.3% Other race725 7.7% Two or more races872 1.7% White alone, not Hispanic / Latino422 5.1% Hispanic or LatinoMoved from different state 4,172 8.1% White / Caucasian2 0.0% Black or African American1 0.6% American Indian / Alaska Native41 3.9% Asian5 0.2% Other race1,037 11.0% Two or more races3,948 7.8% White alone, not Hispanic / Latino886 10.8% Hispanic or LatinoMoved from abroad 70 0.1% White107 2.3% Black or African American5 0.3% Other race70 0.1% White alone, not Hispanic / Latino21 0.3% Hispanic or Latino
Children Nativity (place of birth) in Port Charlotte
Children under 6 years - Living with two parents Both parents native 1,003 100.0% NativeBoth parents foreign-born 354 100.0% NativeOne native, one foreign-born parent 112 100.0% NativeChildren under 6 years - Living with one parent Native parent 1,001 100.0% NativeForeign-born parent 185 100.0% NativeChildren 6 to 17 years - Living with two parents Both parents native 2,380 99.6% Native9 0.4% Foreign-bornBoth parents foreign-born 416 62.5% Native249 37.5% Foreign-bornOne native, one foreign-born parent 508 98.9% Native5 1.1% Foreign-bornChildren 6 to 17 years - Living with one parent Native parent 1,508 100.0% NativeForeign-born parent 467 55.4% Native376 44.6% Foreign-born
Grandparents responsible for own grandchildren in Port Charlotte
Grandparents (30 to 59 years) White / Caucasian 95 35.4% Responsible for grandchildren173 64.6% Not responsible for grandchildrenAmerican Indian / Alaska Native 33 100.0% Not responsible for grandchildrenTwo or more races 101 77.6% Responsible for grandchildren29 22.4% Not responsible for grandchildrenWhite alone, not Hispanic / Latino 95 31.0% Responsible for grandchildren211 69.0% Not responsible for grandchildrenHispanic or Latino 67 67.5% Responsible for grandchildren32 32.5% Not responsible for grandchildrenGrandparents (60 years and over) White / Caucasian 170 20.6% Responsible for grandchildren657 79.4% Not responsible for grandchildrenTwo or more races 116 100.0% Not responsible for grandchildrenWhite alone, not Hispanic / Latino 319 32.3% Responsible for grandchildren671 67.7% Not responsible for grandchildrenHispanic or Latino 18 19.3% Responsible for grandchildren74 80.7% Not responsible for grandchildren