Races in Oswego, Illinois (IL) Detailed Stats
Data:
Races - White alone (%)
Races - White alone (% change since 2000)
Races - Black alone (%)
Races - Black alone (% change since 2000)
Races - American Indian alone (%)
Races - American Indian alone (% change since 2000)
Races - Asian alone (%)
Races - Asian alone (% change since 2000)
Races - Hispanic (%)
Races - Hispanic (% change since 2000)
Races - Native Hawaiian and Other Pacific Islander alone (%)
Races - Native Hawaiian and Other Pacific Islander alone (% change since 2000)
Races - Two or more races(%)
Races - Two or more races(% change since 2000)
Races - Other race alone (%)
Races - Other race alone (% change since 2000)
Racial diversity
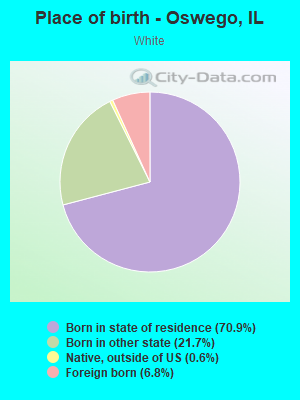
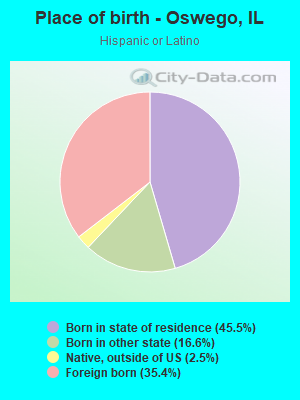
Place of birth - Born in state of residence (%)
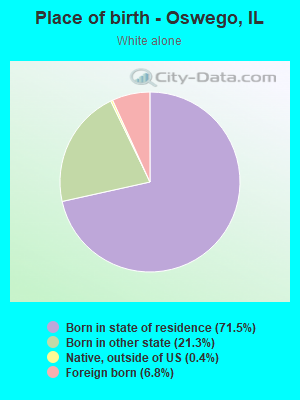
Place of birth - Born in state of residence (%) - White
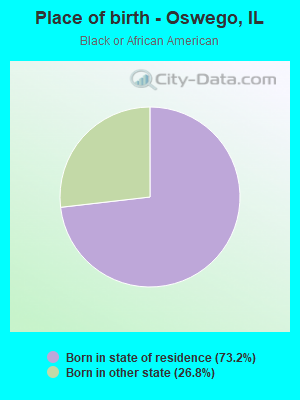
Place of birth - Born in state of residence (%) - Black or African American
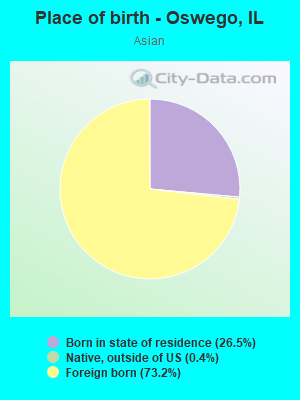
Place of birth - Born in state of residence (%) - Asian
Place of birth - Born in state of residence (%) - Hispanic or Latino
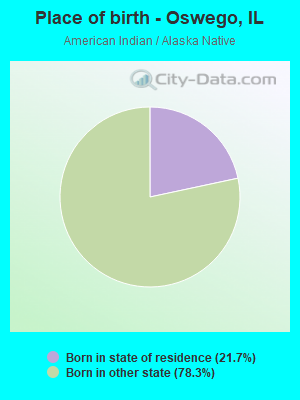
Place of birth - Born in state of residence (%) - American Indian and Alaska Native
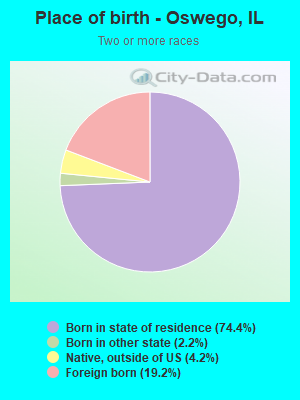
Place of birth - Born in state of residence (%) - Multirace
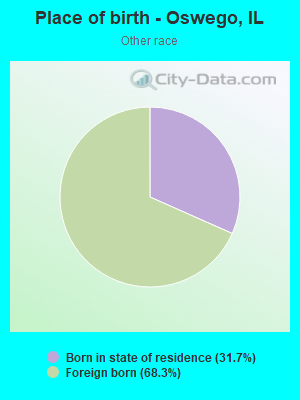
Place of birth - Born in state of residence (%) - Other Race
Place of birth - Born in other state (%)
Place of birth - Born in other state (%) - White
Place of birth - Born in other state (%) - Black or African American
Place of birth - Born in other state (%) - Asian
Place of birth - Born in other state (%) - Hispanic or Latino
Place of birth - Born in other state (%) - American Indian and Alaska Native
Place of birth - Born in other state (%) - Multirace
Place of birth - Born in other state (%) - Other Race
Place of birth - Native, outside of US (%)
Place of birth - Native, outside of US (%) - White
Place of birth - Native, outside of US (%) - Black or African American
Place of birth - Native, outside of US (%) - Asian
Place of birth - Native, outside of US (%) - Hispanic or Latino
Place of birth - Native, outside of US (%) - American Indian and Alaska Native
Place of birth - Native, outside of US (%) - Multirace
Place of birth - Native, outside of US (%) - Other Race
Place of birth - Foreign born (%)
Place of birth - Foreign born (%) - White
Place of birth - Foreign born (%) - Black or African American
Place of birth - Foreign born (%) - Asian
Place of birth - Foreign born (%) - Hispanic or Latino
Place of birth - Foreign born (%) - American Indian and Alaska Native
Place of birth - Foreign born (%) - Multirace
Place of birth - Foreign born (%) - Other Race
Residents speaking English at home (%)
Residents speaking English at home - Born in the United States (%)
Residents speaking English at home - Native, born elsewhere (%)
Residents speaking English at home - Foreign born (%)
Residents speaking Spanish at home (%)
Residents speaking Spanish at home - Born in the United States (%)
Residents speaking Spanish at home - Native, born elsewhere (%)
Residents speaking Spanish at home - Foreign born (%)
Residents speaking other language at home (%)
Residents speaking other language at home - Born in the United States (%)
Residents speaking other language at home - Native, born elsewhere (%)
Residents speaking other language at home - Foreign born (%)
Marital status - Never married (%)
Marital status - Now married (%)
Marital status - Separated (%)
Marital status - Widowed (%)
Marital status - Divorced (%)
Ancestries Reported - Arab (%)
Ancestries Reported - Czech (%)
Ancestries Reported - Danish (%)
Ancestries Reported - Dutch (%)
Ancestries Reported - English (%)
Ancestries Reported - French (%)
Ancestries Reported - French Canadian (%)
Ancestries Reported - German (%)
Ancestries Reported - Greek (%)
Ancestries Reported - Hungarian (%)
Ancestries Reported - Irish (%)
Ancestries Reported - Italian (%)
Ancestries Reported - Lithuanian (%)
Ancestries Reported - Norwegian (%)
Ancestries Reported - Polish (%)
Ancestries Reported - Portuguese (%)
Ancestries Reported - Russian (%)
Ancestries Reported - Scotch-Irish (%)
Ancestries Reported - Scottish (%)
Ancestries Reported - Slovak (%)
Ancestries Reported - Subsaharan African (%)
Ancestries Reported - Swedish (%)
Ancestries Reported - Swiss (%)
Ancestries Reported - Ukrainian (%)
Ancestries Reported - United States (%)
Ancestries Reported - Welsh (%)
Ancestries Reported - West Indian (%)
Ancestries Reported - Other (%)
Geographical mobility - Same house 1 year ago (%)
Geographical mobility - Same house 1 year ago (%) - White
Geographical mobility - Same house 1 year ago (%) - Black or African American
Geographical mobility - Same house 1 year ago (%) - Asian
Geographical mobility - Same house 1 year ago (%) - Hispanic or Latino
Geographical mobility - Same house 1 year ago (%) - American Indian and Alaska Native
Geographical mobility - Same house 1 year ago (%) - Multirace
Geographical mobility - Same house 1 year ago (%) - Other Race
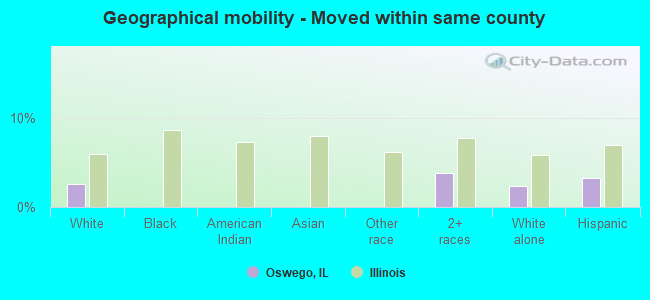
Geographical mobility - Moved within same county (%)
Geographical mobility - Moved within same county (%) - White
Geographical mobility - Moved within same county (%) - Black or African American
Geographical mobility - Moved within same county (%) - Asian
Geographical mobility - Moved within same county (%) - Hispanic or Latino
Geographical mobility - Moved within same county (%) - American Indian and Alaska Native
Geographical mobility - Moved within same county (%) - Multirace
Geographical mobility - Moved within same county (%) - Other Race
Geographical mobility - Moved from different county within same state (%)
Geographical mobility - Moved from different county within same state (%) - White
Geographical mobility - Moved from different county within same state (%) - Black or African American
Geographical mobility - Moved from different county within same state (%) - Asian
Geographical mobility - Moved from different county within same state (%) - Hispanic or Latino
Geographical mobility - Moved from different county within same state (%) - American Indian and Alaska Native
Geographical mobility - Moved from different county within same state (%) - Multirace
Geographical mobility - Moved from different county within same state (%) - Other Race
Geographical mobility - Moved from different state (%)
Geographical mobility - Moved from different state (%) - White
Geographical mobility - Moved from different state (%) - Black or African American
Geographical mobility - Moved from different state (%) - Asian
Geographical mobility - Moved from different state (%) - Hispanic or Latino
Geographical mobility - Moved from different state (%) - American Indian and Alaska Native
Geographical mobility - Moved from different state (%) - Multirace
Geographical mobility - Moved from different state (%) - Other Race
Geographical mobility - Moved from abroad (%)
Geographical mobility - Moved from abroad (%) - White
Geographical mobility - Moved from abroad (%) - Black or African American
Geographical mobility - Moved from abroad (%) - Asian
Geographical mobility - Moved from abroad (%) - Hispanic or Latino
Geographical mobility - Moved from abroad (%) - American Indian and Alaska Native
Geographical mobility - Moved from abroad (%) - Multirace
Geographical mobility - Moved from abroad (%) - Other Race
Place of birth for the foreign-born population - Ireland (%)
Place of birth for the foreign-born population - Denmark (%)
Place of birth for the foreign-born population - Norway (%)
Place of birth for the foreign-born population - Sweden (%)
Place of birth for the foreign-born population - United Kingdom (%)
Place of birth for the foreign-born population - England (%)
Place of birth for the foreign-born population - Scotland (%)
Place of birth for the foreign-born population - Other Northern Europe (%)
Place of birth for the foreign-born population - Austria (%)
Place of birth for the foreign-born population - Belgium (%)
Place of birth for the foreign-born population - France (%)
Place of birth for the foreign-born population - Germany (%)
Place of birth for the foreign-born population - Netherlands (%)
Place of birth for the foreign-born population - Switzerland (%)
Place of birth for the foreign-born population - Other Western Europe (%)
Place of birth for the foreign-born population - Greece (%)
Place of birth for the foreign-born population - Italy (%)
Place of birth for the foreign-born population - Portugal (%)
Place of birth for the foreign-born population - Spain (%)
Place of birth for the foreign-born population - Other Southern Europe (%)
Place of birth for the foreign-born population - Albania (%)
Place of birth for the foreign-born population - Belarus (%)
Place of birth for the foreign-born population - Bosnia and Herzegovina (%)
Place of birth for the foreign-born population - Bulgaria (%)
Place of birth for the foreign-born population - Croatia (%)
Place of birth for the foreign-born population - Czechoslovakia (%)
Place of birth for the foreign-born population - Hungary (%)
Place of birth for the foreign-born population - Latvia (%)
Place of birth for the foreign-born population - Lithuania (%)
Place of birth for the foreign-born population - North Macedonia (Macedonia) (%)
Place of birth for the foreign-born population - Moldova (%)
Place of birth for the foreign-born population - Poland (%)
Place of birth for the foreign-born population - Romania (%)
Place of birth for the foreign-born population - Russia (%)
Place of birth for the foreign-born population - Serbia (%)
Place of birth for the foreign-born population - Ukraine (%)
Place of birth for the foreign-born population - Other Eastern Europe (%)
Place of birth for the foreign-born population - China (%)
Place of birth for the foreign-born population - Hong Kong (%)
Place of birth for the foreign-born population - Taiwan (%)
Place of birth for the foreign-born population - Japan (%)
Place of birth for the foreign-born population - Korea (%)
Place of birth for the foreign-born population - Other Eastern Asia (%)
Place of birth for the foreign-born population - Afghanistan (%)
Place of birth for the foreign-born population - Bangladesh (%)
Place of birth for the foreign-born population - India (%)
Place of birth for the foreign-born population - Iran (%)
Place of birth for the foreign-born population - Kazakhstan (%)
Place of birth for the foreign-born population - Nepal (%)
Place of birth for the foreign-born population - Pakistan (%)
Place of birth for the foreign-born population - Sri Lanka (%)
Place of birth for the foreign-born population - Uzbekistan (%)
Place of birth for the foreign-born population - Other South Central Asia (%)
Place of birth for the foreign-born population - Burma (%)
Place of birth for the foreign-born population - Cambodia (%)
Place of birth for the foreign-born population - Indonesia (%)
Place of birth for the foreign-born population - Laos (%)
Place of birth for the foreign-born population - Malaysia (%)
Place of birth for the foreign-born population - Philippines (%)
Place of birth for the foreign-born population - Singapore (%)
Place of birth for the foreign-born population - Thailand (%)
Place of birth for the foreign-born population - Vietnam (%)
Place of birth for the foreign-born population - Other South Eastern Asia (%)
Place of birth for the foreign-born population - Armenia (%)
Place of birth for the foreign-born population - Iraq (%)
Place of birth for the foreign-born population - Israel (%)
Place of birth for the foreign-born population - Jordan (%)
Place of birth for the foreign-born population - Kuwait (%)
Place of birth for the foreign-born population - Lebanon (%)
Place of birth for the foreign-born population - Saudi Arabia (%)
Place of birth for the foreign-born population - Syria (%)
Place of birth for the foreign-born population - Turkey (%)
Place of birth for the foreign-born population - Yemen (%)
Place of birth for the foreign-born population - Other Western Asia (%)
Place of birth for the foreign-born population - Eritrea (%)
Place of birth for the foreign-born population - Ethiopia (%)
Place of birth for the foreign-born population - Kenya (%)
Place of birth for the foreign-born population - Somalia (%)
Place of birth for the foreign-born population - Uganda (%)
Place of birth for the foreign-born population - Zimbabwe (%)
Place of birth for the foreign-born population - Other Eastern Africa (%)
Place of birth for the foreign-born population - Cameroon (%)
Place of birth for the foreign-born population - Congo (%)
Place of birth for the foreign-born population - Democratic Republic of Congo (Zaire) (%)
Place of birth for the foreign-born population - Other Middle Africa (%)
Place of birth for the foreign-born population - Egypt (%)
Place of birth for the foreign-born population - Morocco (%)
Place of birth for the foreign-born population - Sudan (%)
Place of birth for the foreign-born population - Other Northern Africa (%)
Place of birth for the foreign-born population - South Africa (%)
Place of birth for the foreign-born population - Other Southern Africa (%)
Place of birth for the foreign-born population - Cabo Verde (%)
Place of birth for the foreign-born population - Ghana (%)
Place of birth for the foreign-born population - Liberia (%)
Place of birth for the foreign-born population - Nigeria (%)
Place of birth for the foreign-born population - Senegal (%)
Place of birth for the foreign-born population - Sierra Leone (%)
Place of birth for the foreign-born population - Other Western Africa (%)
Place of birth for the foreign-born population - Australia (%)
Place of birth for the foreign-born population - New Zealand (%)
Place of birth for the foreign-born population - Fiji (%)
Place of birth for the foreign-born population - Micronesia (%)
Place of birth for the foreign-born population - Bahamas (%)
Place of birth for the foreign-born population - Barbados (%)
Place of birth for the foreign-born population - Cuba (%)
Place of birth for the foreign-born population - Dominica (%)
Place of birth for the foreign-born population - Dominican Republic (%)
Place of birth for the foreign-born population - Grenada (%)
Place of birth for the foreign-born population - Haiti (%)
Place of birth for the foreign-born population - Jamaica (%)
Place of birth for the foreign-born population - St. Vincent and the Grenadines (%)
Place of birth for the foreign-born population - Trinidad and Tobago (%)
Place of birth for the foreign-born population - West Indies (%)
Place of birth for the foreign-born population - Other Caribbean (%)
Place of birth for the foreign-born population - Belize (%)
Place of birth for the foreign-born population - Costa Rica (%)
Place of birth for the foreign-born population - El Salvador (%)
Place of birth for the foreign-born population - Guatemala (%)
Place of birth for the foreign-born population - Honduras (%)
Place of birth for the foreign-born population - Mexico (%)
Place of birth for the foreign-born population - Nicaragua (%)
Place of birth for the foreign-born population - Panama (%)
Place of birth for the foreign-born population - Other Central America (%)
Place of birth for the foreign-born population - Argentina (%)
Place of birth for the foreign-born population - Bolivia (%)
Place of birth for the foreign-born population - Brazil (%)
Place of birth for the foreign-born population - Chile (%)
Place of birth for the foreign-born population - Colombia (%)
Place of birth for the foreign-born population - Ecuador (%)
Place of birth for the foreign-born population - Guyana (%)
Place of birth for the foreign-born population - Peru (%)
Place of birth for the foreign-born population - Uruguay (%)
Place of birth for the foreign-born population - Venezuela (%)
Place of birth for the foreign-born population - Other South America (%)
Place of birth for the foreign-born population - Canada (%)
Place of birth for the foreign-born population - Other Northern America (%)
Place of birth for the foreign-born population - Other (%)
Latest news about races in Oswego, IL collected exclusively by city-data.com from local newspapers, TV, and radio stations
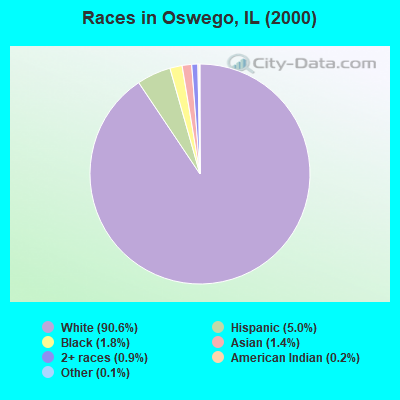
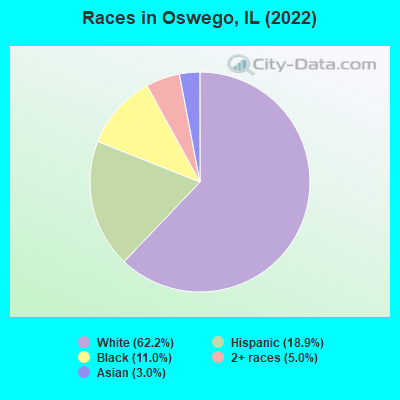
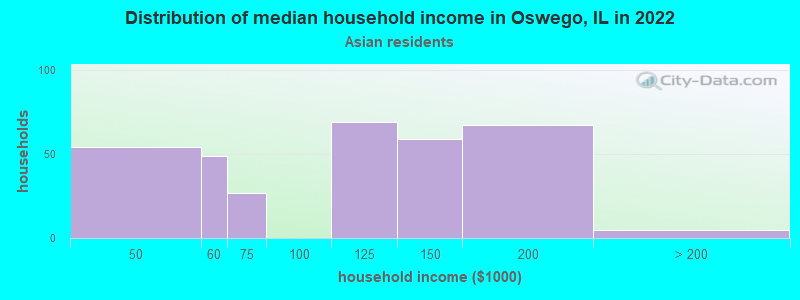
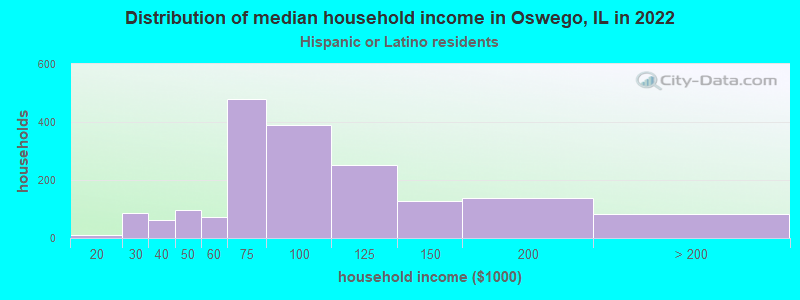
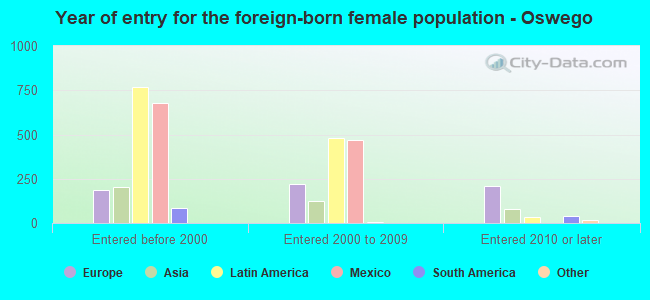
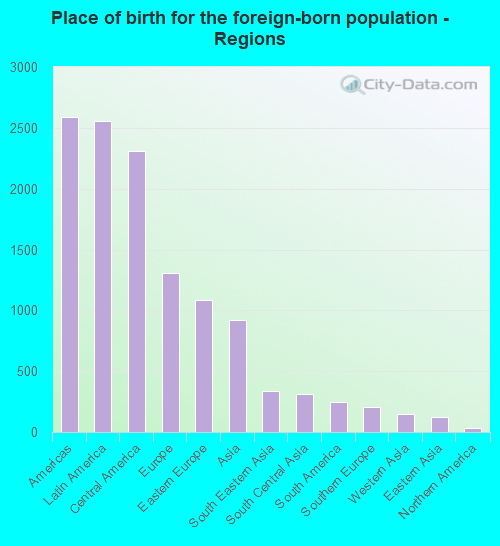
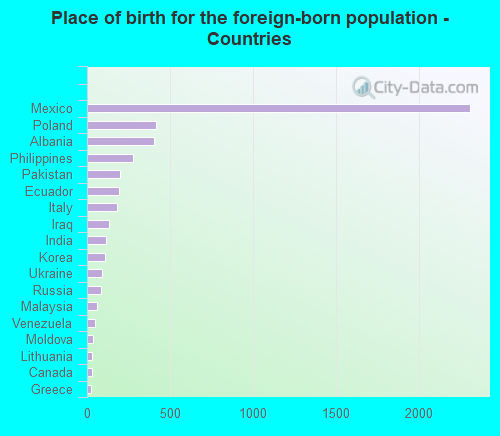
According to 2022 data, the most numerous races in Oswego, IL are White alone (22,377 residents), Hispanic (6,801 residents), and Black alone (3,943 residents). 76.8% of Oswego residents speak English at home. 13.4% of Oswego, IL residents are foreign-born (7.3% born in Latin America, 3.7% born in Europe, 2.6% born in Asia), which is 4.6% less than the foreign-born rate of 14.0% across the entire state of Illinois.
Race distribution in Oswego
2000 2022
8,424,140 67.8% White alone 1,856,152 14.9% Black alone 1,530,262 12.3% Hispanic 419,916 3.4% Asian alone 153,996 1.2% Two or more races 13,479 0.1% Other race alone 18,232 0.1% American Indian alone 3,116 0.03% Native Hawaiian and Other
7,356,301 58.5% White alone 2,299,726 18.3% Hispanic 1,660,423 13.2% Black alone 747,296 5.9% Asian alone 458,599 3.6% Two or more races 45,386 0.4% Other race alone 10,405 0.08% American Indian alone 3,896 0.03% Native Hawaiian and Other
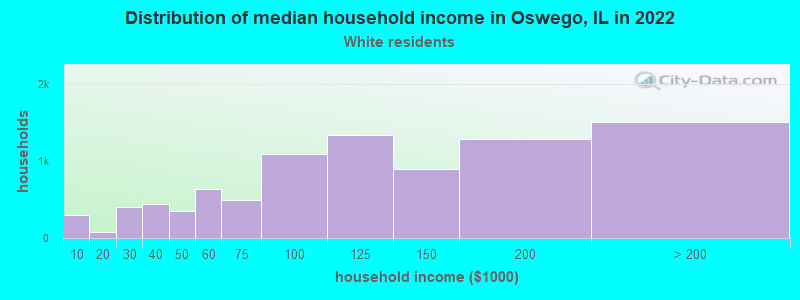
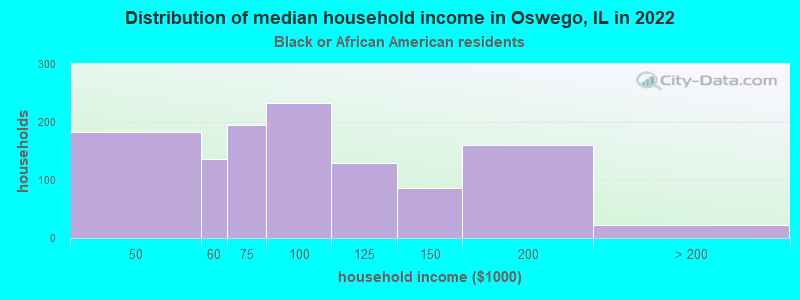
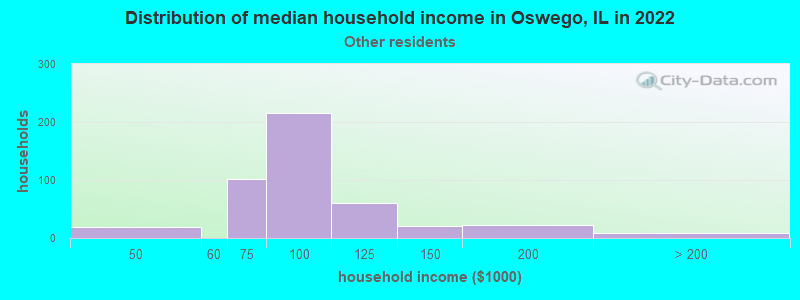
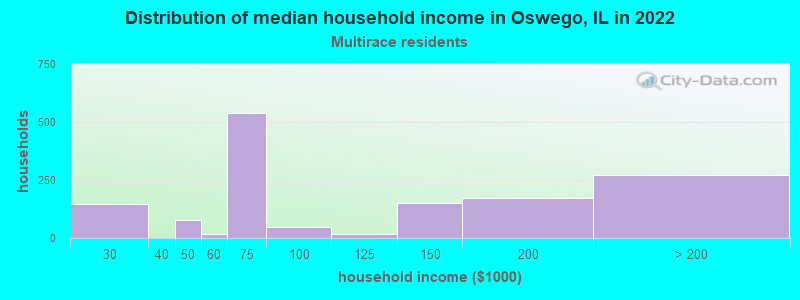
Income and house value in Oswego Median household income in 2022 $106,504 White non-Hispanic householders$96,689 Black householders$91,996 Asian householders$96,871 Some other race householders$83,264 Hispanic or Latino race householdersMedian 2022 house value $324,799 White Non-Hispanic householders$288,667 Black or African American householders$309,015 American Indian or Alaska Native householders $318,523 Asian householders$342,294 Some other race householders$389,834 Two or more races householders$338,300 Hispanic or Latino householders
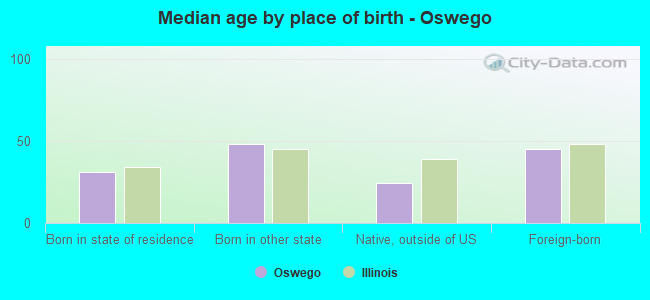
Median age by race in Oswego
42.9 Median age for White residents42.7 43.9 28.1 Median age for Black or African American residents21.3 28.4 61.0 Median age for American Indian / Alaska Native residents-720,238,094.5 60.5 40.8 Median age for Asian residents34.0 42.0 -666,666,666.0 Median age for Native Hawaiian / Pacific Islander residents-666,666,666.0 -666,666,666.0 28.6 Median age for Other race residents25.9 36.1 26.0 Median age for Two or more races residents33.4 24.2 43.4 Median age for White alone residents43.4 42.8 28.3 Median age for Hispanic or Latino residents25.7 30.7
Owner/renter occupied households by race in Oswego
House owners and renters - White residents 7,755 88.4% Owner occupied1,019 11.6% Renter occupiedHouse owners and renters - Black or African American residents 768 66.3% Owner occupied391 33.7% Renter occupiedHouse owners and renters - American Indian / Alaska Native residents 8 100.0% Owner occupiedHouse owners and renters - Asian residents 303 85.8% Owner occupied50 14.2% Renter occupiedHouse owners and renters - Other race residents 494 96.3% Owner occupied19 3.7% Renter occupiedHouse owners and renters - Two or more races residents 1,459 95.3% Owner occupied72 4.7% Renter occupiedHouse owners and renters - White alone residents 7,334 87.9% Owner occupied1,008 12.1% Renter occupiedHouse owners and renters - Hispanic or Latino residents 2,064 94.3% Owner occupied124 5.7% Renter occupied
Language usage in Oswego
English speakers - Total 76.8% of residents of Oswego speak English at home.
15.6% of residents speak Spanish at home 4,092 77.2% Speak English very well1,206 22.8% Speak English less than very well7.4% of residents speak other language at home 1,687 67.2% Speak English very well823 32.8% Speak English less than very well
English speakers - Born in the United States 89.4% of residents of Oswego speak English at home.
1.8% of residents speak Spanish at home 128 100.0% Speak English very well0.3% of residents speak other language at home 23 100.0% Speak English very well
All residents speak only English at home
English speakers - Foreign-born 8.1% of residents of Oswego speak English at home.
52.0% of residents speak Spanish at home 1,357 56.1% Speak English very well1,062 43.9% Speak English less than very well37.5% of residents speak other language at home 931 53.4% Speak English very well813 46.6% Speak English less than very well
White (Caucasian) - Speak only English Native:
94.5% (19,646)Foreign-born:
8.9% (138)
White (Caucasian) - Speak another language Native:
5.2% (1,077)Foreign-born:
85.5% (1,321)
Asian - Speak only English Native:
44.0% (67)Foreign-born:
36.5% (299)
Asian - Speak another language Native:
57.5% (88)Foreign-born:
68.5% (561)
Other race - Speak another language Native:
70.1% (253)Foreign-born:
100.0% (876)
Two or more races - Speak only English Native:
59.9% (2,808)Foreign-born:
3.6% (35)
Two or more races - Speak another language Native:
38.3% (1,794)Foreign-born:
95.9% (932)
White alone - Speak only English Native:
96.1% (19,085)Foreign-born:
9.6% (141)
White alone - Speak another language Native:
3.8% (751)Foreign-born:
89.6% (1,322)
Hispanic or Latino - Speak another language Native:
60.9% (2,423)Foreign-born:
100.0% (2,372)
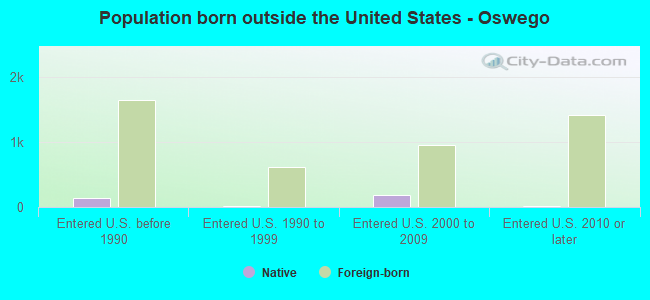
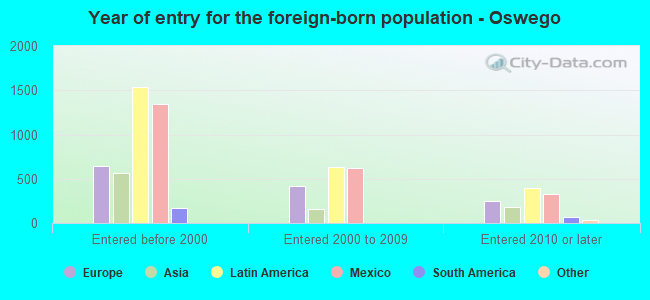
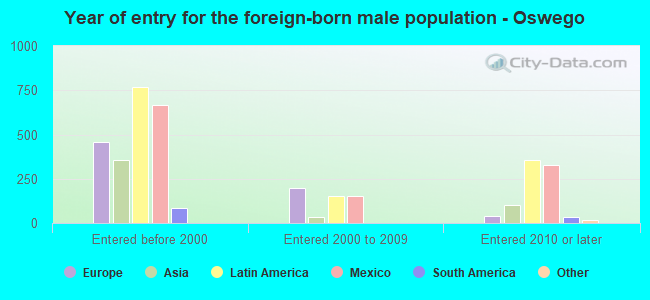
Foreign-born residents in Oswego 4,816 residents are foreign born (7.3% Latin America , 3.7% Europe , 2.6% Asia ).
This city:
13.4%Illinois:
14.1%
Marital status for residents in Oswego Marital status - White (Caucasian) population 15 years and over
Males 28.1% Never married60.7% Now married2.9% Separated1.4% Widowed6.9% DivorcedFemales 16.8% Never married62.7% Now married1.9% Separated8.1% Widowed10.4% DivorcedWomen who gave birth in the past 12 months Now married:
100.0% (267)Unmarried:
0.0% (0)
Women who did not give birth in the past 12 months Now married:
60.3% (3,041)Unmarried:
39.7% (2,003)
Marital status - Black or African American population 15 years and over
Males 38.9% Never married55.9% Now married0.0% Separated0.0% Widowed5.2% DivorcedFemales 57.3% Never married22.4% Now married11.1% Separated7.6% Widowed1.6% DivorcedWomen who gave birth in the past 12 months Now married:
100.0% (46)Unmarried:
0.0% (0)
Women who did not give birth in the past 12 months Now married:
15.3% (176)Unmarried:
84.7% (973)
Marital status - American Indian / Alaska Native population 15 years and over
Males 0.0% Never married0.0% Now married0.0% Separated0.0% Widowed100.0% DivorcedFemales 7.4% Never married8.6% Now married0.0% Separated0.0% Widowed84.0% DivorcedWomen who did not give birth in the past 12 months Now married:
100.0% (12)Unmarried:
0.0% (0)
Marital status - Asian population 15 years and over
Males 26.6% Never married58.9% Now married0.0% Separated0.0% Widowed14.5% DivorcedFemales 15.8% Never married84.2% Now married0.0% Separated0.0% Widowed0.0% DivorcedWomen who did not give birth in the past 12 months Now married:
71.4% (159)Unmarried:
28.6% (64)
Marital status - Other race population 15 years and over
Males 83.0% Never married17.0% Now married0.0% Separated0.0% Widowed0.0% DivorcedFemales 36.4% Never married57.1% Now married0.0% Separated0.0% Widowed6.4% DivorcedWomen who gave birth in the past 12 months Now married:
27.7% (21)Unmarried:
72.3% (55)
Women who did not give birth in the past 12 months Now married:
37.5% (38)Unmarried:
62.5% (64)
Marital status - Two or more races population 15 years and over
Males 36.0% Never married63.1% Now married0.0% Separated0.0% Widowed0.9% DivorcedFemales 56.0% Never married42.6% Now married0.0% Separated0.0% Widowed1.4% DivorcedWomen who did not give birth in the past 12 months Now married:
32.4% (685)Unmarried:
67.6% (1,428)
Marital status - White alone, not Hispanic / Latino population 15 years and over
Males 27.8% Never married60.3% Now married3.2% Separated1.5% Widowed7.2% DivorcedFemales 15.8% Never married63.6% Now married1.8% Separated8.1% Widowed10.8% DivorcedWomen who gave birth in the past 12 months Now married:
100.0% (274)Unmarried:
0.0% (0)
Women who did not give birth in the past 12 months Now married:
59.4% (2,724)Unmarried:
40.6% (1,865)
Marital status - Hispanic or Latino population 15 years and over
Males 48.3% Never married49.9% Now married0.0% Separated0.0% Widowed1.8% DivorcedFemales 43.5% Never married45.3% Now married1.0% Separated3.3% Widowed6.8% DivorcedWomen who gave birth in the past 12 months Now married:
37.3% (31)Unmarried:
62.7% (52)
Women who did not give birth in the past 12 months Now married:
44.9% (998)Unmarried:
55.1% (1,223)
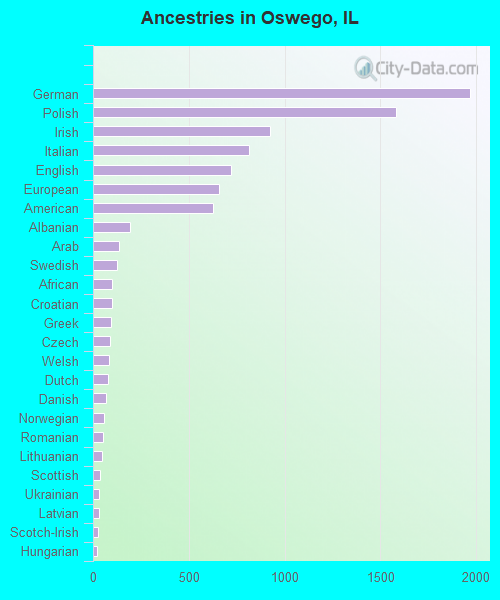
Ancestries in Oswego
1,968 12.3% German1,582 9.9% Polish923 5.7% Irish812 5.1% Italian722 4.5% English659 4.1% European626 3.9% American191 1.2% Albanian136 0.8% Arab123 0.8% Swedish101 0.6% African98 0.6% Croatian96 0.6% Greek91 0.6% Czech81 0.5% Welsh77 0.5% Dutch69 0.4% Danish59 0.4% Norwegian53 0.3% Romanian48 0.3% Lithuanian35 0.2% Scottish33 0.2% Ukrainian31 0.2% Latvian25 0.2% Scotch-Irish22 0.1% Hungarian22 0.1% Northern European18 0.1% Luxembourger18 0.1% Slovak15 0.09% British13 0.08% Canadian9 0.06% Finnish9 0.06% Russian8 0.05% Austrian
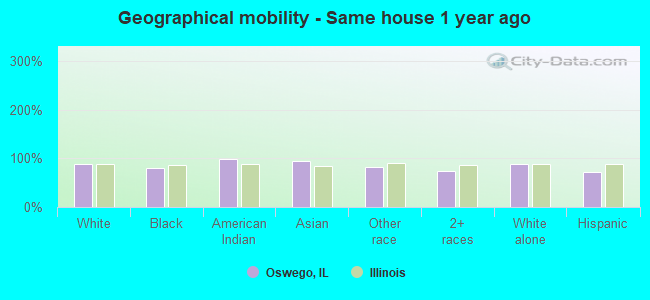
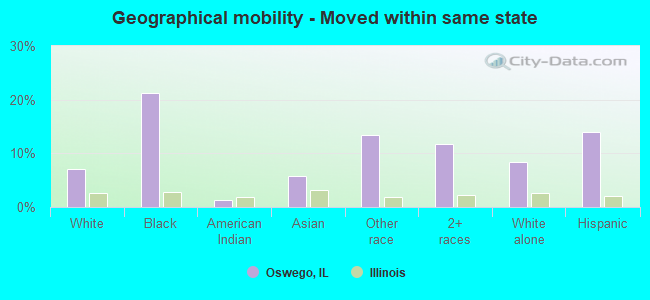
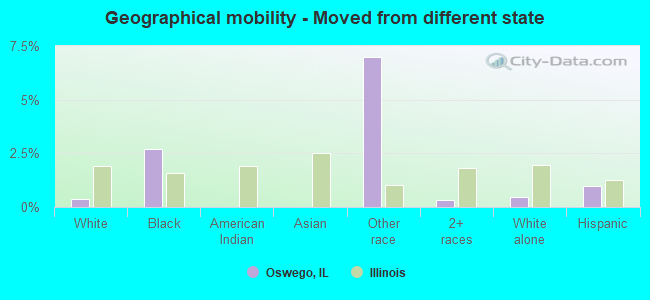
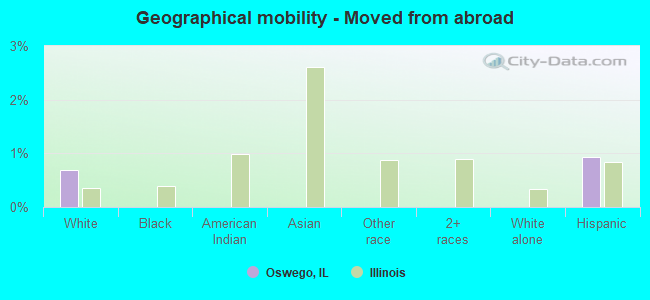
Geographical mobility in Oswego Same house 1 year ago 20,813 89.1% White (Caucasian)2,684 79.7% Black or African American133 98.6% American Indian / Alaska Native1,008 94.6% Asian956 82.7% Other race4,591 74.7% Two or more races19,730 88.8% White alone, not Hispanic / Latino4,855 72.2% Hispanic or LatinoMoved within same county 608 2.6% White / Caucasian234 3.8% Two or more races517 2.3% White alone, not Hispanic / Latino218 3.2% Hispanic or LatinoMoved within same state 1,672 7.2% White / Caucasian717 21.3% Black or African American2 1.3% American Indian / Alaska Native62 5.8% Asian156 13.5% Other race719 11.7% Two or more races1,876 8.4% White alone, not Hispanic / Latino940 14.0% Hispanic or LatinoMoved from different state 88 0.4% White / Caucasian91 2.7% Black or African American81 7.0% Other race20 0.3% Two or more races106 0.5% White alone, not Hispanic / Latino65 1.0% Hispanic or LatinoMoved from abroad 161 0.7% White62 0.9% Hispanic or Latino
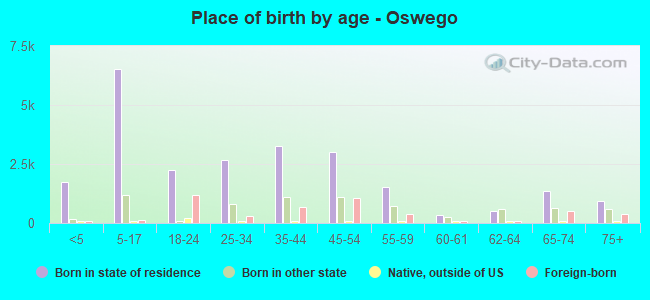
Children Nativity (place of birth) in Oswego
Children under 6 years - Living with two parents Both parents native 1,553 100.0% NativeBoth parents foreign-born 245 73.5% Native88 26.5% Foreign-bornOne native, one foreign-born parent 26 100.0% NativeChildren under 6 years - Living with one parent Native parent 342 100.0% NativeForeign-born parent 15 100.0% Foreign-bornChildren 6 to 17 years - Living with two parents Both parents native 3,904 97.7% Native93 2.3% Foreign-bornBoth parents foreign-born 507 87.6% Native72 12.4% Foreign-bornOne native, one foreign-born parent 310 100.0% NativeChildren 6 to 17 years - Living with one parent Native parent 1,734 100.0% NativeForeign-born parent 444 52.2% Native407 47.8% Foreign-born
Grandparents responsible for own grandchildren in Oswego
Grandparents (30 to 59 years) White / Caucasian 19 100.0% Not responsible for grandchildrenBlack or African American 13 100.0% Not responsible for grandchildrenWhite alone, not Hispanic / Latino 24 100.0% Not responsible for grandchildrenGrandparents (60 years and over) White / Caucasian 46 29.3% Responsible for grandchildren111 70.7% Not responsible for grandchildrenBlack or African American 71 100.0% Not responsible for grandchildrenWhite alone, not Hispanic / Latino 50 28.4% Responsible for grandchildren125 71.6% Not responsible for grandchildren