Races in Onion Creek, Texas (TX) Detailed Stats
Ancestries, Foreign-born residents, place of birth

Recent posts about races in Onion Creek, Texas on our local forum with over 2,400,000 registered users:
 | Good housing areas close to downtown (57 replies) |
| Tropical Storm Marco (72 replies) |
| Traffic since start of Covid 19? (59 replies) |
| thoughts about New Braunfels? (31 replies) |
| Retirees Moving from Houston to Austin -Need to Meet People (32 replies) |
| Family-friendly suburb with best commute to Capitol area? (20 replies) |
5.9% of Onion Creek, TX residents are foreign-born (3.2% born in Asia, 1.4% born in Europe, 0.6% born in Oceania), which is 190.1% less than the foreign-born rate of 17.0% across the entire state of Texas.
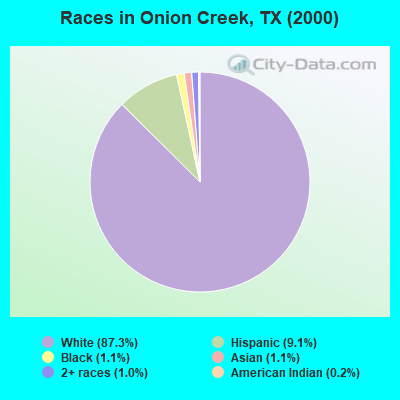
Race distribution in Onion Creek

- 1,84887.3%White alone
- 1939.1%Hispanic
- 231.1%Black alone
- 231.1%Asian alone
- 221.0%Two or more races
- 50.2%American Indian alone
- 20.09%Other race alone
2000
2022
-
- 10,933,31352.4%White alone
- 6,669,66632.0%Hispanic
- 2,364,25511.3%Black alone
- 554,4452.7%Asian alone
- 230,5671.1%Two or more races
- 68,8590.3%American Indian alone
- 19,9580.10%Other race alone
- 10,7570.05%Native Hawaiian and Other
Pacific Islander alone

-
- 12,070,64240.2%Hispanic
- 11,683,43038.9%White alone
- 3,508,70611.7%Black alone
- 1,608,1735.4%Asian alone
- 956,5603.2%Two or more races
- 125,7630.4%Other race alone
- 47,0230.2%American Indian alone
- 29,2750.10%Native Hawaiian and Other
Pacific Islander alone

Income and house value in Onion Creek
- Median household income in 2022
- $181,015White non-Hispanic householders
- $123,939Black householders
- over $200,000Asian householders
- $187,064Some other race householders
- over $200,000Two or more races householders
- over $200,000Hispanic or Latino race householders
- Median 2022 house value
- $950,518White Non-Hispanic householders
- over $1,000,000Black or African American householders
- over $1,000,000Asian householders
- over $1,000,000Some other race householders
- $730,995Two or more races householders
- over $1,000,000Hispanic or Latino householders
Household income for White non-Hispanic householders

Household income for Black householders

Household income for Asian householders

Household income for Two or more races householders

Household income for Hispanic or Latino race householders

Foreign-born residents in Onion Creek
124 residents are foreign born (3.2% Asia, 1.4% Europe, 0.6% Oceania).
| This city: | 5.9% |
| Texas: | 13.9% |
Ancestries in Onion Creek

- 40018.6%German
- 34916.2%English
- 34516.0%Other
- 31114.4%Irish
- 1527.1%United States
- 984.5%Scotch-Irish
- 874.0%Swedish
- 663.1%Polish
- 472.2%Danish
- 472.2%French Canadian
- 442.0%Czech
- 391.8%Scottish
- 361.7%Italian
- 241.1%Dutch
- 241.1%French
- 221.0%Norwegian
- 170.8%Welsh
- 160.7%Greek
- 160.7%Hungarian
- 90.4%Ukrainian
- 70.3%West Indian

Zip codes: 78747.