Races in Oakland, California (CA) Detailed Stats
Data:
Races - White alone (%)
Races - White alone (% change since 2000)
Races - Black alone (%)
Races - Black alone (% change since 2000)
Races - American Indian alone (%)
Races - American Indian alone (% change since 2000)
Races - Asian alone (%)
Races - Asian alone (% change since 2000)
Races - Hispanic (%)
Races - Hispanic (% change since 2000)
Races - Native Hawaiian and Other Pacific Islander alone (%)
Races - Native Hawaiian and Other Pacific Islander alone (% change since 2000)
Races - Two or more races(%)
Races - Two or more races(% change since 2000)
Races - Other race alone (%)
Races - Other race alone (% change since 2000)
Racial diversity
Place of birth - Born in state of residence (%)
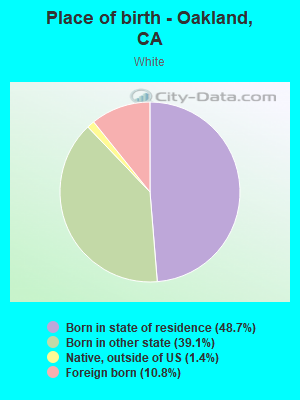
Place of birth - Born in state of residence (%) - White
Place of birth - Born in state of residence (%) - Black or African American
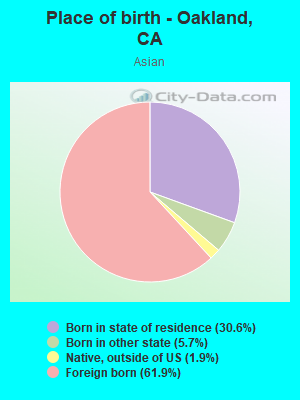
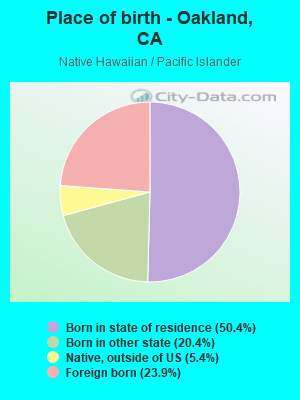
Place of birth - Born in state of residence (%) - Asian
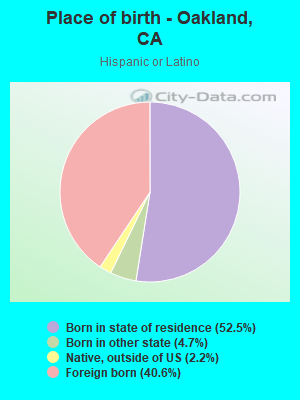
Place of birth - Born in state of residence (%) - Hispanic or Latino
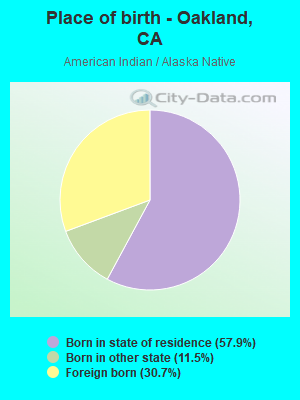
Place of birth - Born in state of residence (%) - American Indian and Alaska Native
Place of birth - Born in state of residence (%) - Multirace
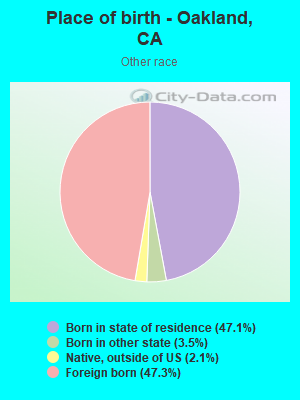
Place of birth - Born in state of residence (%) - Other Race
Place of birth - Born in other state (%)
Place of birth - Born in other state (%) - White
Place of birth - Born in other state (%) - Black or African American
Place of birth - Born in other state (%) - Asian
Place of birth - Born in other state (%) - Hispanic or Latino
Place of birth - Born in other state (%) - American Indian and Alaska Native
Place of birth - Born in other state (%) - Multirace
Place of birth - Born in other state (%) - Other Race
Place of birth - Native, outside of US (%)
Place of birth - Native, outside of US (%) - White
Place of birth - Native, outside of US (%) - Black or African American
Place of birth - Native, outside of US (%) - Asian
Place of birth - Native, outside of US (%) - Hispanic or Latino
Place of birth - Native, outside of US (%) - American Indian and Alaska Native
Place of birth - Native, outside of US (%) - Multirace
Place of birth - Native, outside of US (%) - Other Race
Place of birth - Foreign born (%)
Place of birth - Foreign born (%) - White
Place of birth - Foreign born (%) - Black or African American
Place of birth - Foreign born (%) - Asian
Place of birth - Foreign born (%) - Hispanic or Latino
Place of birth - Foreign born (%) - American Indian and Alaska Native
Place of birth - Foreign born (%) - Multirace
Place of birth - Foreign born (%) - Other Race
Residents speaking English at home (%)
Residents speaking English at home - Born in the United States (%)
Residents speaking English at home - Native, born elsewhere (%)
Residents speaking English at home - Foreign born (%)
Residents speaking Spanish at home (%)
Residents speaking Spanish at home - Born in the United States (%)
Residents speaking Spanish at home - Native, born elsewhere (%)
Residents speaking Spanish at home - Foreign born (%)
Residents speaking other language at home (%)
Residents speaking other language at home - Born in the United States (%)
Residents speaking other language at home - Native, born elsewhere (%)
Residents speaking other language at home - Foreign born (%)
Marital status - Never married (%)
Marital status - Now married (%)
Marital status - Separated (%)
Marital status - Widowed (%)
Marital status - Divorced (%)
Ancestries Reported - Arab (%)
Ancestries Reported - Czech (%)
Ancestries Reported - Danish (%)
Ancestries Reported - Dutch (%)
Ancestries Reported - English (%)
Ancestries Reported - French (%)
Ancestries Reported - French Canadian (%)
Ancestries Reported - German (%)
Ancestries Reported - Greek (%)
Ancestries Reported - Hungarian (%)
Ancestries Reported - Irish (%)
Ancestries Reported - Italian (%)
Ancestries Reported - Lithuanian (%)
Ancestries Reported - Norwegian (%)
Ancestries Reported - Polish (%)
Ancestries Reported - Portuguese (%)
Ancestries Reported - Russian (%)
Ancestries Reported - Scotch-Irish (%)
Ancestries Reported - Scottish (%)
Ancestries Reported - Slovak (%)
Ancestries Reported - Subsaharan African (%)
Ancestries Reported - Swedish (%)
Ancestries Reported - Swiss (%)
Ancestries Reported - Ukrainian (%)
Ancestries Reported - United States (%)
Ancestries Reported - Welsh (%)
Ancestries Reported - West Indian (%)
Ancestries Reported - Other (%)
Geographical mobility - Same house 1 year ago (%)
Geographical mobility - Same house 1 year ago (%) - White
Geographical mobility - Same house 1 year ago (%) - Black or African American
Geographical mobility - Same house 1 year ago (%) - Asian
Geographical mobility - Same house 1 year ago (%) - Hispanic or Latino
Geographical mobility - Same house 1 year ago (%) - American Indian and Alaska Native
Geographical mobility - Same house 1 year ago (%) - Multirace
Geographical mobility - Same house 1 year ago (%) - Other Race
Geographical mobility - Moved within same county (%)
Geographical mobility - Moved within same county (%) - White
Geographical mobility - Moved within same county (%) - Black or African American
Geographical mobility - Moved within same county (%) - Asian
Geographical mobility - Moved within same county (%) - Hispanic or Latino
Geographical mobility - Moved within same county (%) - American Indian and Alaska Native
Geographical mobility - Moved within same county (%) - Multirace
Geographical mobility - Moved within same county (%) - Other Race
Geographical mobility - Moved from different county within same state (%)
Geographical mobility - Moved from different county within same state (%) - White
Geographical mobility - Moved from different county within same state (%) - Black or African American
Geographical mobility - Moved from different county within same state (%) - Asian
Geographical mobility - Moved from different county within same state (%) - Hispanic or Latino
Geographical mobility - Moved from different county within same state (%) - American Indian and Alaska Native
Geographical mobility - Moved from different county within same state (%) - Multirace
Geographical mobility - Moved from different county within same state (%) - Other Race
Geographical mobility - Moved from different state (%)
Geographical mobility - Moved from different state (%) - White
Geographical mobility - Moved from different state (%) - Black or African American
Geographical mobility - Moved from different state (%) - Asian
Geographical mobility - Moved from different state (%) - Hispanic or Latino
Geographical mobility - Moved from different state (%) - American Indian and Alaska Native
Geographical mobility - Moved from different state (%) - Multirace
Geographical mobility - Moved from different state (%) - Other Race
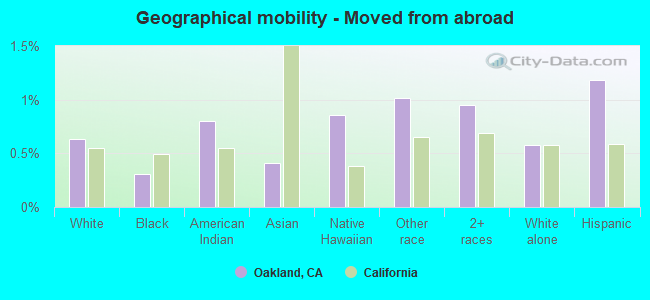
Geographical mobility - Moved from abroad (%)
Geographical mobility - Moved from abroad (%) - White
Geographical mobility - Moved from abroad (%) - Black or African American
Geographical mobility - Moved from abroad (%) - Asian
Geographical mobility - Moved from abroad (%) - Hispanic or Latino
Geographical mobility - Moved from abroad (%) - American Indian and Alaska Native
Geographical mobility - Moved from abroad (%) - Multirace
Geographical mobility - Moved from abroad (%) - Other Race
Place of birth for the foreign-born population - Ireland (%)
Place of birth for the foreign-born population - Denmark (%)
Place of birth for the foreign-born population - Norway (%)
Place of birth for the foreign-born population - Sweden (%)
Place of birth for the foreign-born population - United Kingdom (%)
Place of birth for the foreign-born population - England (%)
Place of birth for the foreign-born population - Scotland (%)
Place of birth for the foreign-born population - Other Northern Europe (%)
Place of birth for the foreign-born population - Austria (%)
Place of birth for the foreign-born population - Belgium (%)
Place of birth for the foreign-born population - France (%)
Place of birth for the foreign-born population - Germany (%)
Place of birth for the foreign-born population - Netherlands (%)
Place of birth for the foreign-born population - Switzerland (%)
Place of birth for the foreign-born population - Other Western Europe (%)
Place of birth for the foreign-born population - Greece (%)
Place of birth for the foreign-born population - Italy (%)
Place of birth for the foreign-born population - Portugal (%)
Place of birth for the foreign-born population - Spain (%)
Place of birth for the foreign-born population - Other Southern Europe (%)
Place of birth for the foreign-born population - Albania (%)
Place of birth for the foreign-born population - Belarus (%)
Place of birth for the foreign-born population - Bosnia and Herzegovina (%)
Place of birth for the foreign-born population - Bulgaria (%)
Place of birth for the foreign-born population - Croatia (%)
Place of birth for the foreign-born population - Czechoslovakia (%)
Place of birth for the foreign-born population - Hungary (%)
Place of birth for the foreign-born population - Latvia (%)
Place of birth for the foreign-born population - Lithuania (%)
Place of birth for the foreign-born population - North Macedonia (Macedonia) (%)
Place of birth for the foreign-born population - Moldova (%)
Place of birth for the foreign-born population - Poland (%)
Place of birth for the foreign-born population - Romania (%)
Place of birth for the foreign-born population - Russia (%)
Place of birth for the foreign-born population - Serbia (%)
Place of birth for the foreign-born population - Ukraine (%)
Place of birth for the foreign-born population - Other Eastern Europe (%)
Place of birth for the foreign-born population - China (%)
Place of birth for the foreign-born population - Hong Kong (%)
Place of birth for the foreign-born population - Taiwan (%)
Place of birth for the foreign-born population - Japan (%)
Place of birth for the foreign-born population - Korea (%)
Place of birth for the foreign-born population - Other Eastern Asia (%)
Place of birth for the foreign-born population - Afghanistan (%)
Place of birth for the foreign-born population - Bangladesh (%)
Place of birth for the foreign-born population - India (%)
Place of birth for the foreign-born population - Iran (%)
Place of birth for the foreign-born population - Kazakhstan (%)
Place of birth for the foreign-born population - Nepal (%)
Place of birth for the foreign-born population - Pakistan (%)
Place of birth for the foreign-born population - Sri Lanka (%)
Place of birth for the foreign-born population - Uzbekistan (%)
Place of birth for the foreign-born population - Other South Central Asia (%)
Place of birth for the foreign-born population - Burma (%)
Place of birth for the foreign-born population - Cambodia (%)
Place of birth for the foreign-born population - Indonesia (%)
Place of birth for the foreign-born population - Laos (%)
Place of birth for the foreign-born population - Malaysia (%)
Place of birth for the foreign-born population - Philippines (%)
Place of birth for the foreign-born population - Singapore (%)
Place of birth for the foreign-born population - Thailand (%)
Place of birth for the foreign-born population - Vietnam (%)
Place of birth for the foreign-born population - Other South Eastern Asia (%)
Place of birth for the foreign-born population - Armenia (%)
Place of birth for the foreign-born population - Iraq (%)
Place of birth for the foreign-born population - Israel (%)
Place of birth for the foreign-born population - Jordan (%)
Place of birth for the foreign-born population - Kuwait (%)
Place of birth for the foreign-born population - Lebanon (%)
Place of birth for the foreign-born population - Saudi Arabia (%)
Place of birth for the foreign-born population - Syria (%)
Place of birth for the foreign-born population - Turkey (%)
Place of birth for the foreign-born population - Yemen (%)
Place of birth for the foreign-born population - Other Western Asia (%)
Place of birth for the foreign-born population - Eritrea (%)
Place of birth for the foreign-born population - Ethiopia (%)
Place of birth for the foreign-born population - Kenya (%)
Place of birth for the foreign-born population - Somalia (%)
Place of birth for the foreign-born population - Uganda (%)
Place of birth for the foreign-born population - Zimbabwe (%)
Place of birth for the foreign-born population - Other Eastern Africa (%)
Place of birth for the foreign-born population - Cameroon (%)
Place of birth for the foreign-born population - Congo (%)
Place of birth for the foreign-born population - Democratic Republic of Congo (Zaire) (%)
Place of birth for the foreign-born population - Other Middle Africa (%)
Place of birth for the foreign-born population - Egypt (%)
Place of birth for the foreign-born population - Morocco (%)
Place of birth for the foreign-born population - Sudan (%)
Place of birth for the foreign-born population - Other Northern Africa (%)
Place of birth for the foreign-born population - South Africa (%)
Place of birth for the foreign-born population - Other Southern Africa (%)
Place of birth for the foreign-born population - Cabo Verde (%)
Place of birth for the foreign-born population - Ghana (%)
Place of birth for the foreign-born population - Liberia (%)
Place of birth for the foreign-born population - Nigeria (%)
Place of birth for the foreign-born population - Senegal (%)
Place of birth for the foreign-born population - Sierra Leone (%)
Place of birth for the foreign-born population - Other Western Africa (%)
Place of birth for the foreign-born population - Australia (%)
Place of birth for the foreign-born population - New Zealand (%)
Place of birth for the foreign-born population - Fiji (%)
Place of birth for the foreign-born population - Micronesia (%)
Place of birth for the foreign-born population - Bahamas (%)
Place of birth for the foreign-born population - Barbados (%)
Place of birth for the foreign-born population - Cuba (%)
Place of birth for the foreign-born population - Dominica (%)
Place of birth for the foreign-born population - Dominican Republic (%)
Place of birth for the foreign-born population - Grenada (%)
Place of birth for the foreign-born population - Haiti (%)
Place of birth for the foreign-born population - Jamaica (%)
Place of birth for the foreign-born population - St. Vincent and the Grenadines (%)
Place of birth for the foreign-born population - Trinidad and Tobago (%)
Place of birth for the foreign-born population - West Indies (%)
Place of birth for the foreign-born population - Other Caribbean (%)
Place of birth for the foreign-born population - Belize (%)
Place of birth for the foreign-born population - Costa Rica (%)
Place of birth for the foreign-born population - El Salvador (%)
Place of birth for the foreign-born population - Guatemala (%)
Place of birth for the foreign-born population - Honduras (%)
Place of birth for the foreign-born population - Mexico (%)
Place of birth for the foreign-born population - Nicaragua (%)
Place of birth for the foreign-born population - Panama (%)
Place of birth for the foreign-born population - Other Central America (%)
Place of birth for the foreign-born population - Argentina (%)
Place of birth for the foreign-born population - Bolivia (%)
Place of birth for the foreign-born population - Brazil (%)
Place of birth for the foreign-born population - Chile (%)
Place of birth for the foreign-born population - Colombia (%)
Place of birth for the foreign-born population - Ecuador (%)
Place of birth for the foreign-born population - Guyana (%)
Place of birth for the foreign-born population - Peru (%)
Place of birth for the foreign-born population - Uruguay (%)
Place of birth for the foreign-born population - Venezuela (%)
Place of birth for the foreign-born population - Other South America (%)
Place of birth for the foreign-born population - Canada (%)
Place of birth for the foreign-born population - Other Northern America (%)
Place of birth for the foreign-born population - Other (%)
Latest news about races in Oakland, CA collected exclusively by city-data.com from local newspapers, TV, and radio stations
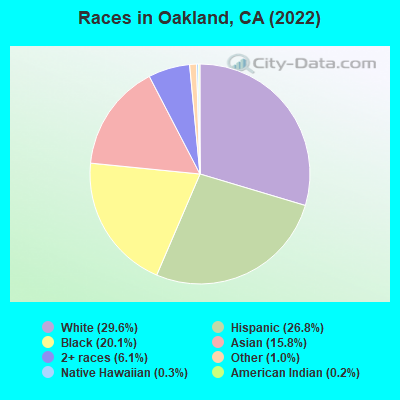
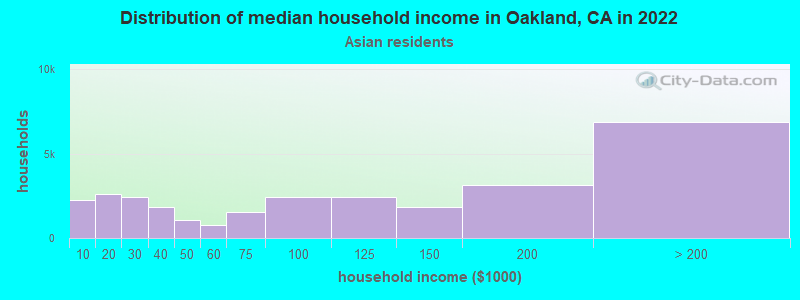
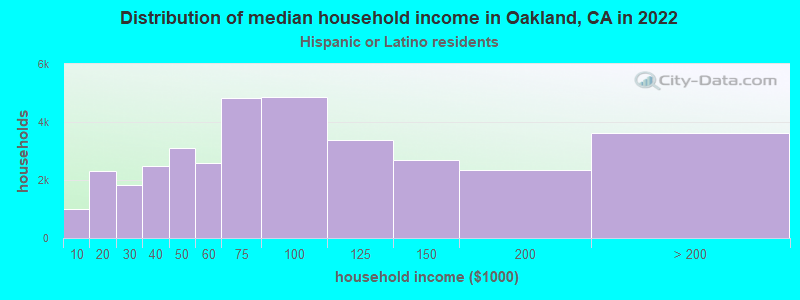
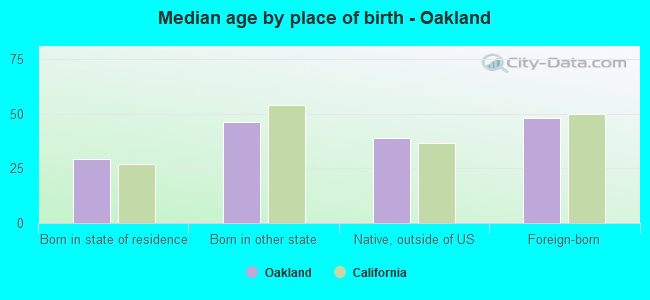
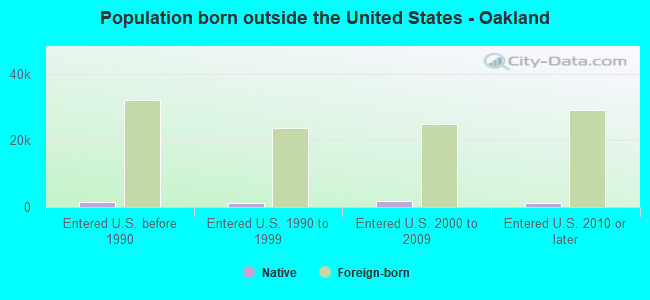
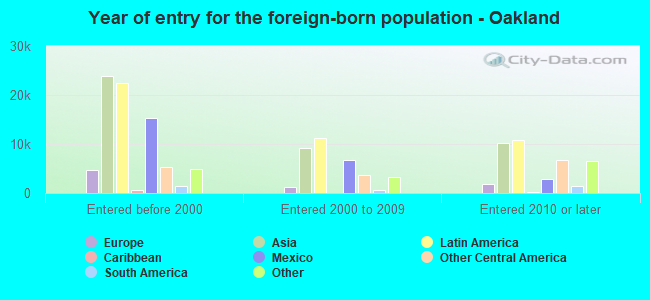
According to 2022 data, the most numerous races in Oakland, CA are Hispanic (118,309 residents), White alone (120,267 residents), and Asian alone (63,867 residents). 60.3% of Oakland residents speak English at home. 26.9% of Oakland, CA residents are foreign-born (11.9% born in Latin America, 10.8% born in Asia), which is 3.2% greater than the foreign-born rate of 26.0% across the entire state of California.
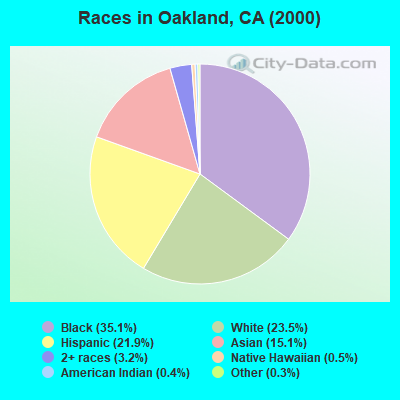
Race distribution in Oakland
2000 2022
140,139 35.1% Black alone 93,953 23.5% White alone 87,467 21.9% Hispanic 60,393 15.1% Asian alone 12,966 3.2% Two or more races 1,866 0.5% Native Hawaiian and Other 1,471 0.4% American Indian alone 1,229 0.3% Other race alone
120,267 27.7% White alone 118,309 27.3% Hispanic 102,414 23.6% Black alone 63,867 14.7% Asian alone 23,622 5.4% Two or more races 2,553 0.6% Other race alone 1,612 0.4% Native Hawaiian and Other 1,170 0.3% American Indian alone
2000 2022
15,816,790 46.7% White alone 10,966,556 32.4% Hispanic 3,648,860 10.8% Asian alone 2,181,926 6.4% Black alone 903,115 2.7% Two or more races 178,984 0.5% American Indian alone 103,736 0.3% Native Hawaiian and Other 71,681 0.2% Other race alone
15,732,184 40.3% Hispanic 13,160,426 33.7% White alone 5,957,867 15.3% Asian alone 2,025,218 5.2% Black alone 1,663,222 4.3% Two or more races 251,618 0.6% Other race alone 135,777 0.3% Native Hawaiian and Other 103,030 0.3% American Indian alone
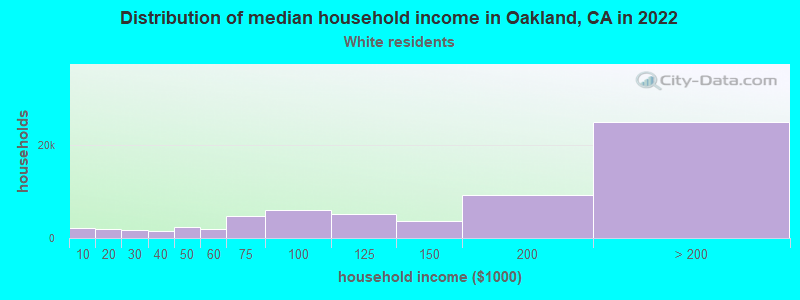
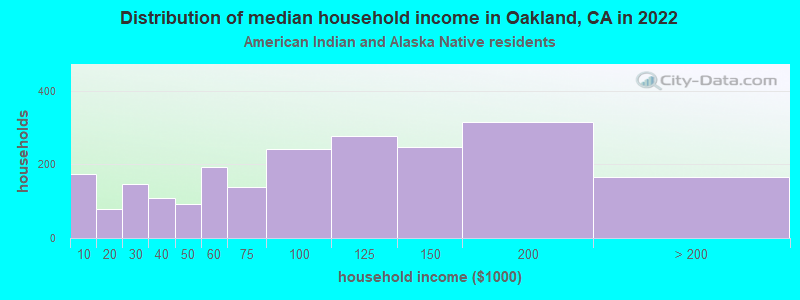
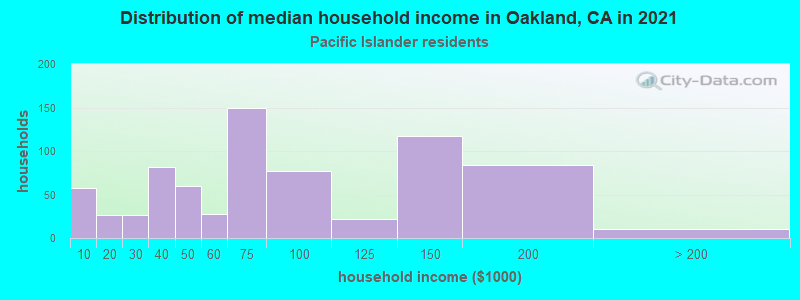
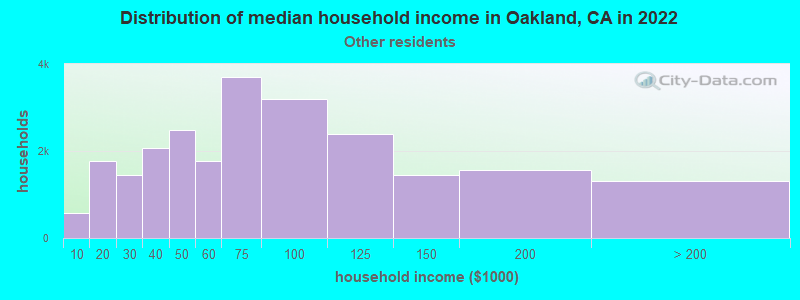
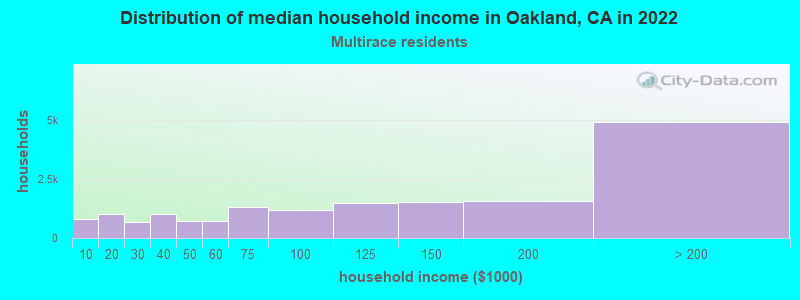
Income and house value in Oakland Median household income in 2022 $155,914 White non-Hispanic householders$55,842 Black householders$131,711 American Indian and Alaska Native householders$80,158 Asian householders$76,948 Native Hawaiian and other Pacific Islander householders$76,951 Some other race householders$103,317 Two or more races householders$85,911 Hispanic or Latino race householdersMedian 2022 house value over $1,000,000 White Non-Hispanic householders$615,479 Black or African American householders$592,804 American Indian or Alaska Native householders $762,330 Asian householders$594,243 Native Hawaiian and other Pacific Islander householders$510,740 Some other race householders$736,415 Two or more races householders$538,094 Hispanic or Latino householders
Median age by race in Oakland
40.6 Median age for White residents40.7 40.5 39.4 Median age for Black or African American residents38.4 40.4 25.1 Median age for American Indian / Alaska Native residents27.5 23.8 45.6 Median age for Asian residents44.8 46.6 49.1 Median age for Native Hawaiian / Pacific Islander residents55.3 49.4 31.1 Median age for Other race residents31.6 31.0 37.1 Median age for Two or more races residents37.6 35.9 40.5 Median age for White alone residents40.4 40.5 31.0 Median age for Hispanic or Latino residents31.7 30.4
Owner/renter occupied households by race in Oakland
House owners and renters - White residents 29,944 52.3% Owner occupied27,323 47.7% Renter occupiedHouse owners and renters - Black or African American residents 15,182 34.4% Owner occupied28,911 65.6% Renter occupiedHouse owners and renters - American Indian / Alaska Native residents 347 16.2% Owner occupied1,794 83.8% Renter occupiedHouse owners and renters - Asian residents 12,456 44.4% Owner occupied15,590 55.6% Renter occupiedHouse owners and renters - Native Hawaiian / Pacific Islander residents 268 45.2% Owner occupied325 54.8% Renter occupiedHouse owners and renters - Other race residents 8,010 32.5% Owner occupied16,617 67.5% Renter occupiedHouse owners and renters - Two or more races residents 10,706 41.4% Owner occupied15,177 58.6% Renter occupiedHouse owners and renters - White alone residents 30,034 52.7% Owner occupied26,988 47.3% Renter occupiedHouse owners and renters - Hispanic or Latino residents 10,957 33.4% Owner occupied21,863 66.6% Renter occupied
Language usage in Oakland
English speakers - Total 60.3% of residents of Oakland speak English at home.
21.4% of residents speak Spanish at home 49,490 57.6% Speak English very well36,374 42.4% Speak English less than very well18.4% of residents speak other language at home 37,268 50.5% Speak English very well36,513 49.5% Speak English less than very well
English speakers - Born in the United States 91.7% of residents of Oakland speak English at home.
4.3% of residents speak Spanish at home 3,192 85.9% Speak English very well526 14.1% Speak English less than very well4.0% of residents speak other language at home 3,004 87.1% Speak English very well444 12.9% Speak English less than very well
English speakers - Native, born elsewhere 50.8% of residents of Oakland speak English at home.
28.2% of residents speak Spanish at home 1,378 70.8% Speak English very well568 29.2% Speak English less than very well21.0% of residents speak other language at home 997 68.9% Speak English very well451 31.1% Speak English less than very well
English speakers - Foreign-born 12.6% of residents of Oakland speak English at home.
39.6% of residents speak Spanish at home 13,818 31.2% Speak English very well30,481 68.8% Speak English less than very well47.9% of residents speak other language at home 20,429 38.1% Speak English very well33,206 61.9% Speak English less than very well
White (Caucasian) - Speak only English Native:
92.7% (94,848)Foreign-born:
43.5% (5,770)
White (Caucasian) - Speak another language Native:
9.6% (9,872)Foreign-born:
64.2% (8,501)
Black or African American - Speak only English Native:
96.6% (83,913)Foreign-born:
37.7% (4,344)
Black or African American - Speak another language Native:
3.3% (2,899)Foreign-born:
62.3% (7,176)
American Indian / Alaska Native - Speak only English Native:
49.8% (2,486)Foreign-born:
3.1% (70)
American Indian / Alaska Native - Speak another language Native:
59.3% (2,961)Foreign-born:
97.0% (2,189)
Asian - Speak only English Native:
63.1% (15,572)Foreign-born:
16.6% (6,437)
Asian - Speak another language Native:
37.2% (9,182)Foreign-born:
84.0% (32,624)
Native Hawaiian / Pacific Islander - Speak only English Native:
33.4% (243)Foreign-born:
42.7% (409)
Native Hawaiian / Pacific Islander - Speak another language Native:
62.0% (451)Foreign-born:
62.7% (600)
Other race - Speak only English Native:
29.0% (14,007)Foreign-born:
6.4% (2,425)
Other race - Speak another language Native:
70.7% (34,173)Foreign-born:
93.8% (35,279)
Two or more races - Speak only English Native:
64.7% (34,585)Foreign-born:
14.4% (1,929)
Two or more races - Speak another language Native:
34.0% (18,197)Foreign-born:
81.0% (10,846)
White alone - Speak only English Native:
91.9% (92,775)Foreign-born:
44.9% (5,855)
White alone - Speak another language Native:
8.2% (8,284)Foreign-born:
54.8% (7,144)
Hispanic or Latino - Speak only English Native:
39.0% (27,018)Foreign-born:
5.4% (2,214)
Hispanic or Latino - Speak another language Native:
60.7% (42,053)Foreign-born:
94.5% (38,489)
Foreign-born residents in Oakland 115,397 residents are foreign born (11.9% Latin America , 10.8% Asia ).
This city:
26.9%California:
100.0%
Marital status for residents in Oakland Marital status - White (Caucasian) population 15 years and over
Males 40.2% Never married47.5% Now married1.0% Separated1.3% Widowed10.0% DivorcedFemales 42.6% Never married39.9% Now married2.3% Separated4.7% Widowed10.4% DivorcedWomen who gave birth in the past 12 months Now married:
83.1% (1,296)Unmarried:
16.9% (263)
Women who did not give birth in the past 12 months Now married:
38.6% (12,371)Unmarried:
61.4% (19,713)
Marital status - Black or African American population 15 years and over
Males 56.0% Never married29.5% Now married2.7% Separated2.9% Widowed8.9% DivorcedFemales 49.9% Never married23.5% Now married3.6% Separated7.4% Widowed15.6% DivorcedWomen who gave birth in the past 12 months Now married:
19.1% (260)Unmarried:
80.9% (1,104)
Women who did not give birth in the past 12 months Now married:
24.2% (5,870)Unmarried:
75.8% (18,411)
Marital status - American Indian / Alaska Native population 15 years and over
Males 34.0% Never married46.4% Now married2.3% Separated0.0% Widowed17.3% DivorcedFemales 27.3% Never married41.4% Now married0.0% Separated16.1% Widowed15.2% DivorcedWomen who gave birth in the past 12 months Now married:
77.8% (83)Unmarried:
22.2% (24)
Women who did not give birth in the past 12 months Now married:
46.6% (712)Unmarried:
53.4% (816)
Marital status - Asian population 15 years and over
Males 39.3% Never married49.1% Now married1.3% Separated3.0% Widowed7.3% DivorcedFemales 36.8% Never married41.6% Now married1.6% Separated11.4% Widowed8.6% DivorcedWomen who gave birth in the past 12 months Now married:
89.7% (273)Unmarried:
10.3% (31)
Women who did not give birth in the past 12 months Now married:
38.5% (6,675)Unmarried:
61.5% (10,662)
Marital status - Native Hawaiian / Pacific Islander population 15 years and over
Males 21.9% Never married57.1% Now married4.4% Separated4.2% Widowed12.5% DivorcedFemales 25.0% Never married57.1% Now married4.1% Separated0.8% Widowed13.0% DivorcedWomen who gave birth in the past 12 months Now married:
64.6% (39)Unmarried:
35.4% (21)
Women who did not give birth in the past 12 months Now married:
53.6% (312)Unmarried:
46.4% (270)
Marital status - Other race population 15 years and over
Males 47.3% Never married45.7% Now married1.7% Separated0.9% Widowed4.3% DivorcedFemales 38.6% Never married47.9% Now married4.7% Separated2.9% Widowed5.9% DivorcedWomen who gave birth in the past 12 months Now married:
58.2% (537)Unmarried:
41.8% (386)
Women who did not give birth in the past 12 months Now married:
48.3% (12,620)Unmarried:
51.7% (13,494)
Marital status - Two or more races population 15 years and over
Males 62.5% Never married31.2% Now married2.8% Separated0.0% Widowed3.5% DivorcedFemales 60.7% Never married25.1% Now married2.0% Separated3.0% Widowed9.1% DivorcedWomen who gave birth in the past 12 months Now married:
62.9% (1,041)Unmarried:
37.1% (614)
Women who did not give birth in the past 12 months Now married:
21.0% (4,682)Unmarried:
79.0% (17,576)
Marital status - White alone, not Hispanic / Latino population 15 years and over
Males 38.3% Never married49.5% Now married0.7% Separated1.3% Widowed10.2% DivorcedFemales 42.3% Never married39.3% Now married2.2% Separated5.1% Widowed11.2% DivorcedWomen who gave birth in the past 12 months Now married:
80.0% (964)Unmarried:
20.0% (242)
Women who did not give birth in the past 12 months Now married:
37.9% (12,339)Unmarried:
62.1% (20,225)
Marital status - Hispanic or Latino population 15 years and over
Males 48.2% Never married43.3% Now married2.1% Separated1.2% Widowed5.2% DivorcedFemales 42.0% Never married45.2% Now married3.8% Separated2.7% Widowed6.4% DivorcedWomen who gave birth in the past 12 months Now married:
70.6% (1,141)Unmarried:
29.4% (476)
Women who did not give birth in the past 12 months Now married:
44.6% (14,929)Unmarried:
55.4% (18,510)
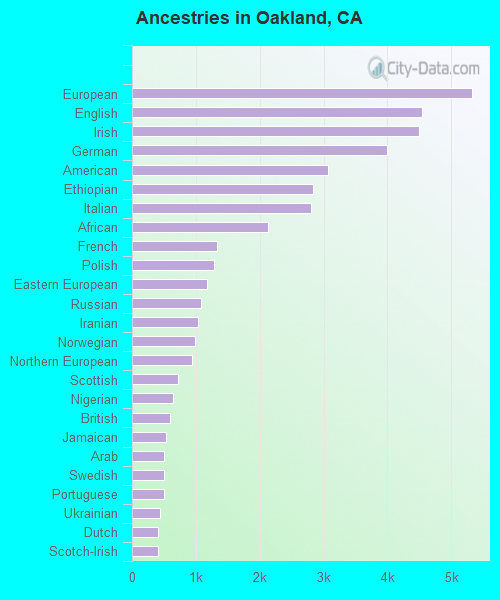
Ancestries in Oakland
6,925 2.8% European5,116 2.1% Ethiopian4,077 1.6% American3,982 1.6% African3,422 1.4% Irish3,150 1.3% German3,022 1.2% Italian3,003 1.2% English1,439 0.6% Eastern European1,293 0.5% Nigerian1,190 0.5% Northern European1,009 0.4% Polish962 0.4% Iranian959 0.4% Russian929 0.4% British791 0.3% French744 0.3% Scottish729 0.3% Arab589 0.2% Jamaican547 0.2% Greek490 0.2% Norwegian482 0.2% Brazilian434 0.2% Scotch-Irish426 0.2% Dutch374 0.2% Portuguese337 0.1% Swedish325 0.1% Ukrainian321 0.1% Armenian310 0.1% Afghan271 0.1% Scandinavian243 0.10% French Canadian239 0.10% Danish221 0.09% Haitian198 0.08% West Indian192 0.08% Canadian191 0.08% Hungarian178 0.07% Kenyan171 0.07% Syrian164 0.07% Swiss159 0.06% Sudanese140 0.06% Australian135 0.05% Welsh134 0.05% Czech130 0.05% Egyptian125 0.05% Ghanaian124 0.05% Turkish123 0.05% Israeli121 0.05% Lebanese116 0.05% Belgian115 0.05% Iraqi114 0.05% Finnish104 0.04% Jordanian99 0.04% Serbian94 0.04% Basque92 0.04% Croatian87 0.04% Slavic83 0.03% Slovene78 0.03% Yugoslavian74 0.03% Ugandan73 0.03% Romanian72 0.03% Austrian72 0.03% Bulgarian72 0.03% Trinidadian and Tobagonian68 0.03% Latvian56 0.02% Barbadian55 0.02% Slovak46 0.02% Celtic41 0.02% Liberian41 0.02% Moroccan39 0.02% Macedonian36 0.01% Icelander36 0.01% Cape Verdean34 0.01% Belizean33 0.01% British West Indian31 0.01% Czechoslovakian31 0.01% Sierra Leonean31 0.01% Cypriot30 0.01% German Russian29 0.01% Somali28 0.01% South African27 0.01% Palestinian26 0.01% Guyanese25 0.01% Lithuanian23 0.01% Cajun17 0.01% New Zealander
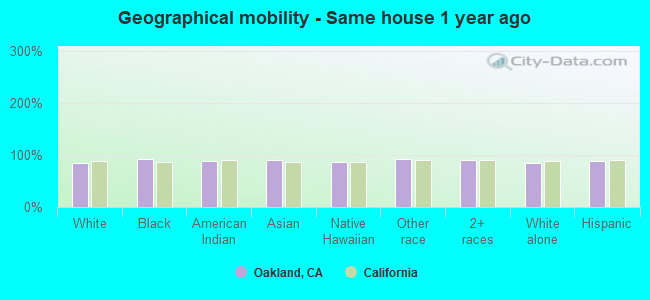
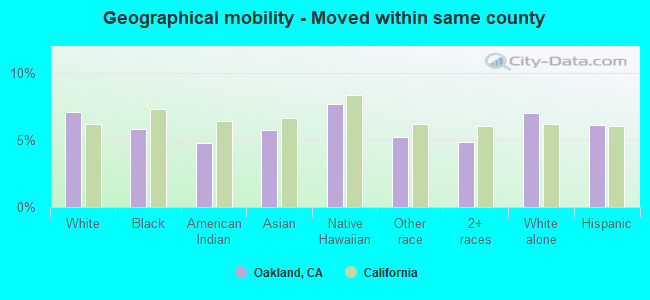
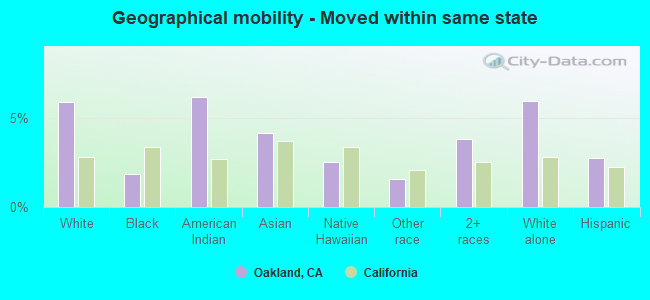
Geographical mobility in Oakland Same house 1 year ago 100,915 84.7% White (Caucasian)95,124 91.8% Black or African American4,644 89.6% American Indian / Alaska Native57,873 89.8% Asian2,042 86.7% Native Hawaiian / Pacific Islander84,118 92.1% Other race70,973 89.8% Two or more races94,918 84.2% White alone, not Hispanic / Latino102,681 89.2% Hispanic or LatinoMoved within same county 8,401 7.0% White / Caucasian6,013 5.8% Black or African American245 4.7% American Indian / Alaska Native3,717 5.8% Asian180 7.6% Native Hawaiian / Pacific Islander4,772 5.2% Other race3,840 4.9% Two or more races7,936 7.0% White alone, not Hispanic / Latino7,033 6.1% Hispanic or LatinoMoved within same state 7,002 5.9% White / Caucasian1,935 1.9% Black or African American318 6.1% American Indian / Alaska Native2,666 4.1% Asian60 2.5% Native Hawaiian / Pacific Islander1,434 1.6% Other race2,985 3.8% Two or more races6,709 5.9% White alone, not Hispanic / Latino3,133 2.7% Hispanic or LatinoMoved from different state 2,254 1.9% White / Caucasian870 0.8% Black or African American8 0.2% American Indian / Alaska Native374 0.6% Asian49 2.1% Native Hawaiian / Pacific Islander351 0.4% Other race689 0.9% Two or more races2,492 2.2% White alone, not Hispanic / Latino914 0.8% Hispanic or LatinoMoved from abroad 758 0.6% White317 0.3% Black or African American42 0.8% American Indian / Alaska Native267 0.4% Asian20 0.9% Native Hawaiian / Pacific Islander928 1.0% Other race749 0.9% Two or more races655 0.6% White alone, not Hispanic / Latino1,366 1.2% Hispanic or Latino
Children Nativity (place of birth) in Oakland
Children under 6 years - Living with two parents Both parents native 9,812 100.0% NativeBoth parents foreign-born 5,008 91.9% Native439 8.1% Foreign-bornOne native, one foreign-born parent 4,030 100.0% NativeChildren under 6 years - Living with one parent Native parent 7,842 97.1% Native232 2.9% Foreign-bornForeign-born parent 925 100.0% NativeChildren 6 to 17 years - Living with two parents Both parents native 11,105 100.0% NativeBoth parents foreign-born 10,186 83.4% Native2,034 16.6% Foreign-bornOne native, one foreign-born parent 7,247 100.0% NativeChildren 6 to 17 years - Living with one parent Native parent 13,217 100.0% NativeForeign-born parent 6,026 53.9% Native5,145 46.1% Foreign-born
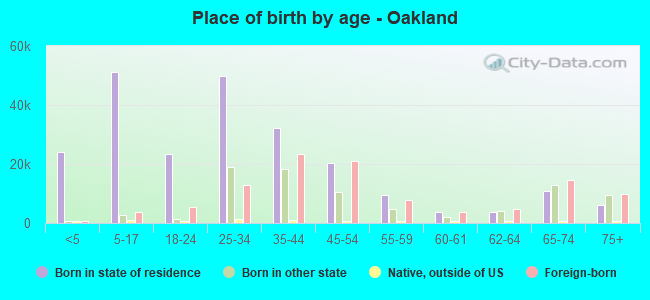
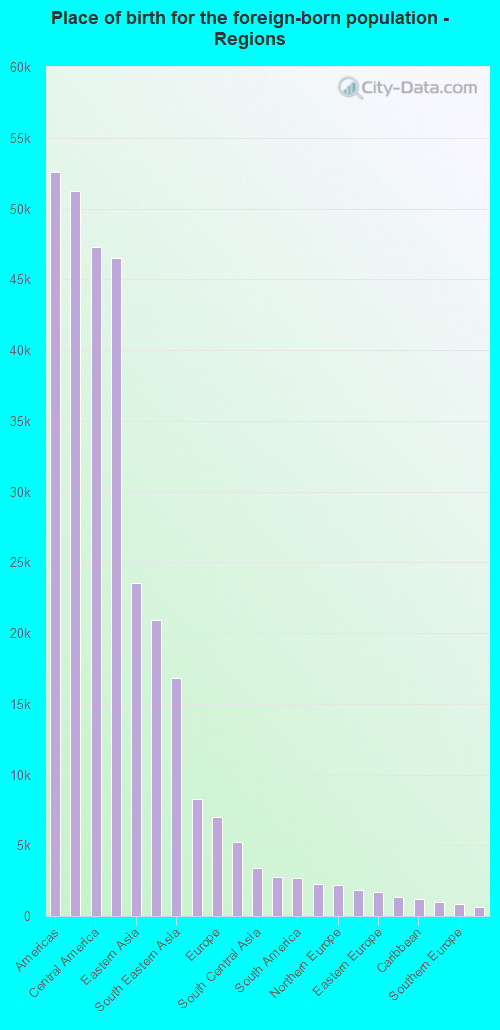
Place of birth for residents in Oakland 52,590 Americas51,216 Latin America47,302 Central America46,524 Asia23,545 Eastern Asia20,943 China16,811 South Eastern Asia8,263 Africa7,018 Europe5,224 Eastern Africa3,370 South Central Asia2,726 Western Asia2,695 South America2,270 Western Europe2,188 Northern Europe1,808 Western Africa1,693 Eastern Europe1,373 Northern America1,218 Caribbean1,001 Oceania845 Southern Europe624 Northern Africa403 Australia and New Zealand Subregion290 Middle Africa72 Southern Africa33,234 Mexico17,639 China8,683 Vietnam6,300 Guatemala6,203 El Salvador4,092 Philippines2,380 Eritrea2,368 Hong Kong2,202 Ethiopia1,689 Yemen1,458 India1,408 Korea1,348 Canada1,110 Thailand1,000 Cambodia941 France940 Germany935 Taiwan921 United Kingdom905 Nigeria886 Iran873 Laos698 Honduras681 Peru654 Brazil626 England617 Japan529 Nicaragua490 Colombia436 Jamaica426 Russia381 Fiji376 Italy364 Kenya343 Burma333 Afghanistan330 Indonesia330 Cuba286 Argentina276 Ireland275 Liberia264 Australia262 Israel250 Sri Lanka247 Chile239 Malaysia216 Spain203 Sudan189 Syria183 Democratic Republic of Congo (Zaire)180 Sierra Leone170 Pakistan160 Bosnia and Herzegovina156 Poland154 Saudi Arabia154 Trinidad and Tobago148 Panama148 Netherlands138 Singapore138 New Zealand135 Venezuela130 Ukraine127 Portugal125 Dominican Republic121 Bangladesh120 Ecuador119 Azores Islands119 Ghana116 Belize114 Greece114 Czechoslovakia106 Morocco105 Turkey102 Uganda101 Iraq99 Belgium94 Moldova92 Armenia91 Sweden91 Romania86 Bulgaria85 Hungary82 Haiti80 Denmark74 Scotland72 Switzerland72 South Africa66 Austria62 Costa Rica57 Nepal54 Cameroon52 Congo52 Senegal47 Belarus43 Egypt43 Barbados42 Serbia40 Guyana38 Jordan35 Zimbabwe29 Lebanon26 Norway23 Latvia20 Somalia19 Kuwait15 Croatia15 Uruguay14 Kazakhstan13 Bahamas12 Bolivia11 North Macedonia (Macedonia)8 Uzbekistan6 Albania4 West Indies4 Dominica
Grandparents responsible for own grandchildren in Oakland
Grandparents (30 to 59 years) White / Caucasian 129 45.4% Responsible for grandchildren155 54.6% Not responsible for grandchildrenBlack or African American 325 34.6% Responsible for grandchildren614 65.4% Not responsible for grandchildrenAmerican Indian / Alaska Native 17 56.3% Responsible for grandchildren14 43.7% Not responsible for grandchildrenAsian 63 24.8% Responsible for grandchildren193 75.2% Not responsible for grandchildrenNative Hawaiian / Pacific Islander 86 100.0% Not responsible for grandchildrenOther race 337 26.6% Responsible for grandchildren931 73.4% Not responsible for grandchildrenTwo or more races 145 18.4% Responsible for grandchildren642 81.6% Not responsible for grandchildrenWhite alone, not Hispanic / Latino 26 21.4% Responsible for grandchildren94 78.6% Not responsible for grandchildrenHispanic or Latino 367 23.9% Responsible for grandchildren1,167 76.1% Not responsible for grandchildrenGrandparents (60 years and over) White / Caucasian 98 14.5% Responsible for grandchildren577 85.5% Not responsible for grandchildrenBlack or African American 1,074 56.9% Responsible for grandchildren815 43.1% Not responsible for grandchildrenAmerican Indian / Alaska Native 32 14.6% Responsible for grandchildren190 85.4% Not responsible for grandchildrenAsian 331 25.6% Responsible for grandchildren961 74.4% Not responsible for grandchildrenOther race 624 35.8% Responsible for grandchildren1,119 64.2% Not responsible for grandchildrenTwo or more races 216 25.1% Responsible for grandchildren642 74.9% Not responsible for grandchildrenWhite alone, not Hispanic / Latino 81 10.8% Responsible for grandchildren666 89.2% Not responsible for grandchildrenHispanic or Latino 531 29.1% Responsible for grandchildren1,294 70.9% Not responsible for grandchildren
Zip codes: 94601 , 94602 , 94603 , 94605 , 94606 , 94607 , 94610 , 94611 , 94612 , 94613 , 94619 , 94621 .