Races in North Hopkins-Sulphur Bluff, Texas (TX) Detailed Stats
Ancestries, Foreign-born residents, place of birth
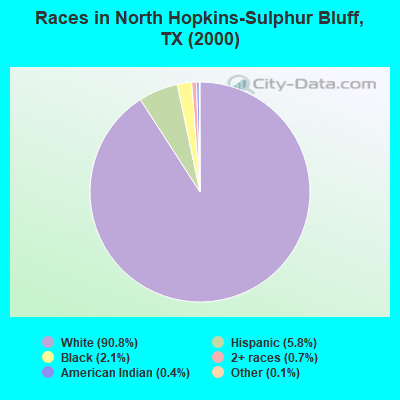
Race distribution in North Hopkins-Sulphur Bluff

- 2,36490.8%White alone
- 1525.8%Hispanic
- 552.1%Black alone
- 180.7%Two or more races
- 110.4%American Indian alone
- 30.1%Other race alone
- 10.04%Asian alone
2000
2022
-
- 10,933,31352.4%White alone
- 6,669,66632.0%Hispanic
- 2,364,25511.3%Black alone
- 554,4452.7%Asian alone
- 230,5671.1%Two or more races
- 68,8590.3%American Indian alone
- 19,9580.10%Other race alone
- 10,7570.05%Native Hawaiian and Other
Pacific Islander alone

-
- 12,070,64240.2%Hispanic
- 11,683,43038.9%White alone
- 3,508,70611.7%Black alone
- 1,608,1735.4%Asian alone
- 956,5603.2%Two or more races
- 125,7630.4%Other race alone
- 47,0230.2%American Indian alone
- 29,2750.10%Native Hawaiian and Other
Pacific Islander alone

Income and house value in North Hopkins-Sulphur Bluff
- Median household income in 2022
- $66,480White non-Hispanic householders
- $53,462Black householders
- $115,400American Indian and Alaska Native householders
- $55,847Some other race householders
- $133,587Two or more races householders
- $49,086Hispanic or Latino race householders
- Median 2022 house value
- $155,808White Non-Hispanic householders
- $178,530Black or African American householders
- $178,530American Indian or Alaska Native householders
Household income for White non-Hispanic householders

Household income for Black householders

Household income for American Indian and Alaska Native householders

Household income for Two or more races householders

Household income for Hispanic or Latino race householders

Zip code: 75437