Races in New City, New York (NY) Detailed Stats
Data:
Races - White alone (%)
Races - White alone (% change since 2000)
Races - Black alone (%)
Races - Black alone (% change since 2000)
Races - American Indian alone (%)
Races - American Indian alone (% change since 2000)
Races - Asian alone (%)
Races - Asian alone (% change since 2000)
Races - Hispanic (%)
Races - Hispanic (% change since 2000)
Races - Native Hawaiian and Other Pacific Islander alone (%)
Races - Native Hawaiian and Other Pacific Islander alone (% change since 2000)
Races - Two or more races(%)
Races - Two or more races(% change since 2000)
Races - Other race alone (%)
Races - Other race alone (% change since 2000)
Racial diversity
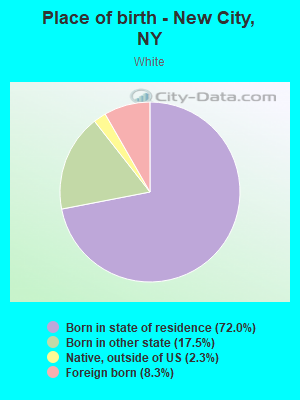
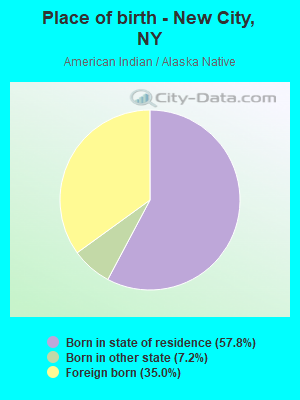
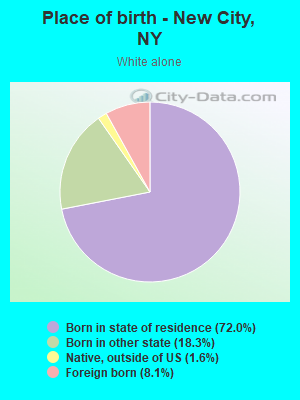
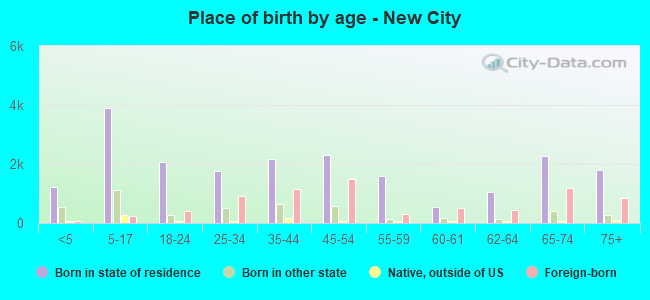
Place of birth - Born in state of residence (%)
Place of birth - Born in state of residence (%) - White
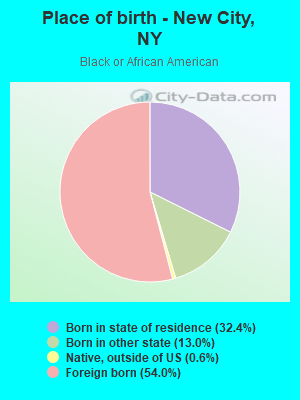
Place of birth - Born in state of residence (%) - Black or African American
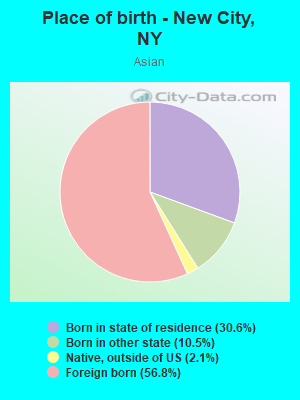
Place of birth - Born in state of residence (%) - Asian
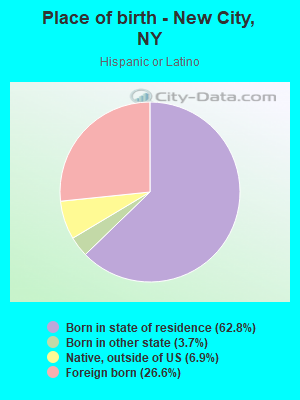
Place of birth - Born in state of residence (%) - Hispanic or Latino
Place of birth - Born in state of residence (%) - American Indian and Alaska Native
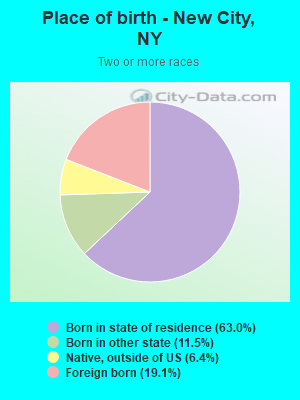
Place of birth - Born in state of residence (%) - Multirace
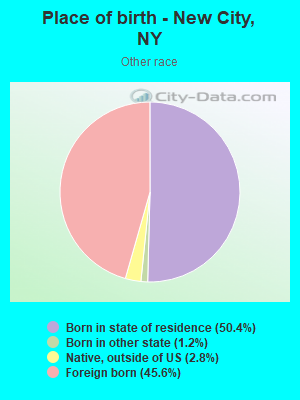
Place of birth - Born in state of residence (%) - Other Race
Place of birth - Born in other state (%)
Place of birth - Born in other state (%) - White
Place of birth - Born in other state (%) - Black or African American
Place of birth - Born in other state (%) - Asian
Place of birth - Born in other state (%) - Hispanic or Latino
Place of birth - Born in other state (%) - American Indian and Alaska Native
Place of birth - Born in other state (%) - Multirace
Place of birth - Born in other state (%) - Other Race
Place of birth - Native, outside of US (%)
Place of birth - Native, outside of US (%) - White
Place of birth - Native, outside of US (%) - Black or African American
Place of birth - Native, outside of US (%) - Asian
Place of birth - Native, outside of US (%) - Hispanic or Latino
Place of birth - Native, outside of US (%) - American Indian and Alaska Native
Place of birth - Native, outside of US (%) - Multirace
Place of birth - Native, outside of US (%) - Other Race
Place of birth - Foreign born (%)
Place of birth - Foreign born (%) - White
Place of birth - Foreign born (%) - Black or African American
Place of birth - Foreign born (%) - Asian
Place of birth - Foreign born (%) - Hispanic or Latino
Place of birth - Foreign born (%) - American Indian and Alaska Native
Place of birth - Foreign born (%) - Multirace
Place of birth - Foreign born (%) - Other Race
Residents speaking English at home (%)
Residents speaking English at home - Born in the United States (%)
Residents speaking English at home - Native, born elsewhere (%)
Residents speaking English at home - Foreign born (%)
Residents speaking Spanish at home (%)
Residents speaking Spanish at home - Born in the United States (%)
Residents speaking Spanish at home - Native, born elsewhere (%)
Residents speaking Spanish at home - Foreign born (%)
Residents speaking other language at home (%)
Residents speaking other language at home - Born in the United States (%)
Residents speaking other language at home - Native, born elsewhere (%)
Residents speaking other language at home - Foreign born (%)
Marital status - Never married (%)
Marital status - Now married (%)
Marital status - Separated (%)
Marital status - Widowed (%)
Marital status - Divorced (%)
Ancestries Reported - Arab (%)
Ancestries Reported - Czech (%)
Ancestries Reported - Danish (%)
Ancestries Reported - Dutch (%)
Ancestries Reported - English (%)
Ancestries Reported - French (%)
Ancestries Reported - French Canadian (%)
Ancestries Reported - German (%)
Ancestries Reported - Greek (%)
Ancestries Reported - Hungarian (%)
Ancestries Reported - Irish (%)
Ancestries Reported - Italian (%)
Ancestries Reported - Lithuanian (%)
Ancestries Reported - Norwegian (%)
Ancestries Reported - Polish (%)
Ancestries Reported - Portuguese (%)
Ancestries Reported - Russian (%)
Ancestries Reported - Scotch-Irish (%)
Ancestries Reported - Scottish (%)
Ancestries Reported - Slovak (%)
Ancestries Reported - Subsaharan African (%)
Ancestries Reported - Swedish (%)
Ancestries Reported - Swiss (%)
Ancestries Reported - Ukrainian (%)
Ancestries Reported - United States (%)
Ancestries Reported - Welsh (%)
Ancestries Reported - West Indian (%)
Ancestries Reported - Other (%)
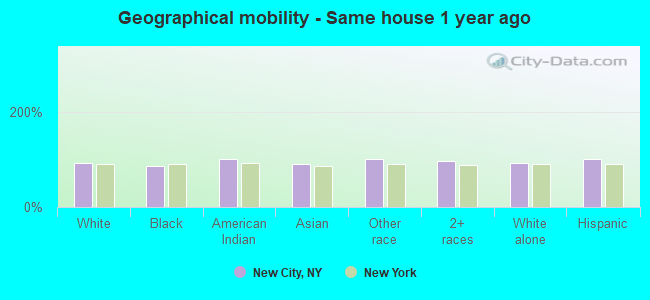
Geographical mobility - Same house 1 year ago (%)
Geographical mobility - Same house 1 year ago (%) - White
Geographical mobility - Same house 1 year ago (%) - Black or African American
Geographical mobility - Same house 1 year ago (%) - Asian
Geographical mobility - Same house 1 year ago (%) - Hispanic or Latino
Geographical mobility - Same house 1 year ago (%) - American Indian and Alaska Native
Geographical mobility - Same house 1 year ago (%) - Multirace
Geographical mobility - Same house 1 year ago (%) - Other Race
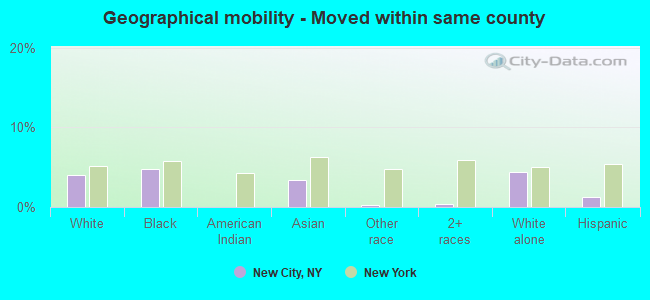
Geographical mobility - Moved within same county (%)
Geographical mobility - Moved within same county (%) - White
Geographical mobility - Moved within same county (%) - Black or African American
Geographical mobility - Moved within same county (%) - Asian
Geographical mobility - Moved within same county (%) - Hispanic or Latino
Geographical mobility - Moved within same county (%) - American Indian and Alaska Native
Geographical mobility - Moved within same county (%) - Multirace
Geographical mobility - Moved within same county (%) - Other Race
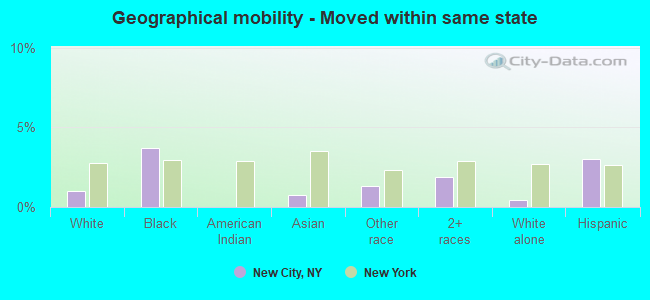
Geographical mobility - Moved from different county within same state (%)
Geographical mobility - Moved from different county within same state (%) - White
Geographical mobility - Moved from different county within same state (%) - Black or African American
Geographical mobility - Moved from different county within same state (%) - Asian
Geographical mobility - Moved from different county within same state (%) - Hispanic or Latino
Geographical mobility - Moved from different county within same state (%) - American Indian and Alaska Native
Geographical mobility - Moved from different county within same state (%) - Multirace
Geographical mobility - Moved from different county within same state (%) - Other Race
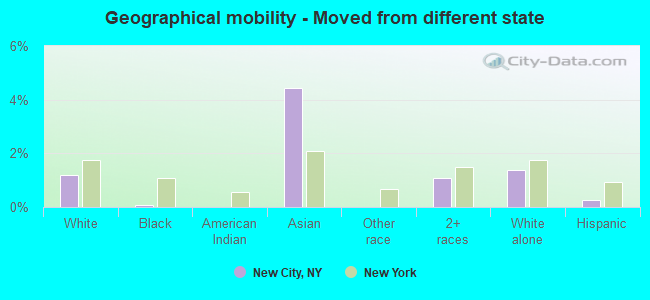
Geographical mobility - Moved from different state (%)
Geographical mobility - Moved from different state (%) - White
Geographical mobility - Moved from different state (%) - Black or African American
Geographical mobility - Moved from different state (%) - Asian
Geographical mobility - Moved from different state (%) - Hispanic or Latino
Geographical mobility - Moved from different state (%) - American Indian and Alaska Native
Geographical mobility - Moved from different state (%) - Multirace
Geographical mobility - Moved from different state (%) - Other Race
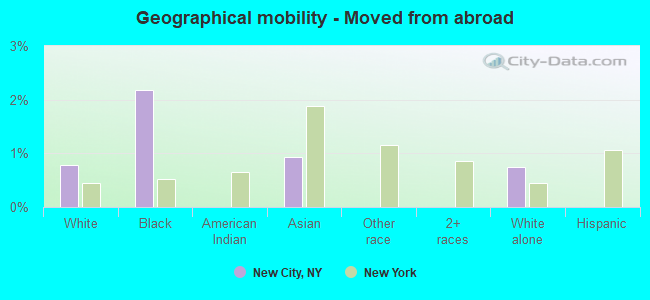
Geographical mobility - Moved from abroad (%)
Geographical mobility - Moved from abroad (%) - White
Geographical mobility - Moved from abroad (%) - Black or African American
Geographical mobility - Moved from abroad (%) - Asian
Geographical mobility - Moved from abroad (%) - Hispanic or Latino
Geographical mobility - Moved from abroad (%) - American Indian and Alaska Native
Geographical mobility - Moved from abroad (%) - Multirace
Geographical mobility - Moved from abroad (%) - Other Race
Place of birth for the foreign-born population - Ireland (%)
Place of birth for the foreign-born population - Denmark (%)
Place of birth for the foreign-born population - Norway (%)
Place of birth for the foreign-born population - Sweden (%)
Place of birth for the foreign-born population - United Kingdom (%)
Place of birth for the foreign-born population - England (%)
Place of birth for the foreign-born population - Scotland (%)
Place of birth for the foreign-born population - Other Northern Europe (%)
Place of birth for the foreign-born population - Austria (%)
Place of birth for the foreign-born population - Belgium (%)
Place of birth for the foreign-born population - France (%)
Place of birth for the foreign-born population - Germany (%)
Place of birth for the foreign-born population - Netherlands (%)
Place of birth for the foreign-born population - Switzerland (%)
Place of birth for the foreign-born population - Other Western Europe (%)
Place of birth for the foreign-born population - Greece (%)
Place of birth for the foreign-born population - Italy (%)
Place of birth for the foreign-born population - Portugal (%)
Place of birth for the foreign-born population - Spain (%)
Place of birth for the foreign-born population - Other Southern Europe (%)
Place of birth for the foreign-born population - Albania (%)
Place of birth for the foreign-born population - Belarus (%)
Place of birth for the foreign-born population - Bosnia and Herzegovina (%)
Place of birth for the foreign-born population - Bulgaria (%)
Place of birth for the foreign-born population - Croatia (%)
Place of birth for the foreign-born population - Czechoslovakia (%)
Place of birth for the foreign-born population - Hungary (%)
Place of birth for the foreign-born population - Latvia (%)
Place of birth for the foreign-born population - Lithuania (%)
Place of birth for the foreign-born population - North Macedonia (Macedonia) (%)
Place of birth for the foreign-born population - Moldova (%)
Place of birth for the foreign-born population - Poland (%)
Place of birth for the foreign-born population - Romania (%)
Place of birth for the foreign-born population - Russia (%)
Place of birth for the foreign-born population - Serbia (%)
Place of birth for the foreign-born population - Ukraine (%)
Place of birth for the foreign-born population - Other Eastern Europe (%)
Place of birth for the foreign-born population - China (%)
Place of birth for the foreign-born population - Hong Kong (%)
Place of birth for the foreign-born population - Taiwan (%)
Place of birth for the foreign-born population - Japan (%)
Place of birth for the foreign-born population - Korea (%)
Place of birth for the foreign-born population - Other Eastern Asia (%)
Place of birth for the foreign-born population - Afghanistan (%)
Place of birth for the foreign-born population - Bangladesh (%)
Place of birth for the foreign-born population - India (%)
Place of birth for the foreign-born population - Iran (%)
Place of birth for the foreign-born population - Kazakhstan (%)
Place of birth for the foreign-born population - Nepal (%)
Place of birth for the foreign-born population - Pakistan (%)
Place of birth for the foreign-born population - Sri Lanka (%)
Place of birth for the foreign-born population - Uzbekistan (%)
Place of birth for the foreign-born population - Other South Central Asia (%)
Place of birth for the foreign-born population - Burma (%)
Place of birth for the foreign-born population - Cambodia (%)
Place of birth for the foreign-born population - Indonesia (%)
Place of birth for the foreign-born population - Laos (%)
Place of birth for the foreign-born population - Malaysia (%)
Place of birth for the foreign-born population - Philippines (%)
Place of birth for the foreign-born population - Singapore (%)
Place of birth for the foreign-born population - Thailand (%)
Place of birth for the foreign-born population - Vietnam (%)
Place of birth for the foreign-born population - Other South Eastern Asia (%)
Place of birth for the foreign-born population - Armenia (%)
Place of birth for the foreign-born population - Iraq (%)
Place of birth for the foreign-born population - Israel (%)
Place of birth for the foreign-born population - Jordan (%)
Place of birth for the foreign-born population - Kuwait (%)
Place of birth for the foreign-born population - Lebanon (%)
Place of birth for the foreign-born population - Saudi Arabia (%)
Place of birth for the foreign-born population - Syria (%)
Place of birth for the foreign-born population - Turkey (%)
Place of birth for the foreign-born population - Yemen (%)
Place of birth for the foreign-born population - Other Western Asia (%)
Place of birth for the foreign-born population - Eritrea (%)
Place of birth for the foreign-born population - Ethiopia (%)
Place of birth for the foreign-born population - Kenya (%)
Place of birth for the foreign-born population - Somalia (%)
Place of birth for the foreign-born population - Uganda (%)
Place of birth for the foreign-born population - Zimbabwe (%)
Place of birth for the foreign-born population - Other Eastern Africa (%)
Place of birth for the foreign-born population - Cameroon (%)
Place of birth for the foreign-born population - Congo (%)
Place of birth for the foreign-born population - Democratic Republic of Congo (Zaire) (%)
Place of birth for the foreign-born population - Other Middle Africa (%)
Place of birth for the foreign-born population - Egypt (%)
Place of birth for the foreign-born population - Morocco (%)
Place of birth for the foreign-born population - Sudan (%)
Place of birth for the foreign-born population - Other Northern Africa (%)
Place of birth for the foreign-born population - South Africa (%)
Place of birth for the foreign-born population - Other Southern Africa (%)
Place of birth for the foreign-born population - Cabo Verde (%)
Place of birth for the foreign-born population - Ghana (%)
Place of birth for the foreign-born population - Liberia (%)
Place of birth for the foreign-born population - Nigeria (%)
Place of birth for the foreign-born population - Senegal (%)
Place of birth for the foreign-born population - Sierra Leone (%)
Place of birth for the foreign-born population - Other Western Africa (%)
Place of birth for the foreign-born population - Australia (%)
Place of birth for the foreign-born population - New Zealand (%)
Place of birth for the foreign-born population - Fiji (%)
Place of birth for the foreign-born population - Micronesia (%)
Place of birth for the foreign-born population - Bahamas (%)
Place of birth for the foreign-born population - Barbados (%)
Place of birth for the foreign-born population - Cuba (%)
Place of birth for the foreign-born population - Dominica (%)
Place of birth for the foreign-born population - Dominican Republic (%)
Place of birth for the foreign-born population - Grenada (%)
Place of birth for the foreign-born population - Haiti (%)
Place of birth for the foreign-born population - Jamaica (%)
Place of birth for the foreign-born population - St. Vincent and the Grenadines (%)
Place of birth for the foreign-born population - Trinidad and Tobago (%)
Place of birth for the foreign-born population - West Indies (%)
Place of birth for the foreign-born population - Other Caribbean (%)
Place of birth for the foreign-born population - Belize (%)
Place of birth for the foreign-born population - Costa Rica (%)
Place of birth for the foreign-born population - El Salvador (%)
Place of birth for the foreign-born population - Guatemala (%)
Place of birth for the foreign-born population - Honduras (%)
Place of birth for the foreign-born population - Mexico (%)
Place of birth for the foreign-born population - Nicaragua (%)
Place of birth for the foreign-born population - Panama (%)
Place of birth for the foreign-born population - Other Central America (%)
Place of birth for the foreign-born population - Argentina (%)
Place of birth for the foreign-born population - Bolivia (%)
Place of birth for the foreign-born population - Brazil (%)
Place of birth for the foreign-born population - Chile (%)
Place of birth for the foreign-born population - Colombia (%)
Place of birth for the foreign-born population - Ecuador (%)
Place of birth for the foreign-born population - Guyana (%)
Place of birth for the foreign-born population - Peru (%)
Place of birth for the foreign-born population - Uruguay (%)
Place of birth for the foreign-born population - Venezuela (%)
Place of birth for the foreign-born population - Other South America (%)
Place of birth for the foreign-born population - Canada (%)
Place of birth for the foreign-born population - Other Northern America (%)
Place of birth for the foreign-born population - Other (%)
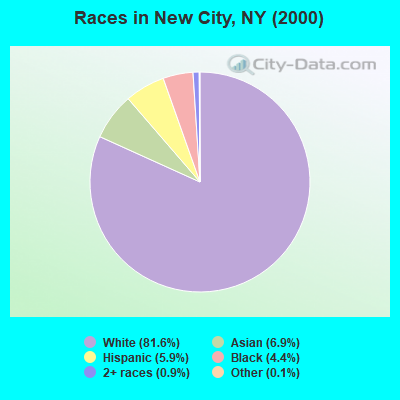
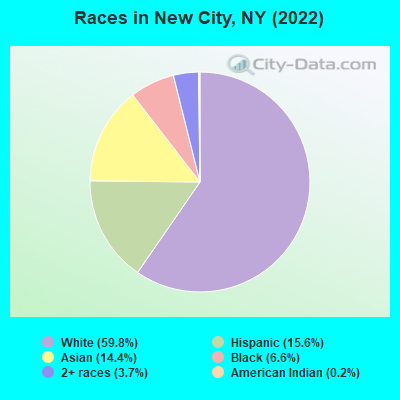
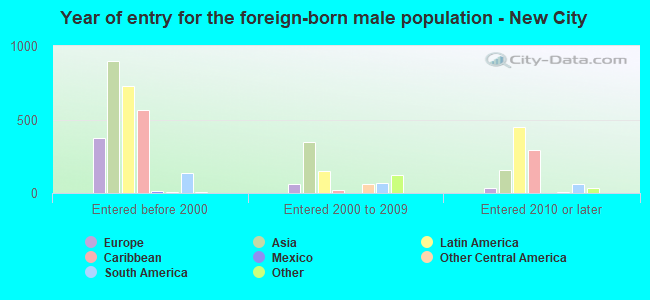
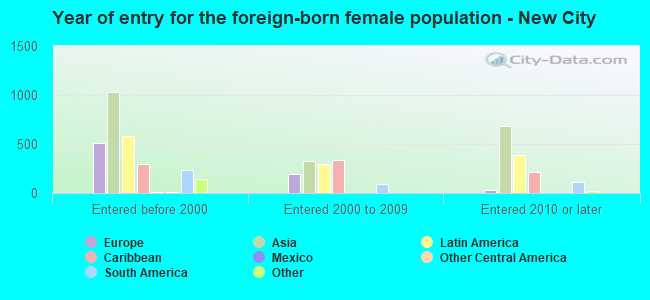
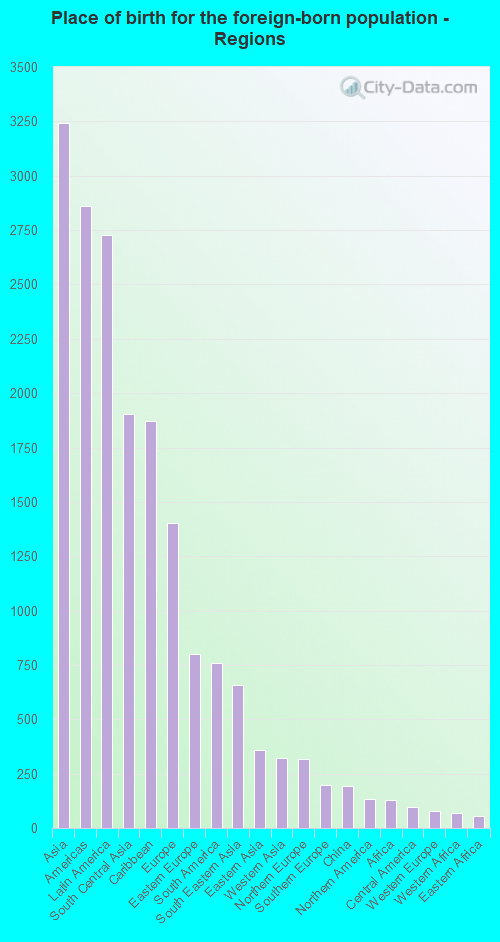
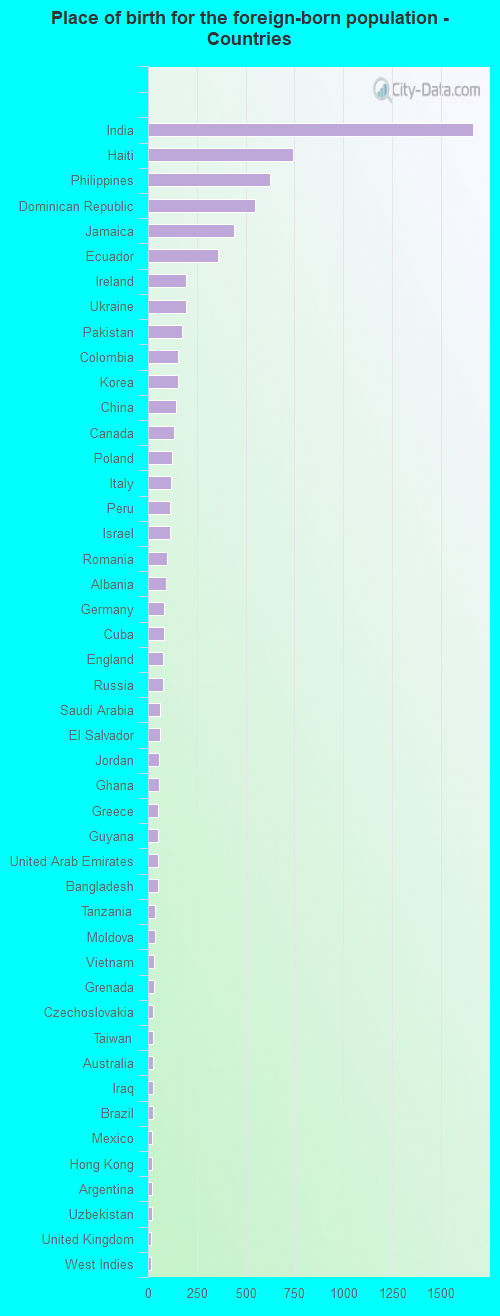
According to 2022 data, the most numerous races in New City, NY are White alone (20,345 residents), Hispanic (5,299 residents), and Black alone (2,231 residents). 71.9% of New City residents speak English at home. 22.6% of New City, NY residents are foreign-born (9.7% born in Asia, 8.2% born in Latin America, 4.2% born in Europe), which is 2.5% greater than the foreign-born rate of 22.0% across the entire state of New York.
Race distribution in New City
2000 2022
11,760,981 62.0% White alone 2,867,583 15.1% Hispanic 2,812,623 14.8% Black alone 1,035,926 5.5% Asian alone 366,116 1.9% Two or more races 75,499 0.4% Other race alone 52,499 0.3% American Indian alone 5,230 0.03% Native Hawaiian and Other
10,408,933 52.9% White alone 3,867,299 19.7% Hispanic 2,633,840 13.4% Black alone 1,776,286 9.0% Asian alone 732,670 3.7% Two or more races 216,110 1.1% Other race alone 35,082 0.2% American Indian alone 6,931 0.04% Native Hawaiian and Other
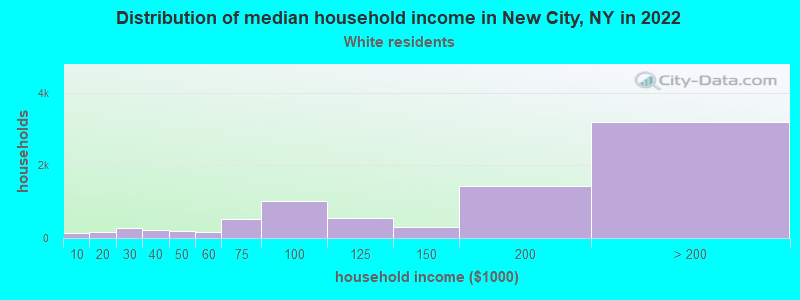
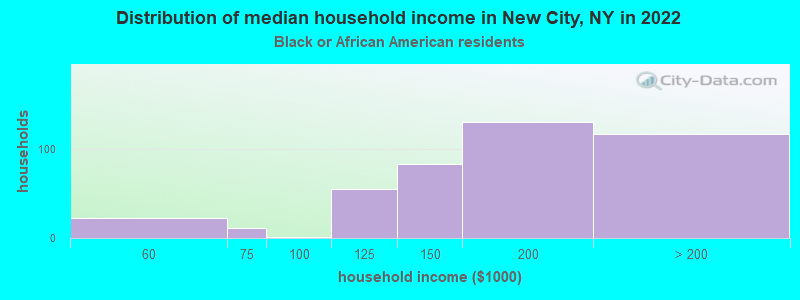
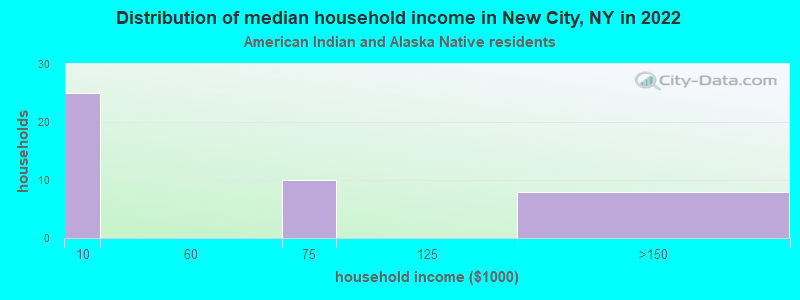
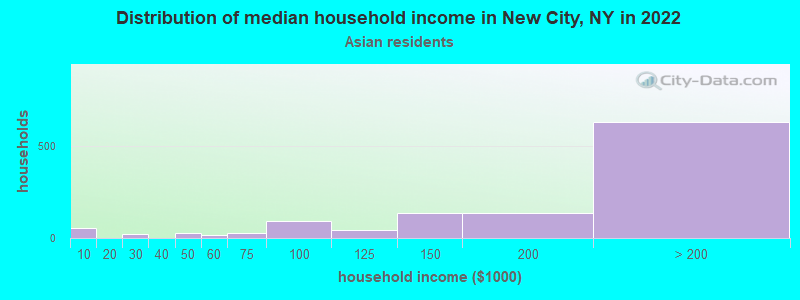
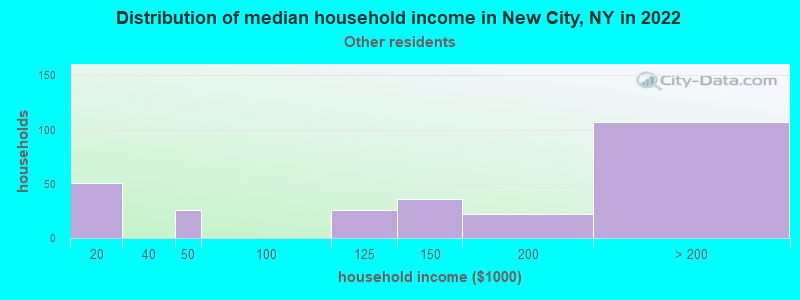
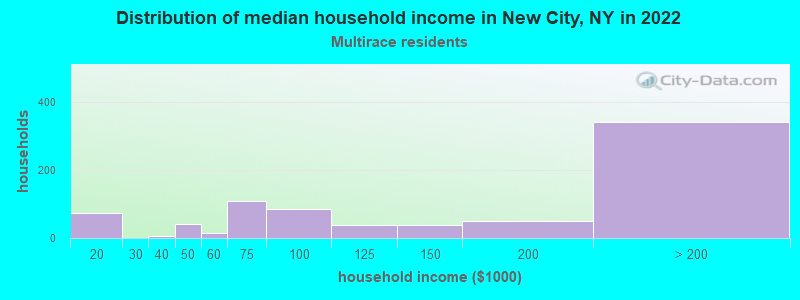
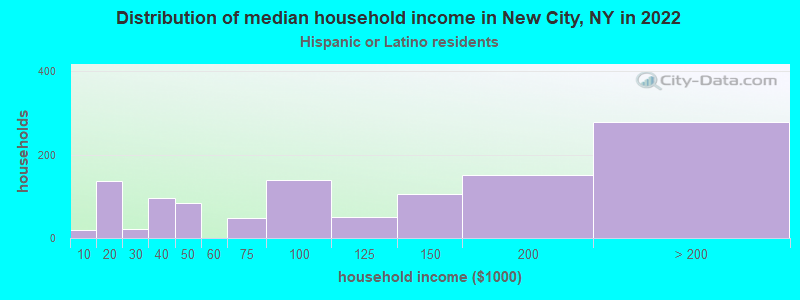
Income and house value in New City Median household income in 2022 $169,193 White non-Hispanic householders$124,372 Black householders$4,322 American Indian and Alaska Native householders$177,684 Asian householders$138,248 Some other race householders$123,142 Two or more races householders$128,169 Hispanic or Latino race householdersMedian 2022 house value $635,051 White Non-Hispanic householders$493,852 Black or African American householders$633,438 American Indian or Alaska Native householders $612,017 Asian householders$611,095 Some other race householders$492,009 Two or more races householders$600,730 Hispanic or Latino householders
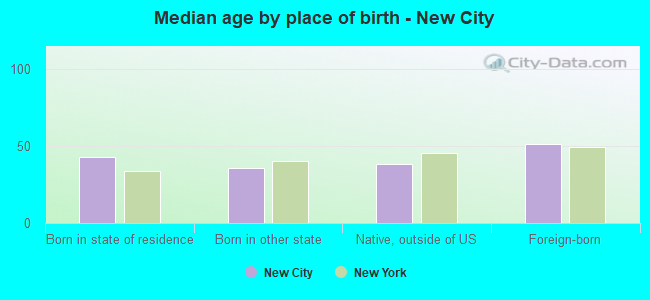
Median age by race in New City
48.4 Median age for White residents46.2 49.8 41.1 Median age for Black or African American residents44.4 40.0 35.1 Median age for American Indian / Alaska Native residents12.0 36.1 37.3 Median age for Asian residents36.5 37.8 -463,937,621.4 Median age for Native Hawaiian / Pacific Islander residents-649,572,648.9 -666,666,666.0 29.2 Median age for Other race residents24.3 34.2 25.6 Median age for Two or more races residents23.6 27.3 48.5 Median age for White alone residents46.8 49.9 32.8 Median age for Hispanic or Latino residents32.5 33.6
Owner/renter occupied households by race in New City
House owners and renters - White residents 7,507 94.1% Owner occupied469 5.9% Renter occupiedHouse owners and renters - Black or African American residents 428 86.0% Owner occupied70 14.0% Renter occupiedHouse owners and renters - American Indian / Alaska Native residents 10 24.5% Owner occupied32 75.5% Renter occupiedHouse owners and renters - Asian residents 1,120 97.0% Owner occupied35 3.0% Renter occupiedHouse owners and renters - Other race residents 233 100.0% Owner occupiedHouse owners and renters - Two or more races residents 743 90.1% Owner occupied82 9.9% Renter occupiedHouse owners and renters - White alone residents 7,298 94.8% Owner occupied400 5.2% Renter occupiedHouse owners and renters - Hispanic or Latino residents 809 84.3% Owner occupied151 15.7% Renter occupied
Language usage in New City
English speakers - Total 71.9% of residents of New City speak English at home.
8.0% of residents speak Spanish at home 1,696 65.8% Speak English very well882 34.2% Speak English less than very well19.9% of residents speak other language at home 4,536 70.9% Speak English very well1,865 29.1% Speak English less than very well
English speakers - Born in the United States 90.2% of residents of New City speak English at home.
3.6% of residents speak Spanish at home 153 100.0% Speak English very well7.4% of residents speak other language at home 309 97.5% Speak English very well8 2.5% Speak English less than very well
English speakers - Native, born elsewhere 39.8% of residents of New City speak English at home.
47.9% of residents speak Spanish at home 377 94.0% Speak English very well24 6.0% Speak English less than very well17.9% of residents speak other language at home 72 48.0% Speak English very well78 52.0% Speak English less than very well
English speakers - Foreign-born 19.8% of residents of New City speak English at home.
16.6% of residents speak Spanish at home 558 44.7% Speak English very well690 55.3% Speak English less than very well62.3% of residents speak other language at home 3,129 67.0% Speak English very well1,543 33.0% Speak English less than very well
White (Caucasian) - Speak only English Native:
95.0% (17,715)Foreign-born:
36.7% (648)
White (Caucasian) - Speak another language Native:
6.7% (1,253)Foreign-born:
63.9% (1,128)
Black or African American - Speak only English Native:
69.6% (702)Foreign-born:
29.6% (354)
Black or African American - Speak another language Native:
30.7% (309)Foreign-born:
69.7% (832)
American Indian / Alaska Native - Speak another language Native:
20.4% (14)Foreign-born:
100.0% (37)
Asian - Speak only English Native:
46.9% (668)Foreign-born:
10.9% (322)
Asian - Speak another language Native:
51.4% (732)Foreign-born:
88.4% (2,611)
Other race - Speak only English Native:
42.6% (329)Foreign-born:
2.7% (21)
Other race - Speak another language Native:
57.8% (446)Foreign-born:
97.2% (768)
Two or more races - Speak only English Native:
83.7% (2,401)Foreign-born:
28.7% (211)
Two or more races - Speak another language Native:
20.2% (579)Foreign-born:
75.2% (553)
White alone - Speak only English Native:
94.5% (16,881)Foreign-born:
37.8% (618)
White alone - Speak another language Native:
5.3% (955)Foreign-born:
62.4% (1,020)
Hispanic or Latino - Speak only English Native:
78.5% (2,756)Foreign-born:
6.9% (96)
Hispanic or Latino - Speak another language Native:
31.3% (1,099)Foreign-born:
93.3% (1,299)
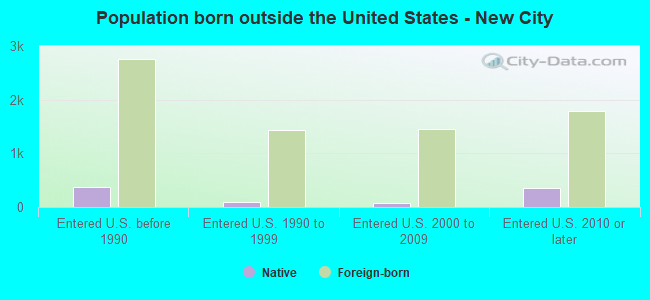
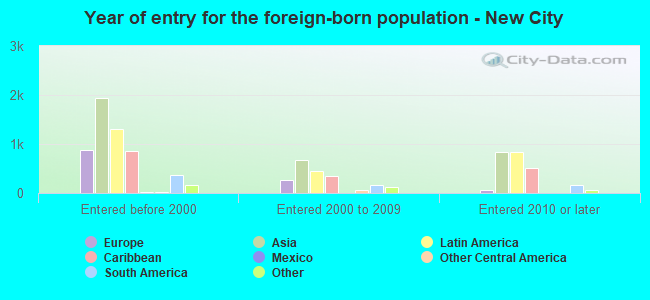
Foreign-born residents in New City 7,670 residents are foreign born (9.7% Asia , 8.2% Latin America , 4.2% Europe ).
This city:
22.6%New York:
22.6%
Marital status for residents in New City Marital status - White (Caucasian) population 15 years and over
Males 29.5% Never married63.1% Now married0.9% Separated2.6% Widowed3.8% DivorcedFemales 22.9% Never married59.6% Now married1.2% Separated9.5% Widowed6.8% DivorcedWomen who gave birth in the past 12 months Now married:
86.3% (119)Unmarried:
13.7% (19)
Women who did not give birth in the past 12 months Now married:
47.3% (1,854)Unmarried:
52.7% (2,063)
Marital status - Black or African American population 15 years and over
Males 40.3% Never married46.3% Now married7.4% Separated2.7% Widowed3.4% DivorcedFemales 38.4% Never married41.6% Now married2.7% Separated6.0% Widowed11.3% DivorcedWomen who did not give birth in the past 12 months Now married:
26.3% (151)Unmarried:
73.7% (421)
Marital status - American Indian / Alaska Native population 15 years and over
Males 0.0% Never married100.0% Now married0.0% Separated0.0% Widowed0.0% DivorcedFemales 0.0% Never married81.8% Now married0.0% Separated0.0% Widowed18.2% DivorcedWomen who did not give birth in the past 12 months Now married:
100.0% (27)Unmarried:
0.0% (0)
Marital status - Asian population 15 years and over
Males 26.8% Never married68.2% Now married0.0% Separated2.7% Widowed2.4% DivorcedFemales 28.5% Never married53.8% Now married0.2% Separated16.4% Widowed1.0% DivorcedWomen who gave birth in the past 12 months Now married:
60.0% (6)Unmarried:
40.0% (4)
Women who did not give birth in the past 12 months Now married:
51.2% (511)Unmarried:
48.8% (487)
Marital status - Other race population 15 years and over
Males 38.0% Never married53.2% Now married5.9% Separated0.0% Widowed2.9% DivorcedFemales 33.8% Never married64.2% Now married0.0% Separated0.0% Widowed2.0% DivorcedWomen who gave birth in the past 12 months Now married:
100.0% (38)Unmarried:
0.0% (0)
Women who did not give birth in the past 12 months Now married:
40.1% (145)Unmarried:
59.9% (216)
Marital status - Two or more races population 15 years and over
Males 48.4% Never married49.6% Now married1.0% Separated0.0% Widowed1.0% DivorcedFemales 37.3% Never married55.7% Now married0.0% Separated4.4% Widowed2.6% DivorcedWomen who did not give birth in the past 12 months Now married:
50.9% (570)Unmarried:
49.1% (550)
Marital status - White alone, not Hispanic / Latino population 15 years and over
Males 29.3% Never married63.4% Now married0.9% Separated2.4% Widowed4.0% DivorcedFemales 22.3% Never married60.1% Now married1.2% Separated9.5% Widowed6.8% DivorcedWomen who gave birth in the past 12 months Now married:
83.9% (102)Unmarried:
16.1% (20)
Women who did not give birth in the past 12 months Now married:
46.9% (1,716)Unmarried:
53.1% (1,940)
Marital status - Hispanic or Latino population 15 years and over
Males 39.1% Never married53.3% Now married2.6% Separated2.8% Widowed2.2% DivorcedFemales 36.2% Never married54.7% Now married0.6% Separated4.6% Widowed4.0% DivorcedWomen who gave birth in the past 12 months Now married:
100.0% (61)Unmarried:
0.0% (0)
Women who did not give birth in the past 12 months Now married:
43.4% (542)Unmarried:
56.6% (708)
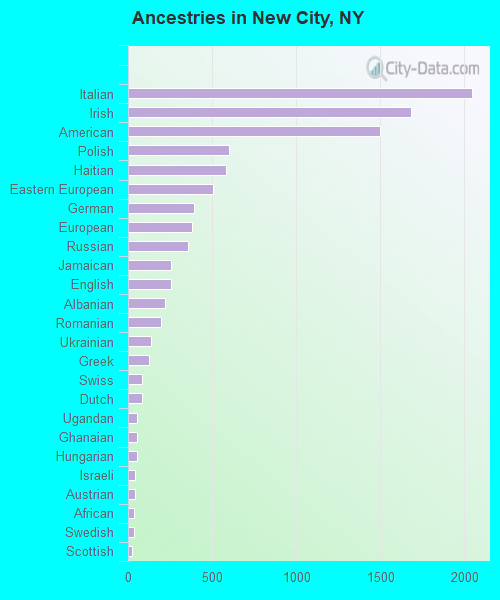
Ancestries in New City
2,044 11.7% Italian1,685 9.7% Irish1,498 8.6% American603 3.5% Polish582 3.3% Haitian506 2.9% Eastern European390 2.2% German383 2.2% European354 2.0% Russian255 1.5% Jamaican254 1.5% English222 1.3% Albanian199 1.1% Romanian136 0.8% Ukrainian122 0.7% Greek82 0.5% Swiss81 0.5% Dutch53 0.3% Ugandan53 0.3% Ghanaian51 0.3% Hungarian43 0.2% Israeli39 0.2% Austrian37 0.2% African36 0.2% Swedish26 0.1% Scottish24 0.1% Iraqi24 0.1% Celtic24 0.1% Guyanese23 0.1% Portuguese23 0.1% Norwegian22 0.1% Brazilian20 0.1% Jordanian19 0.1% Scotch-Irish18 0.1% Basque14 0.08% Canadian14 0.08% West Indian12 0.07% Egyptian11 0.06% French Canadian11 0.06% Barbadian10 0.06% Finnish9 0.05% Croatian9 0.05% Latvian9 0.05% Lithuanian8 0.05% Slovene7 0.04% French6 0.03% Turkish5 0.03% Czechoslovakian5 0.03% Slovak
Geographical mobility in New City Same house 1 year ago 19,662 93.1% White (Caucasian)1,907 85.7% Black or African American108 100.0% American Indian / Alaska Native4,303 90.4% Asian1,796 100.0% Other race3,443 96.4% Two or more races18,843 93.4% White alone, not Hispanic / Latino5,177 100.0% Hispanic or LatinoMoved within same county 856 4.1% White / Caucasian107 4.8% Black or African American159 3.3% Asian5 0.3% Other race15 0.4% Two or more races887 4.4% White alone, not Hispanic / Latino62 1.2% Hispanic or LatinoMoved within same state 218 1.0% White / Caucasian83 3.7% Black or African American35 0.7% Asian23 1.3% Other race68 1.9% Two or more races90 0.4% White alone, not Hispanic / Latino155 3.0% Hispanic or LatinoMoved from different state 252 1.2% White / Caucasian2 0.1% Black or African American211 4.4% Asian38 1.1% Two or more races281 1.4% White alone, not Hispanic / Latino13 0.2% Hispanic or LatinoMoved from abroad 164 0.8% White48 2.2% Black or African American44 0.9% Asian150 0.7% White alone, not Hispanic / Latino
Children Nativity (place of birth) in New City
Children under 6 years - Living with two parents Both parents native 731 100.0% NativeBoth parents foreign-born 831 100.0% NativeOne native, one foreign-born parent 406 100.0% NativeChildren under 6 years - Living with one parent Native parent 86 100.0% NativeForeign-born parent 117 100.0% NativeChildren 6 to 17 years - Living with two parents Both parents native 2,316 99.7% Native7 0.3% Foreign-bornBoth parents foreign-born 1,156 84.5% Native211 15.5% Foreign-bornOne native, one foreign-born parent 590 100.0% NativeChildren 6 to 17 years - Living with one parent Native parent 673 94.8% Native37 5.2% Foreign-bornForeign-born parent 42 60.9% Native27 39.1% Foreign-born
Grandparents responsible for own grandchildren in New City
Grandparents (30 to 59 years) White / Caucasian 17 31.2% Responsible for grandchildren37 68.8% Not responsible for grandchildrenOther race 14 100.0% Not responsible for grandchildrenWhite alone, not Hispanic / Latino 26 100.0% Not responsible for grandchildrenHispanic or Latino 20 38.0% Responsible for grandchildren33 62.0% Not responsible for grandchildrenGrandparents (60 years and over) White / Caucasian 41 11.1% Responsible for grandchildren330 88.9% Not responsible for grandchildrenOther race 196 100.0% Not responsible for grandchildrenWhite alone, not Hispanic / Latino 44 13.2% Responsible for grandchildren291 86.8% Not responsible for grandchildrenHispanic or Latino 10 3.6% Responsible for grandchildren267 96.4% Not responsible for grandchildren