Races in Milford, Massachusetts (MA) Detailed Stats
Data:
Races - White alone (%)
Races - White alone (% change since 2000)
Races - Black alone (%)
Races - Black alone (% change since 2000)
Races - American Indian alone (%)
Races - American Indian alone (% change since 2000)
Races - Asian alone (%)
Races - Asian alone (% change since 2000)
Races - Hispanic (%)
Races - Hispanic (% change since 2000)
Races - Native Hawaiian and Other Pacific Islander alone (%)
Races - Native Hawaiian and Other Pacific Islander alone (% change since 2000)
Races - Two or more races(%)
Races - Two or more races(% change since 2000)
Races - Other race alone (%)
Races - Other race alone (% change since 2000)
Racial diversity
Place of birth - Born in state of residence (%)
Place of birth - Born in state of residence (%) - White
Place of birth - Born in state of residence (%) - Black or African American
Place of birth - Born in state of residence (%) - Asian
Place of birth - Born in state of residence (%) - Hispanic or Latino
Place of birth - Born in state of residence (%) - American Indian and Alaska Native
Place of birth - Born in state of residence (%) - Multirace
Place of birth - Born in state of residence (%) - Other Race
Place of birth - Born in other state (%)
Place of birth - Born in other state (%) - White
Place of birth - Born in other state (%) - Black or African American
Place of birth - Born in other state (%) - Asian
Place of birth - Born in other state (%) - Hispanic or Latino
Place of birth - Born in other state (%) - American Indian and Alaska Native
Place of birth - Born in other state (%) - Multirace
Place of birth - Born in other state (%) - Other Race
Place of birth - Native, outside of US (%)
Place of birth - Native, outside of US (%) - White
Place of birth - Native, outside of US (%) - Black or African American
Place of birth - Native, outside of US (%) - Asian
Place of birth - Native, outside of US (%) - Hispanic or Latino
Place of birth - Native, outside of US (%) - American Indian and Alaska Native
Place of birth - Native, outside of US (%) - Multirace
Place of birth - Native, outside of US (%) - Other Race
Place of birth - Foreign born (%)
Place of birth - Foreign born (%) - White
Place of birth - Foreign born (%) - Black or African American
Place of birth - Foreign born (%) - Asian
Place of birth - Foreign born (%) - Hispanic or Latino
Place of birth - Foreign born (%) - American Indian and Alaska Native
Place of birth - Foreign born (%) - Multirace
Place of birth - Foreign born (%) - Other Race
Residents speaking English at home (%)
Residents speaking English at home - Born in the United States (%)
Residents speaking English at home - Native, born elsewhere (%)
Residents speaking English at home - Foreign born (%)
Residents speaking Spanish at home (%)
Residents speaking Spanish at home - Born in the United States (%)
Residents speaking Spanish at home - Native, born elsewhere (%)
Residents speaking Spanish at home - Foreign born (%)
Residents speaking other language at home (%)
Residents speaking other language at home - Born in the United States (%)
Residents speaking other language at home - Native, born elsewhere (%)
Residents speaking other language at home - Foreign born (%)
Marital status - Never married (%)
Marital status - Now married (%)
Marital status - Separated (%)
Marital status - Widowed (%)
Marital status - Divorced (%)
Ancestries Reported - Arab (%)
Ancestries Reported - Czech (%)
Ancestries Reported - Danish (%)
Ancestries Reported - Dutch (%)
Ancestries Reported - English (%)
Ancestries Reported - French (%)
Ancestries Reported - French Canadian (%)
Ancestries Reported - German (%)
Ancestries Reported - Greek (%)
Ancestries Reported - Hungarian (%)
Ancestries Reported - Irish (%)
Ancestries Reported - Italian (%)
Ancestries Reported - Lithuanian (%)
Ancestries Reported - Norwegian (%)
Ancestries Reported - Polish (%)
Ancestries Reported - Portuguese (%)
Ancestries Reported - Russian (%)
Ancestries Reported - Scotch-Irish (%)
Ancestries Reported - Scottish (%)
Ancestries Reported - Slovak (%)
Ancestries Reported - Subsaharan African (%)
Ancestries Reported - Swedish (%)
Ancestries Reported - Swiss (%)
Ancestries Reported - Ukrainian (%)
Ancestries Reported - United States (%)
Ancestries Reported - Welsh (%)
Ancestries Reported - West Indian (%)
Ancestries Reported - Other (%)
Geographical mobility - Same house 1 year ago (%)
Geographical mobility - Same house 1 year ago (%) - White
Geographical mobility - Same house 1 year ago (%) - Black or African American
Geographical mobility - Same house 1 year ago (%) - Asian
Geographical mobility - Same house 1 year ago (%) - Hispanic or Latino
Geographical mobility - Same house 1 year ago (%) - American Indian and Alaska Native
Geographical mobility - Same house 1 year ago (%) - Multirace
Geographical mobility - Same house 1 year ago (%) - Other Race
Geographical mobility - Moved within same county (%)
Geographical mobility - Moved within same county (%) - White
Geographical mobility - Moved within same county (%) - Black or African American
Geographical mobility - Moved within same county (%) - Asian
Geographical mobility - Moved within same county (%) - Hispanic or Latino
Geographical mobility - Moved within same county (%) - American Indian and Alaska Native
Geographical mobility - Moved within same county (%) - Multirace
Geographical mobility - Moved within same county (%) - Other Race
Geographical mobility - Moved from different county within same state (%)
Geographical mobility - Moved from different county within same state (%) - White
Geographical mobility - Moved from different county within same state (%) - Black or African American
Geographical mobility - Moved from different county within same state (%) - Asian
Geographical mobility - Moved from different county within same state (%) - Hispanic or Latino
Geographical mobility - Moved from different county within same state (%) - American Indian and Alaska Native
Geographical mobility - Moved from different county within same state (%) - Multirace
Geographical mobility - Moved from different county within same state (%) - Other Race
Geographical mobility - Moved from different state (%)
Geographical mobility - Moved from different state (%) - White
Geographical mobility - Moved from different state (%) - Black or African American
Geographical mobility - Moved from different state (%) - Asian
Geographical mobility - Moved from different state (%) - Hispanic or Latino
Geographical mobility - Moved from different state (%) - American Indian and Alaska Native
Geographical mobility - Moved from different state (%) - Multirace
Geographical mobility - Moved from different state (%) - Other Race
Geographical mobility - Moved from abroad (%)
Geographical mobility - Moved from abroad (%) - White
Geographical mobility - Moved from abroad (%) - Black or African American
Geographical mobility - Moved from abroad (%) - Asian
Geographical mobility - Moved from abroad (%) - Hispanic or Latino
Geographical mobility - Moved from abroad (%) - American Indian and Alaska Native
Geographical mobility - Moved from abroad (%) - Multirace
Geographical mobility - Moved from abroad (%) - Other Race
Place of birth for the foreign-born population - Ireland (%)
Place of birth for the foreign-born population - Denmark (%)
Place of birth for the foreign-born population - Norway (%)
Place of birth for the foreign-born population - Sweden (%)
Place of birth for the foreign-born population - United Kingdom (%)
Place of birth for the foreign-born population - England (%)
Place of birth for the foreign-born population - Scotland (%)
Place of birth for the foreign-born population - Other Northern Europe (%)
Place of birth for the foreign-born population - Austria (%)
Place of birth for the foreign-born population - Belgium (%)
Place of birth for the foreign-born population - France (%)
Place of birth for the foreign-born population - Germany (%)
Place of birth for the foreign-born population - Netherlands (%)
Place of birth for the foreign-born population - Switzerland (%)
Place of birth for the foreign-born population - Other Western Europe (%)
Place of birth for the foreign-born population - Greece (%)
Place of birth for the foreign-born population - Italy (%)
Place of birth for the foreign-born population - Portugal (%)
Place of birth for the foreign-born population - Spain (%)
Place of birth for the foreign-born population - Other Southern Europe (%)
Place of birth for the foreign-born population - Albania (%)
Place of birth for the foreign-born population - Belarus (%)
Place of birth for the foreign-born population - Bosnia and Herzegovina (%)
Place of birth for the foreign-born population - Bulgaria (%)
Place of birth for the foreign-born population - Croatia (%)
Place of birth for the foreign-born population - Czechoslovakia (%)
Place of birth for the foreign-born population - Hungary (%)
Place of birth for the foreign-born population - Latvia (%)
Place of birth for the foreign-born population - Lithuania (%)
Place of birth for the foreign-born population - North Macedonia (Macedonia) (%)
Place of birth for the foreign-born population - Moldova (%)
Place of birth for the foreign-born population - Poland (%)
Place of birth for the foreign-born population - Romania (%)
Place of birth for the foreign-born population - Russia (%)
Place of birth for the foreign-born population - Serbia (%)
Place of birth for the foreign-born population - Ukraine (%)
Place of birth for the foreign-born population - Other Eastern Europe (%)
Place of birth for the foreign-born population - China (%)
Place of birth for the foreign-born population - Hong Kong (%)
Place of birth for the foreign-born population - Taiwan (%)
Place of birth for the foreign-born population - Japan (%)
Place of birth for the foreign-born population - Korea (%)
Place of birth for the foreign-born population - Other Eastern Asia (%)
Place of birth for the foreign-born population - Afghanistan (%)
Place of birth for the foreign-born population - Bangladesh (%)
Place of birth for the foreign-born population - India (%)
Place of birth for the foreign-born population - Iran (%)
Place of birth for the foreign-born population - Kazakhstan (%)
Place of birth for the foreign-born population - Nepal (%)
Place of birth for the foreign-born population - Pakistan (%)
Place of birth for the foreign-born population - Sri Lanka (%)
Place of birth for the foreign-born population - Uzbekistan (%)
Place of birth for the foreign-born population - Other South Central Asia (%)
Place of birth for the foreign-born population - Burma (%)
Place of birth for the foreign-born population - Cambodia (%)
Place of birth for the foreign-born population - Indonesia (%)
Place of birth for the foreign-born population - Laos (%)
Place of birth for the foreign-born population - Malaysia (%)
Place of birth for the foreign-born population - Philippines (%)
Place of birth for the foreign-born population - Singapore (%)
Place of birth for the foreign-born population - Thailand (%)
Place of birth for the foreign-born population - Vietnam (%)
Place of birth for the foreign-born population - Other South Eastern Asia (%)
Place of birth for the foreign-born population - Armenia (%)
Place of birth for the foreign-born population - Iraq (%)
Place of birth for the foreign-born population - Israel (%)
Place of birth for the foreign-born population - Jordan (%)
Place of birth for the foreign-born population - Kuwait (%)
Place of birth for the foreign-born population - Lebanon (%)
Place of birth for the foreign-born population - Saudi Arabia (%)
Place of birth for the foreign-born population - Syria (%)
Place of birth for the foreign-born population - Turkey (%)
Place of birth for the foreign-born population - Yemen (%)
Place of birth for the foreign-born population - Other Western Asia (%)
Place of birth for the foreign-born population - Eritrea (%)
Place of birth for the foreign-born population - Ethiopia (%)
Place of birth for the foreign-born population - Kenya (%)
Place of birth for the foreign-born population - Somalia (%)
Place of birth for the foreign-born population - Uganda (%)
Place of birth for the foreign-born population - Zimbabwe (%)
Place of birth for the foreign-born population - Other Eastern Africa (%)
Place of birth for the foreign-born population - Cameroon (%)
Place of birth for the foreign-born population - Congo (%)
Place of birth for the foreign-born population - Democratic Republic of Congo (Zaire) (%)
Place of birth for the foreign-born population - Other Middle Africa (%)
Place of birth for the foreign-born population - Egypt (%)
Place of birth for the foreign-born population - Morocco (%)
Place of birth for the foreign-born population - Sudan (%)
Place of birth for the foreign-born population - Other Northern Africa (%)
Place of birth for the foreign-born population - South Africa (%)
Place of birth for the foreign-born population - Other Southern Africa (%)
Place of birth for the foreign-born population - Cabo Verde (%)
Place of birth for the foreign-born population - Ghana (%)
Place of birth for the foreign-born population - Liberia (%)
Place of birth for the foreign-born population - Nigeria (%)
Place of birth for the foreign-born population - Senegal (%)
Place of birth for the foreign-born population - Sierra Leone (%)
Place of birth for the foreign-born population - Other Western Africa (%)
Place of birth for the foreign-born population - Australia (%)
Place of birth for the foreign-born population - New Zealand (%)
Place of birth for the foreign-born population - Fiji (%)
Place of birth for the foreign-born population - Micronesia (%)
Place of birth for the foreign-born population - Bahamas (%)
Place of birth for the foreign-born population - Barbados (%)
Place of birth for the foreign-born population - Cuba (%)
Place of birth for the foreign-born population - Dominica (%)
Place of birth for the foreign-born population - Dominican Republic (%)
Place of birth for the foreign-born population - Grenada (%)
Place of birth for the foreign-born population - Haiti (%)
Place of birth for the foreign-born population - Jamaica (%)
Place of birth for the foreign-born population - St. Vincent and the Grenadines (%)
Place of birth for the foreign-born population - Trinidad and Tobago (%)
Place of birth for the foreign-born population - West Indies (%)
Place of birth for the foreign-born population - Other Caribbean (%)
Place of birth for the foreign-born population - Belize (%)
Place of birth for the foreign-born population - Costa Rica (%)
Place of birth for the foreign-born population - El Salvador (%)
Place of birth for the foreign-born population - Guatemala (%)
Place of birth for the foreign-born population - Honduras (%)
Place of birth for the foreign-born population - Mexico (%)
Place of birth for the foreign-born population - Nicaragua (%)
Place of birth for the foreign-born population - Panama (%)
Place of birth for the foreign-born population - Other Central America (%)
Place of birth for the foreign-born population - Argentina (%)
Place of birth for the foreign-born population - Bolivia (%)
Place of birth for the foreign-born population - Brazil (%)
Place of birth for the foreign-born population - Chile (%)
Place of birth for the foreign-born population - Colombia (%)
Place of birth for the foreign-born population - Ecuador (%)
Place of birth for the foreign-born population - Guyana (%)
Place of birth for the foreign-born population - Peru (%)
Place of birth for the foreign-born population - Uruguay (%)
Place of birth for the foreign-born population - Venezuela (%)
Place of birth for the foreign-born population - Other South America (%)
Place of birth for the foreign-born population - Canada (%)
Place of birth for the foreign-born population - Other Northern America (%)
Place of birth for the foreign-born population - Other (%)
Latest news about races in Milford, MA collected exclusively by city-data.com from local newspapers, TV, and radio stations
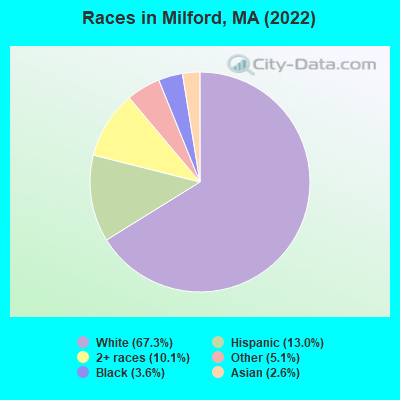
According to 2022 data, the most numerous races in Milford, MA are White alone (18,644 residents), Hispanic (3,593 residents), and Asian alone (730 residents). 62.5% of Milford residents speak English at home. 27.9% of Milford, MA residents are foreign-born (19.1% born in Latin America, 4.0% born in Europe), which is 35.6% greater than the foreign-born rate of 18.0% across the entire state of Massachusetts.
Race distribution in Milford
2000 2022
5,198,359 81.9% White alone 428,729 6.8% Hispanic 318,329 5.0% Black alone 236,786 3.7% Asian alone 110,338 1.7% Two or more races 43,586 0.7% Other race alone 11,264 0.2% American Indian alone 1,706 0.03% Native Hawaiian and Other
4,676,627 67.0% White alone 911,038 13.0% Hispanic 501,463 7.2% Asian alone 459,740 6.6% Black alone 341,889 4.9% Two or more races 84,403 1.2% Other race alone 5,838 0.08% American Indian alone 976 0.01% Native Hawaiian and Other
Income and house value in Milford Median household income in 2022 $95,401 White non-Hispanic householders$65,333 Black householders$182,409 Asian householders$73,820 Some other race householders$71,324 Two or more races householders$71,421 Hispanic or Latino race householdersMedian 2022 house value $433,346 White Non-Hispanic householders$394,877 Black or African American householders$350,294 American Indian or Alaska Native householders $556,649 Asian householders$375,006 Two or more races householders$430,034 Hispanic or Latino householders
Median age by race in Milford
44.4 Median age for White residents41.3 47.6 33.1 Median age for Black or African American residents32.3 42.9 26.0 Median age for American Indian / Alaska Native residents9.4 26.3 48.3 Median age for Asian residents41.4 49.5 -601,918,464.6 Median age for Native Hawaiian / Pacific Islander residents-513,131,312.6 -508,717,948.2 34.0 Median age for Other race residents35.7 30.7 29.8 Median age for Two or more races residents26.7 33.1 44.7 Median age for White alone residents40.9 49.1 30.6 Median age for Hispanic or Latino residents30.4 28.4
Owner/renter occupied households by race in Milford
House owners and renters - White residents 5,914 72.7% Owner occupied2,224 27.3% Renter occupiedHouse owners and renters - Black or African American residents 171 75.5% Owner occupied56 24.5% Renter occupiedHouse owners and renters - American Indian / Alaska Native residents 29 35.2% Owner occupied53 64.8% Renter occupiedHouse owners and renters - Asian residents 252 79.1% Owner occupied67 20.9% Renter occupiedHouse owners and renters - Other race residents 292 30.7% Owner occupied659 69.3% Renter occupiedHouse owners and renters - Two or more races residents 403 35.8% Owner occupied722 64.2% Renter occupiedHouse owners and renters - White alone residents 5,898 73.8% Owner occupied2,091 26.2% Renter occupiedHouse owners and renters - Hispanic or Latino residents 319 34.1% Owner occupied617 65.9% Renter occupied
Language usage in Milford
English speakers - Total 62.5% of residents of Milford speak English at home.
11.8% of residents speak Spanish at home 1,112 36.3% Speak English very well1,951 63.7% Speak English less than very well27.1% of residents speak other language at home 3,409 48.5% Speak English very well3,624 51.5% Speak English less than very well
English speakers - Born in the United States 87.4% of residents of Milford speak English at home.
4.8% of residents speak Spanish at home 153 92.7% Speak English very well12 7.3% Speak English less than very well7.5% of residents speak other language at home 247 96.1% Speak English very well10 3.9% Speak English less than very well
English speakers - Native, born elsewhere 42.7% of residents of Milford speak English at home.
45.4% of residents speak Spanish at home 274 69.4% Speak English very well121 30.6% Speak English less than very well8.8% of residents speak other language at home 77 100.0% Speak English very well
English speakers - Foreign-born 5.2% of residents of Milford speak English at home.
27.5% of residents speak Spanish at home 258 12.1% Speak English very well1,881 87.9% Speak English less than very well72.0% of residents speak other language at home 2,105 37.5% Speak English very well3,505 62.5% Speak English less than very well
White (Caucasian) - Speak only English Native:
94.9% (14,485)Foreign-born:
7.3% (166)
White (Caucasian) - Speak another language Native:
4.9% (755)Foreign-born:
94.2% (2,143)
Black or African American - Speak only English Native:
89.1% (549)Foreign-born:
3.1% (14)
Black or African American - Speak another language Native:
9.6% (59)Foreign-born:
99.2% (439)
American Indian / Alaska Native - Speak another language Native:
100.0% (43)Foreign-born:
100.0% (419)
Asian - Speak only English Native:
20.2% (32)Foreign-born:
9.7% (54)
Asian - Speak another language Native:
81.5% (131)Foreign-born:
90.3% (506)
Other race - Speak only English Native:
15.8% (131)Foreign-born:
1.0% (20)
Other race - Speak another language Native:
84.5% (700)Foreign-born:
95.1% (1,991)
Two or more races - Speak only English Native:
38.8% (509)Foreign-born:
6.2% (185)
Two or more races - Speak another language Native:
63.8% (837)Foreign-born:
94.0% (2,804)
White alone - Speak only English Native:
95.3% (14,365)Foreign-born:
7.8% (169)
White alone - Speak another language Native:
4.6% (687)Foreign-born:
95.6% (2,062)
Hispanic or Latino - Speak only English Native:
26.6% (367)Foreign-born:
0.6% (13)
Hispanic or Latino - Speak another language Native:
73.5% (1,014)Foreign-born:
97.9% (2,188)
Foreign-born residents in Milford 7,739 residents are foreign born (19.1% Latin America , 4.0% Europe ).
This city:
27.9%Massachusetts:
17.6%
Marital status for residents in Milford Marital status - White (Caucasian) population 15 years and over
Males 32.6% Never married54.5% Now married1.3% Separated2.5% Widowed9.0% DivorcedFemales 23.5% Never married51.2% Now married2.5% Separated10.4% Widowed12.3% DivorcedWomen who gave birth in the past 12 months Now married:
69.3% (190)Unmarried:
30.7% (84)
Women who did not give birth in the past 12 months Now married:
52.2% (1,779)Unmarried:
47.8% (1,628)
Marital status - Black or African American population 15 years and over
Males 24.3% Never married59.1% Now married0.0% Separated1.0% Widowed15.6% DivorcedFemales 26.7% Never married63.1% Now married0.0% Separated0.0% Widowed10.2% DivorcedWomen who gave birth in the past 12 months Now married:
100.0% (8)Unmarried:
0.0% (0)
Women who did not give birth in the past 12 months Now married:
44.4% (77)Unmarried:
55.6% (97)
Marital status - American Indian / Alaska Native population 15 years and over
Males 88.9% Never married11.1% Now married0.0% Separated0.0% Widowed0.0% DivorcedFemales 21.7% Never married57.8% Now married0.0% Separated10.8% Widowed9.6% DivorcedWomen who did not give birth in the past 12 months Now married:
64.9% (57)Unmarried:
35.1% (31)
Marital status - Asian population 15 years and over
Males 42.8% Never married54.0% Now married0.0% Separated0.0% Widowed3.2% DivorcedFemales 32.1% Never married60.6% Now married0.0% Separated0.0% Widowed7.3% DivorcedWomen who did not give birth in the past 12 months Now married:
41.0% (83)Unmarried:
59.0% (120)
Marital status - Other race population 15 years and over
Males 53.9% Never married37.1% Now married0.0% Separated0.0% Widowed9.0% DivorcedFemales 41.8% Never married35.8% Now married3.8% Separated4.7% Widowed13.9% DivorcedWomen who did not give birth in the past 12 months Now married:
26.9% (274)Unmarried:
73.1% (745)
Marital status - Two or more races population 15 years and over
Males 37.6% Never married53.5% Now married3.5% Separated0.0% Widowed5.5% DivorcedFemales 32.0% Never married53.9% Now married0.0% Separated1.2% Widowed12.9% DivorcedWomen who gave birth in the past 12 months Now married:
100.0% (55)Unmarried:
0.0% (0)
Women who did not give birth in the past 12 months Now married:
49.3% (453)Unmarried:
50.7% (466)
Marital status - White alone, not Hispanic / Latino population 15 years and over
Males 32.7% Never married53.9% Now married1.4% Separated2.6% Widowed9.4% DivorcedFemales 22.8% Never married52.0% Now married2.1% Separated11.0% Widowed12.1% DivorcedWomen who gave birth in the past 12 months Now married:
68.2% (187)Unmarried:
31.8% (87)
Women who did not give birth in the past 12 months Now married:
52.8% (1,701)Unmarried:
47.2% (1,518)
Marital status - Hispanic or Latino population 15 years and over
Males 51.3% Never married47.6% Now married0.0% Separated0.0% Widowed1.1% DivorcedFemales 40.6% Never married42.5% Now married3.5% Separated5.2% Widowed8.2% DivorcedWomen who gave birth in the past 12 months Now married:
100.0% (19)Unmarried:
0.0% (0)
Women who did not give birth in the past 12 months Now married:
34.5% (328)Unmarried:
65.5% (623)
Ancestries in Milford
4,492 29.0% Brazilian1,595 10.3% Irish1,527 9.9% Italian1,154 7.5% Portuguese624 4.0% French Canadian561 3.6% English527 3.4% American258 1.7% French254 1.6% Haitian216 1.4% Polish194 1.3% Greek193 1.2% German161 1.0% Scottish135 0.9% European96 0.6% Eastern European91 0.6% Moroccan88 0.6% Egyptian73 0.5% Guyanese59 0.4% Lebanese49 0.3% Armenian33 0.2% Russian26 0.2% Canadian25 0.2% Swedish22 0.1% British16 0.1% Dutch16 0.1% African15 0.10% Bulgarian13 0.08% Arab12 0.08% Trinidadian and Tobagonian11 0.07% Yugoslavian10 0.06% Syrian8 0.05% Lithuanian8 0.05% Scotch-Irish5 0.03% Ghanaian5 0.03% Welsh
Geographical mobility in Milford Same house 1 year ago 17,139 91.5% White (Caucasian)823 76.7% Black or African American365 100.0% American Indian / Alaska Native704 96.1% Asian2,577 80.7% Other race3,287 84.5% Two or more races16,764 91.4% White alone, not Hispanic / Latino3,197 90.6% Hispanic or LatinoMoved within same county 567 3.0% White / Caucasian24 2.3% Black or African American321 10.1% Other race65 1.7% Two or more races533 2.9% White alone, not Hispanic / Latino163 4.6% Hispanic or LatinoMoved within same state 777 4.1% White / Caucasian290 27.0% Black or African American22 3.0% Asian21 0.5% Two or more races745 4.1% White alone, not Hispanic / Latino82 2.3% Hispanic or LatinoMoved from different state 181 1.0% White / Caucasian18 0.5% Two or more races191 1.0% White alone, not Hispanic / Latino10 0.3% Hispanic or LatinoMoved from abroad 129 0.7% White570 17.9% Other race706 18.2% Two or more races174 0.9% White alone, not Hispanic / Latino89 2.5% Hispanic or Latino
Children Nativity (place of birth) in Milford
Children under 6 years - Living with two parents Both parents native 914 99.4% Native5 0.6% Foreign-bornBoth parents foreign-born 507 67.0% Native249 33.0% Foreign-bornOne native, one foreign-born parent 101 100.0% NativeChildren under 6 years - Living with one parent Native parent 104 100.0% NativeForeign-born parent 255 78.5% Native70 21.5% Foreign-bornChildren 6 to 17 years - Living with two parents Both parents native 500 98.6% Native7 1.4% Foreign-bornBoth parents foreign-born 1,172 83.2% Native237 16.8% Foreign-bornOne native, one foreign-born parent 142 100.0% NativeChildren 6 to 17 years - Living with one parent Native parent 44 7.9% Native507 92.1% Foreign-bornForeign-born parent 714 84.3% Native133 15.7% Foreign-born
Grandparents responsible for own grandchildren in Milford
Grandparents (30 to 59 years) White / Caucasian 19 17.0% Responsible for grandchildren93 83.0% Not responsible for grandchildrenOther race 30 100.0% Not responsible for grandchildrenTwo or more races 32 100.0% Not responsible for grandchildrenWhite alone, not Hispanic / Latino 5 7.0% Responsible for grandchildren66 93.0% Not responsible for grandchildrenHispanic or Latino 13 9.5% Responsible for grandchildren122 90.5% Not responsible for grandchildren
Grandparents (60 years and over) White / Caucasian 105 100.0% Not responsible for grandchildrenTwo or more races 26 100.0% Not responsible for grandchildrenWhite alone, not Hispanic / Latino 110 100.0% Not responsible for grandchildrenHispanic or Latino 11 100.0% Not responsible for grandchildren