Races in Lynn, Massachusetts (MA) Detailed Stats
Data:
Races - White alone (%)
Races - White alone (% change since 2000)
Races - Black alone (%)
Races - Black alone (% change since 2000)
Races - American Indian alone (%)
Races - American Indian alone (% change since 2000)
Races - Asian alone (%)
Races - Asian alone (% change since 2000)
Races - Hispanic (%)
Races - Hispanic (% change since 2000)
Races - Native Hawaiian and Other Pacific Islander alone (%)
Races - Native Hawaiian and Other Pacific Islander alone (% change since 2000)
Races - Two or more races(%)
Races - Two or more races(% change since 2000)
Races - Other race alone (%)
Races - Other race alone (% change since 2000)
Racial diversity
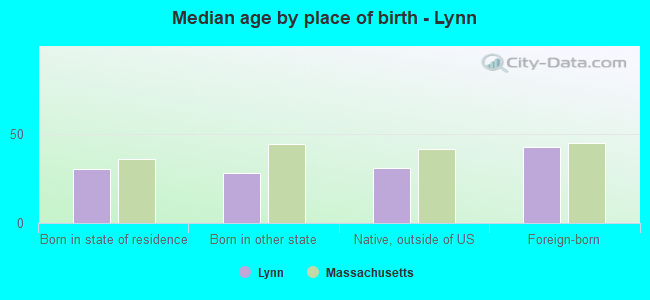
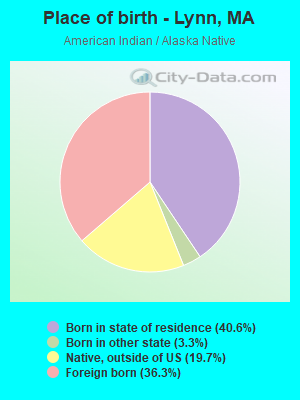
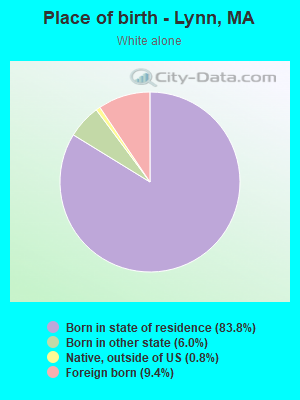
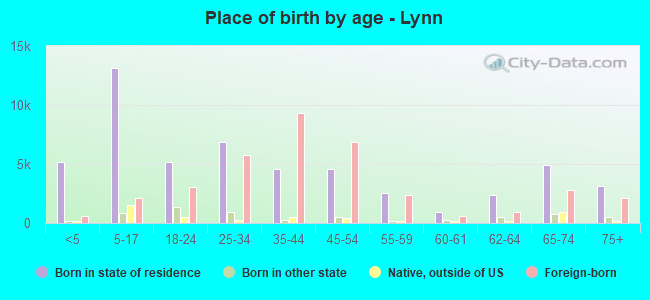
Place of birth - Born in state of residence (%)
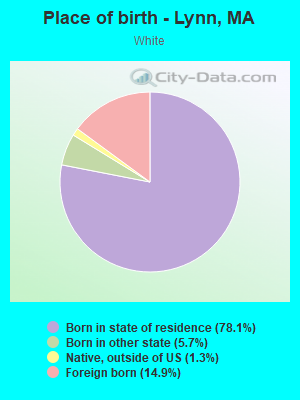
Place of birth - Born in state of residence (%) - White
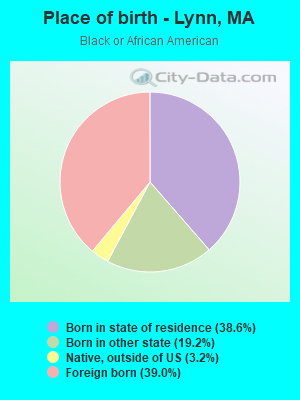
Place of birth - Born in state of residence (%) - Black or African American
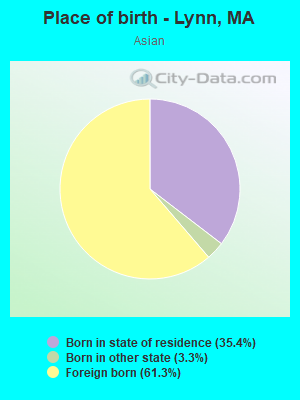
Place of birth - Born in state of residence (%) - Asian
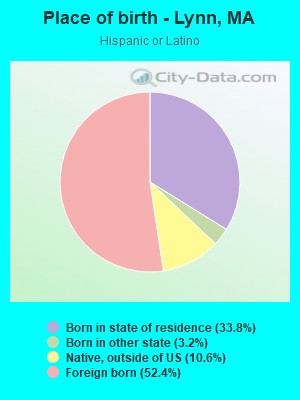
Place of birth - Born in state of residence (%) - Hispanic or Latino
Place of birth - Born in state of residence (%) - American Indian and Alaska Native
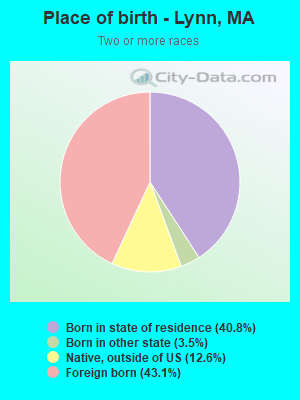
Place of birth - Born in state of residence (%) - Multirace
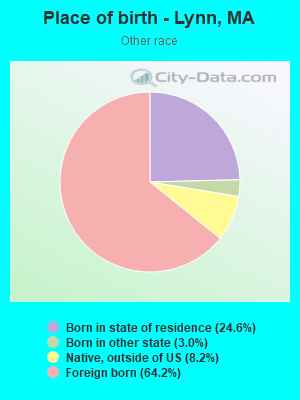
Place of birth - Born in state of residence (%) - Other Race
Place of birth - Born in other state (%)
Place of birth - Born in other state (%) - White
Place of birth - Born in other state (%) - Black or African American
Place of birth - Born in other state (%) - Asian
Place of birth - Born in other state (%) - Hispanic or Latino
Place of birth - Born in other state (%) - American Indian and Alaska Native
Place of birth - Born in other state (%) - Multirace
Place of birth - Born in other state (%) - Other Race
Place of birth - Native, outside of US (%)
Place of birth - Native, outside of US (%) - White
Place of birth - Native, outside of US (%) - Black or African American
Place of birth - Native, outside of US (%) - Asian
Place of birth - Native, outside of US (%) - Hispanic or Latino
Place of birth - Native, outside of US (%) - American Indian and Alaska Native
Place of birth - Native, outside of US (%) - Multirace
Place of birth - Native, outside of US (%) - Other Race
Place of birth - Foreign born (%)
Place of birth - Foreign born (%) - White
Place of birth - Foreign born (%) - Black or African American
Place of birth - Foreign born (%) - Asian
Place of birth - Foreign born (%) - Hispanic or Latino
Place of birth - Foreign born (%) - American Indian and Alaska Native
Place of birth - Foreign born (%) - Multirace
Place of birth - Foreign born (%) - Other Race
Residents speaking English at home (%)
Residents speaking English at home - Born in the United States (%)
Residents speaking English at home - Native, born elsewhere (%)
Residents speaking English at home - Foreign born (%)
Residents speaking Spanish at home (%)
Residents speaking Spanish at home - Born in the United States (%)
Residents speaking Spanish at home - Native, born elsewhere (%)
Residents speaking Spanish at home - Foreign born (%)
Residents speaking other language at home (%)
Residents speaking other language at home - Born in the United States (%)
Residents speaking other language at home - Native, born elsewhere (%)
Residents speaking other language at home - Foreign born (%)
Marital status - Never married (%)
Marital status - Now married (%)
Marital status - Separated (%)
Marital status - Widowed (%)
Marital status - Divorced (%)
Ancestries Reported - Arab (%)
Ancestries Reported - Czech (%)
Ancestries Reported - Danish (%)
Ancestries Reported - Dutch (%)
Ancestries Reported - English (%)
Ancestries Reported - French (%)
Ancestries Reported - French Canadian (%)
Ancestries Reported - German (%)
Ancestries Reported - Greek (%)
Ancestries Reported - Hungarian (%)
Ancestries Reported - Irish (%)
Ancestries Reported - Italian (%)
Ancestries Reported - Lithuanian (%)
Ancestries Reported - Norwegian (%)
Ancestries Reported - Polish (%)
Ancestries Reported - Portuguese (%)
Ancestries Reported - Russian (%)
Ancestries Reported - Scotch-Irish (%)
Ancestries Reported - Scottish (%)
Ancestries Reported - Slovak (%)
Ancestries Reported - Subsaharan African (%)
Ancestries Reported - Swedish (%)
Ancestries Reported - Swiss (%)
Ancestries Reported - Ukrainian (%)
Ancestries Reported - United States (%)
Ancestries Reported - Welsh (%)
Ancestries Reported - West Indian (%)
Ancestries Reported - Other (%)
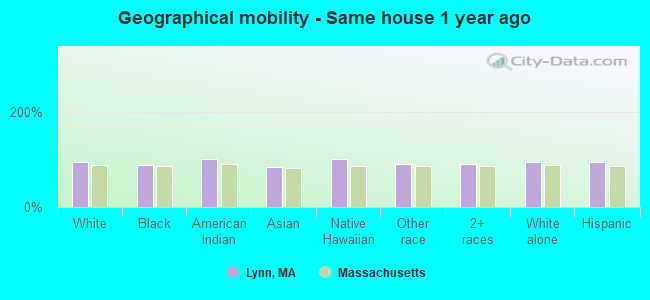
Geographical mobility - Same house 1 year ago (%)
Geographical mobility - Same house 1 year ago (%) - White
Geographical mobility - Same house 1 year ago (%) - Black or African American
Geographical mobility - Same house 1 year ago (%) - Asian
Geographical mobility - Same house 1 year ago (%) - Hispanic or Latino
Geographical mobility - Same house 1 year ago (%) - American Indian and Alaska Native
Geographical mobility - Same house 1 year ago (%) - Multirace
Geographical mobility - Same house 1 year ago (%) - Other Race
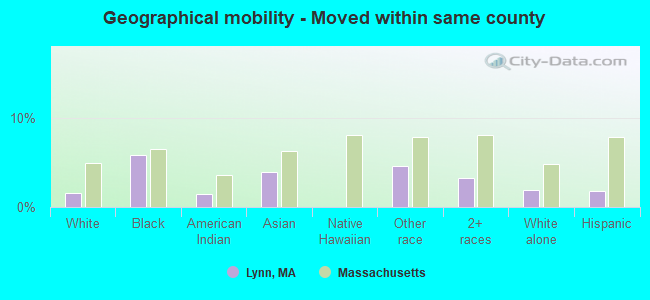
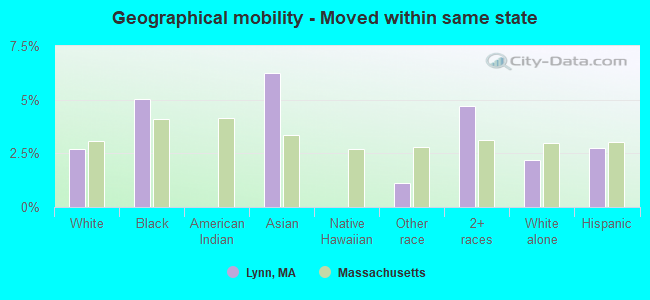
Geographical mobility - Moved within same county (%)
Geographical mobility - Moved within same county (%) - White
Geographical mobility - Moved within same county (%) - Black or African American
Geographical mobility - Moved within same county (%) - Asian
Geographical mobility - Moved within same county (%) - Hispanic or Latino
Geographical mobility - Moved within same county (%) - American Indian and Alaska Native
Geographical mobility - Moved within same county (%) - Multirace
Geographical mobility - Moved within same county (%) - Other Race
Geographical mobility - Moved from different county within same state (%)
Geographical mobility - Moved from different county within same state (%) - White
Geographical mobility - Moved from different county within same state (%) - Black or African American
Geographical mobility - Moved from different county within same state (%) - Asian
Geographical mobility - Moved from different county within same state (%) - Hispanic or Latino
Geographical mobility - Moved from different county within same state (%) - American Indian and Alaska Native
Geographical mobility - Moved from different county within same state (%) - Multirace
Geographical mobility - Moved from different county within same state (%) - Other Race
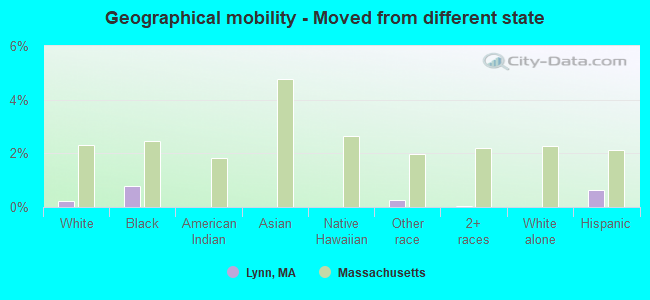
Geographical mobility - Moved from different state (%)
Geographical mobility - Moved from different state (%) - White
Geographical mobility - Moved from different state (%) - Black or African American
Geographical mobility - Moved from different state (%) - Asian
Geographical mobility - Moved from different state (%) - Hispanic or Latino
Geographical mobility - Moved from different state (%) - American Indian and Alaska Native
Geographical mobility - Moved from different state (%) - Multirace
Geographical mobility - Moved from different state (%) - Other Race
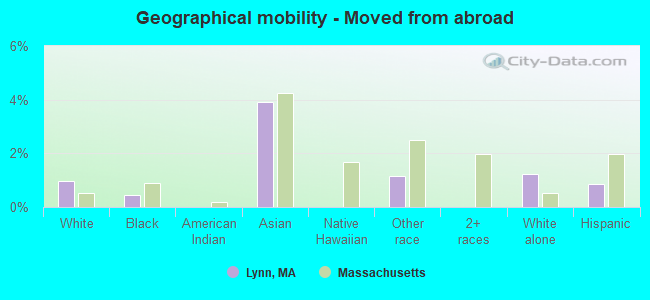
Geographical mobility - Moved from abroad (%)
Geographical mobility - Moved from abroad (%) - White
Geographical mobility - Moved from abroad (%) - Black or African American
Geographical mobility - Moved from abroad (%) - Asian
Geographical mobility - Moved from abroad (%) - Hispanic or Latino
Geographical mobility - Moved from abroad (%) - American Indian and Alaska Native
Geographical mobility - Moved from abroad (%) - Multirace
Geographical mobility - Moved from abroad (%) - Other Race
Place of birth for the foreign-born population - Ireland (%)
Place of birth for the foreign-born population - Denmark (%)
Place of birth for the foreign-born population - Norway (%)
Place of birth for the foreign-born population - Sweden (%)
Place of birth for the foreign-born population - United Kingdom (%)
Place of birth for the foreign-born population - England (%)
Place of birth for the foreign-born population - Scotland (%)
Place of birth for the foreign-born population - Other Northern Europe (%)
Place of birth for the foreign-born population - Austria (%)
Place of birth for the foreign-born population - Belgium (%)
Place of birth for the foreign-born population - France (%)
Place of birth for the foreign-born population - Germany (%)
Place of birth for the foreign-born population - Netherlands (%)
Place of birth for the foreign-born population - Switzerland (%)
Place of birth for the foreign-born population - Other Western Europe (%)
Place of birth for the foreign-born population - Greece (%)
Place of birth for the foreign-born population - Italy (%)
Place of birth for the foreign-born population - Portugal (%)
Place of birth for the foreign-born population - Spain (%)
Place of birth for the foreign-born population - Other Southern Europe (%)
Place of birth for the foreign-born population - Albania (%)
Place of birth for the foreign-born population - Belarus (%)
Place of birth for the foreign-born population - Bosnia and Herzegovina (%)
Place of birth for the foreign-born population - Bulgaria (%)
Place of birth for the foreign-born population - Croatia (%)
Place of birth for the foreign-born population - Czechoslovakia (%)
Place of birth for the foreign-born population - Hungary (%)
Place of birth for the foreign-born population - Latvia (%)
Place of birth for the foreign-born population - Lithuania (%)
Place of birth for the foreign-born population - North Macedonia (Macedonia) (%)
Place of birth for the foreign-born population - Moldova (%)
Place of birth for the foreign-born population - Poland (%)
Place of birth for the foreign-born population - Romania (%)
Place of birth for the foreign-born population - Russia (%)
Place of birth for the foreign-born population - Serbia (%)
Place of birth for the foreign-born population - Ukraine (%)
Place of birth for the foreign-born population - Other Eastern Europe (%)
Place of birth for the foreign-born population - China (%)
Place of birth for the foreign-born population - Hong Kong (%)
Place of birth for the foreign-born population - Taiwan (%)
Place of birth for the foreign-born population - Japan (%)
Place of birth for the foreign-born population - Korea (%)
Place of birth for the foreign-born population - Other Eastern Asia (%)
Place of birth for the foreign-born population - Afghanistan (%)
Place of birth for the foreign-born population - Bangladesh (%)
Place of birth for the foreign-born population - India (%)
Place of birth for the foreign-born population - Iran (%)
Place of birth for the foreign-born population - Kazakhstan (%)
Place of birth for the foreign-born population - Nepal (%)
Place of birth for the foreign-born population - Pakistan (%)
Place of birth for the foreign-born population - Sri Lanka (%)
Place of birth for the foreign-born population - Uzbekistan (%)
Place of birth for the foreign-born population - Other South Central Asia (%)
Place of birth for the foreign-born population - Burma (%)
Place of birth for the foreign-born population - Cambodia (%)
Place of birth for the foreign-born population - Indonesia (%)
Place of birth for the foreign-born population - Laos (%)
Place of birth for the foreign-born population - Malaysia (%)
Place of birth for the foreign-born population - Philippines (%)
Place of birth for the foreign-born population - Singapore (%)
Place of birth for the foreign-born population - Thailand (%)
Place of birth for the foreign-born population - Vietnam (%)
Place of birth for the foreign-born population - Other South Eastern Asia (%)
Place of birth for the foreign-born population - Armenia (%)
Place of birth for the foreign-born population - Iraq (%)
Place of birth for the foreign-born population - Israel (%)
Place of birth for the foreign-born population - Jordan (%)
Place of birth for the foreign-born population - Kuwait (%)
Place of birth for the foreign-born population - Lebanon (%)
Place of birth for the foreign-born population - Saudi Arabia (%)
Place of birth for the foreign-born population - Syria (%)
Place of birth for the foreign-born population - Turkey (%)
Place of birth for the foreign-born population - Yemen (%)
Place of birth for the foreign-born population - Other Western Asia (%)
Place of birth for the foreign-born population - Eritrea (%)
Place of birth for the foreign-born population - Ethiopia (%)
Place of birth for the foreign-born population - Kenya (%)
Place of birth for the foreign-born population - Somalia (%)
Place of birth for the foreign-born population - Uganda (%)
Place of birth for the foreign-born population - Zimbabwe (%)
Place of birth for the foreign-born population - Other Eastern Africa (%)
Place of birth for the foreign-born population - Cameroon (%)
Place of birth for the foreign-born population - Congo (%)
Place of birth for the foreign-born population - Democratic Republic of Congo (Zaire) (%)
Place of birth for the foreign-born population - Other Middle Africa (%)
Place of birth for the foreign-born population - Egypt (%)
Place of birth for the foreign-born population - Morocco (%)
Place of birth for the foreign-born population - Sudan (%)
Place of birth for the foreign-born population - Other Northern Africa (%)
Place of birth for the foreign-born population - South Africa (%)
Place of birth for the foreign-born population - Other Southern Africa (%)
Place of birth for the foreign-born population - Cabo Verde (%)
Place of birth for the foreign-born population - Ghana (%)
Place of birth for the foreign-born population - Liberia (%)
Place of birth for the foreign-born population - Nigeria (%)
Place of birth for the foreign-born population - Senegal (%)
Place of birth for the foreign-born population - Sierra Leone (%)
Place of birth for the foreign-born population - Other Western Africa (%)
Place of birth for the foreign-born population - Australia (%)
Place of birth for the foreign-born population - New Zealand (%)
Place of birth for the foreign-born population - Fiji (%)
Place of birth for the foreign-born population - Micronesia (%)
Place of birth for the foreign-born population - Bahamas (%)
Place of birth for the foreign-born population - Barbados (%)
Place of birth for the foreign-born population - Cuba (%)
Place of birth for the foreign-born population - Dominica (%)
Place of birth for the foreign-born population - Dominican Republic (%)
Place of birth for the foreign-born population - Grenada (%)
Place of birth for the foreign-born population - Haiti (%)
Place of birth for the foreign-born population - Jamaica (%)
Place of birth for the foreign-born population - St. Vincent and the Grenadines (%)
Place of birth for the foreign-born population - Trinidad and Tobago (%)
Place of birth for the foreign-born population - West Indies (%)
Place of birth for the foreign-born population - Other Caribbean (%)
Place of birth for the foreign-born population - Belize (%)
Place of birth for the foreign-born population - Costa Rica (%)
Place of birth for the foreign-born population - El Salvador (%)
Place of birth for the foreign-born population - Guatemala (%)
Place of birth for the foreign-born population - Honduras (%)
Place of birth for the foreign-born population - Mexico (%)
Place of birth for the foreign-born population - Nicaragua (%)
Place of birth for the foreign-born population - Panama (%)
Place of birth for the foreign-born population - Other Central America (%)
Place of birth for the foreign-born population - Argentina (%)
Place of birth for the foreign-born population - Bolivia (%)
Place of birth for the foreign-born population - Brazil (%)
Place of birth for the foreign-born population - Chile (%)
Place of birth for the foreign-born population - Colombia (%)
Place of birth for the foreign-born population - Ecuador (%)
Place of birth for the foreign-born population - Guyana (%)
Place of birth for the foreign-born population - Peru (%)
Place of birth for the foreign-born population - Uruguay (%)
Place of birth for the foreign-born population - Venezuela (%)
Place of birth for the foreign-born population - Other South America (%)
Place of birth for the foreign-born population - Canada (%)
Place of birth for the foreign-born population - Other Northern America (%)
Place of birth for the foreign-born population - Other (%)
Latest news about races in Lynn, MA collected exclusively by city-data.com from local newspapers, TV, and radio stations
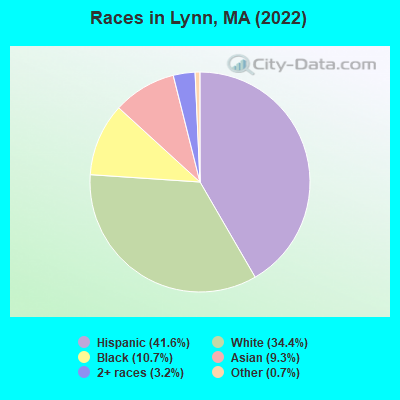
According to 2022 data, the most numerous races in Lynn, MA are White alone (34,701 residents), Hispanic (41,977 residents), and Asian alone (9,430 residents). 46.9% of Lynn residents speak English at home. 37.0% of Lynn, MA residents are foreign-born (26.1% born in Latin America, 3.8% born in Asia), which is 51.4% greater than the foreign-born rate of 18.0% across the entire state of Massachusetts.
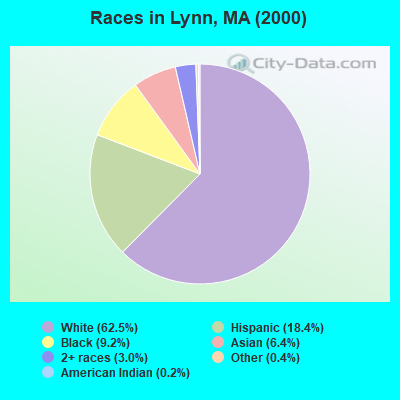
Race distribution in Lynn
2000 2022
55,630 62.5% White alone 16,383 18.4% Hispanic 8,165 9.2% Black alone 5,686 6.4% Asian alone 2,630 3.0% Two or more races 349 0.4% Other race alone 168 0.2% American Indian alone 39 0.04% Native Hawaiian and Other
41,977 41.6% Hispanic 34,701 34.4% White alone 10,810 10.7% Black alone 9,430 9.3% Asian alone 3,252 3.2% Two or more races 696 0.7% Other race alone 26 0.03% American Indian alone
2000 2022
5,198,359 81.9% White alone 428,729 6.8% Hispanic 318,329 5.0% Black alone 236,786 3.7% Asian alone 110,338 1.7% Two or more races 43,586 0.7% Other race alone 11,264 0.2% American Indian alone 1,706 0.03% Native Hawaiian and Other
4,676,627 67.0% White alone 911,038 13.0% Hispanic 501,463 7.2% Asian alone 459,740 6.6% Black alone 341,889 4.9% Two or more races 84,403 1.2% Other race alone 5,838 0.08% American Indian alone 976 0.01% Native Hawaiian and Other
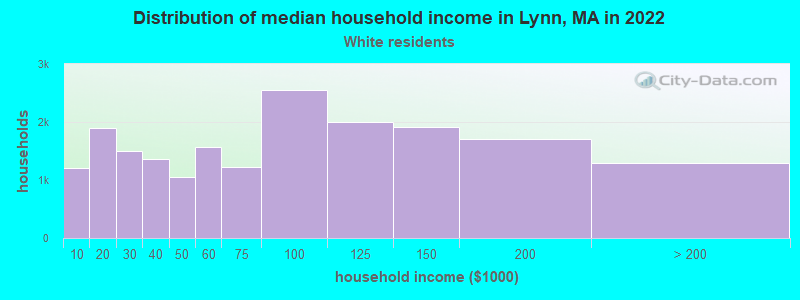
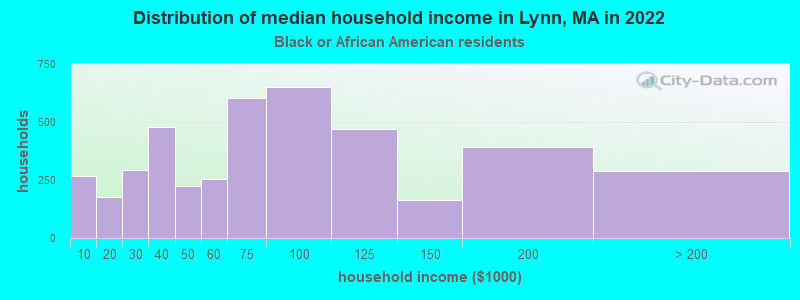
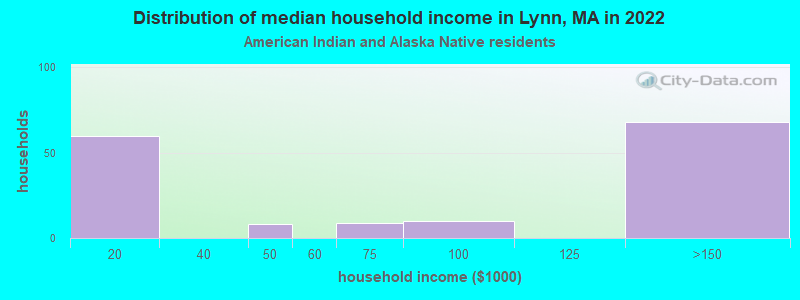
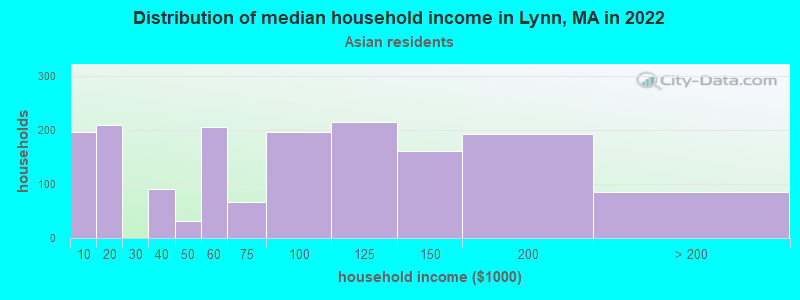
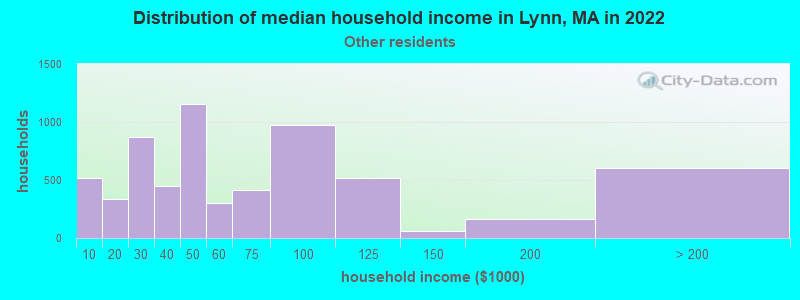
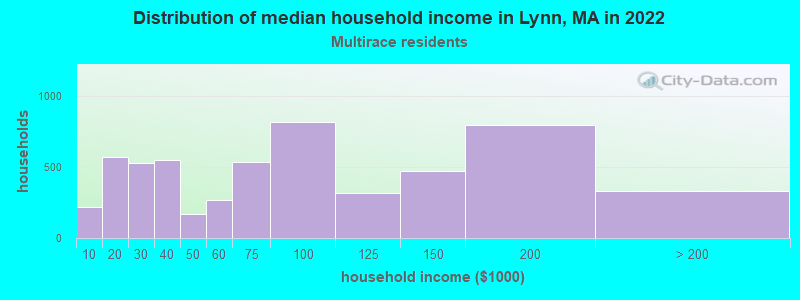
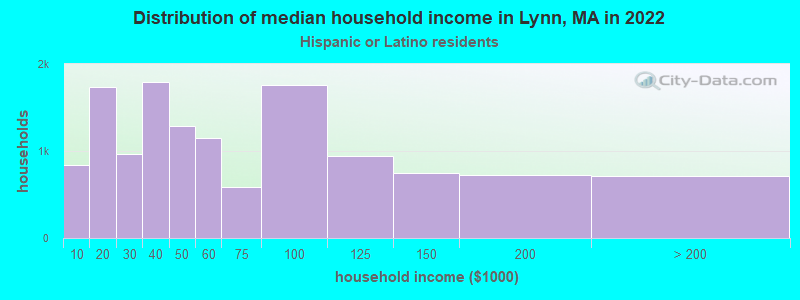
Income and house value in Lynn Median household income in 2022 $74,808 White non-Hispanic householders$69,603 Black householders$105,713 Asian householders$44,607 Some other race householders$39,652 Two or more races householders$49,978 Hispanic or Latino race householdersMedian 2022 house value $476,080 White Non-Hispanic householders$422,456 Black or African American householders $506,162 Asian householders$515,645 Some other race householders$530,032 Two or more races householders$475,753 Hispanic or Latino householders
Median age by race in Lynn
45.0 Median age for White residents44.0 45.2 27.5 Median age for Black or African American residents26.3 31.9 37.3 Median age for American Indian / Alaska Native residents-666,666,666.0 15.5 33.0 Median age for Asian residents32.2 34.6 -666,666,666.0 Median age for Native Hawaiian / Pacific Islander residents-666,666,666.0 -666,666,666.0 32.2 Median age for Other race residents29.7 35.4 36.0 Median age for Two or more races residents37.4 31.6 53.6 Median age for White alone residents53.5 53.7 30.2 Median age for Hispanic or Latino residents30.1 30.3
Owner/renter occupied households by race in Lynn
House owners and renters - White residents 11,730 60.8% Owner occupied7,553 39.2% Renter occupiedHouse owners and renters - Black or African American residents 1,618 45.8% Owner occupied1,912 54.2% Renter occupiedHouse owners and renters - American Indian / Alaska Native residents 105 52.9% Owner occupied94 47.1% Renter occupiedHouse owners and renters - Asian residents 1,028 45.8% Owner occupied1,215 54.2% Renter occupiedHouse owners and renters - Native Hawaiian / Pacific Islander residents 95 100.0% Owner occupiedHouse owners and renters - Other race residents 1,910 30.0% Owner occupied4,459 70.0% Renter occupiedHouse owners and renters - Two or more races residents 1,696 34.2% Owner occupied3,270 65.8% Renter occupiedHouse owners and renters - White alone residents 10,750 64.0% Owner occupied6,042 36.0% Renter occupiedHouse owners and renters - Hispanic or Latino residents 4,565 34.5% Owner occupied8,680 65.5% Renter occupied
Language usage in Lynn
English speakers - Total 46.9% of residents of Lynn speak English at home.
35.8% of residents speak Spanish at home 14,455 42.6% Speak English very well19,474 57.4% Speak English less than very well17.4% of residents speak other language at home 7,686 46.6% Speak English very well8,794 53.4% Speak English less than very well
English speakers - Born in the United States 83.7% of residents of Lynn speak English at home.
12.5% of residents speak Spanish at home 694 90.2% Speak English very well75 9.8% Speak English less than very well3.8% of residents speak other language at home 234 100.0% Speak English very well
English speakers - Native, born elsewhere 24.2% of residents of Lynn speak English at home.
70.5% of residents speak Spanish at home 1,711 52.4% Speak English very well1,557 47.6% Speak English less than very well5.4% of residents speak other language at home 123 49.4% Speak English very well126 50.6% Speak English less than very well
English speakers - Foreign-born 8.5% of residents of Lynn speak English at home.
57.6% of residents speak Spanish at home 3,597 17.4% Speak English very well17,065 82.6% Speak English less than very well34.0% of residents speak other language at home 4,535 37.2% Speak English very well7,654 62.8% Speak English less than very well
White (Caucasian) - Speak only English Native:
83.7% (29,778)Foreign-born:
9.8% (641)
White (Caucasian) - Speak another language Native:
16.3% (5,793)Foreign-born:
90.2% (5,883)
Black or African American - Speak only English Native:
80.7% (5,048)Foreign-born:
17.5% (808)
Black or African American - Speak another language Native:
19.3% (1,210)Foreign-born:
82.5% (3,808)
American Indian / Alaska Native - Speak another language Native:
100.0% (307)Foreign-born:
100.0% (428)
Asian - Speak only English Native:
51.9% (1,597)Foreign-born:
7.9% (448)
Asian - Speak another language Native:
48.1% (1,480)Foreign-born:
92.1% (5,245)
Other race - Speak only English Native:
29.7% (1,867)Foreign-born:
1.6% (205)
Other race - Speak another language Native:
70.3% (4,412)Foreign-born:
98.4% (12,682)
Two or more races - Speak only English Native:
44.3% (3,109)Foreign-born:
15.6% (933)
Two or more races - Speak another language Native:
55.7% (3,911)Foreign-born:
84.4% (5,037)
White alone - Speak only English Native:
94.0% (29,049)Foreign-born:
20.0% (641)
White alone - Speak another language Native:
6.0% (1,855)Foreign-born:
80.0% (2,571)
Hispanic or Latino - Speak only English Native:
22.5% (3,856)Foreign-born:
5.3% (1,148)
Hispanic or Latino - Speak another language Native:
77.5% (13,255)Foreign-born:
94.7% (20,412)
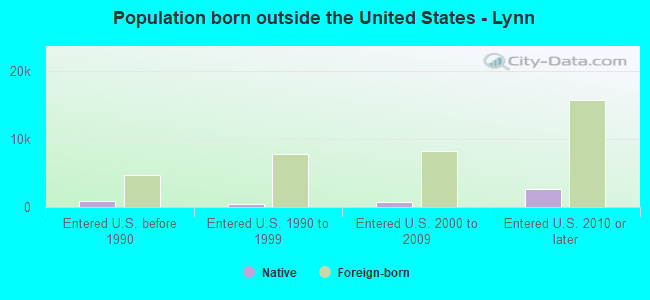
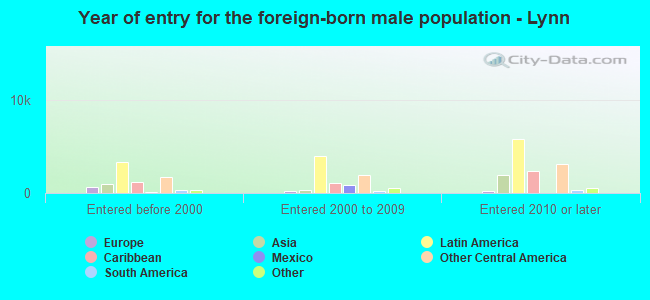
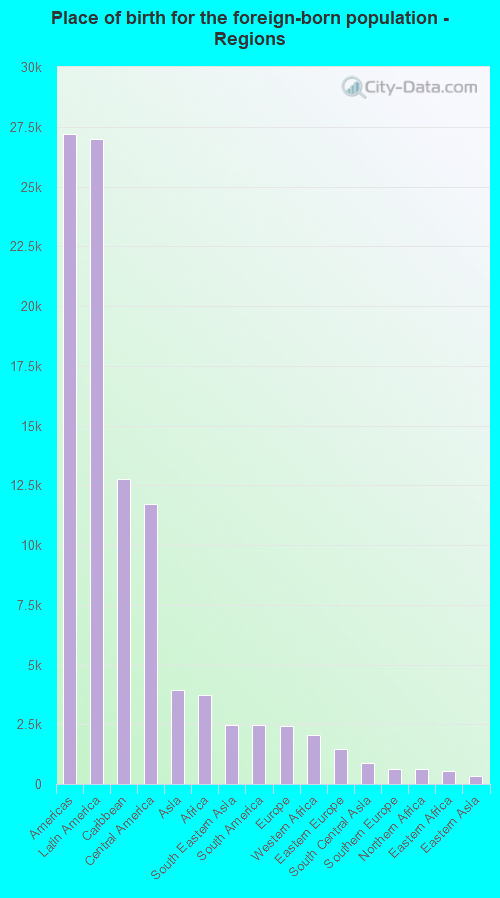
Foreign-born residents in Lynn 37,274 residents are foreign born (26.1% Latin America , 3.8% Asia ).
This city:
37.0%Massachusetts:
17.6%
Marital status for residents in Lynn Marital status - White (Caucasian) population 15 years and over
Males 39.6% Never married43.0% Now married0.0% Separated8.8% Widowed8.6% DivorcedFemales 38.9% Never married37.8% Now married2.8% Separated9.2% Widowed11.3% DivorcedWomen who gave birth in the past 12 months Now married:
30.5% (50)Unmarried:
69.5% (114)
Women who did not give birth in the past 12 months Now married:
30.9% (2,744)Unmarried:
69.1% (6,138)
Marital status - Black or African American population 15 years and over
Males 57.8% Never married34.1% Now married0.0% Separated0.8% Widowed7.3% DivorcedFemales 55.2% Never married30.7% Now married3.8% Separated5.9% Widowed4.4% DivorcedWomen who gave birth in the past 12 months Now married:
100.0% (141)Unmarried:
0.0% (0)
Women who did not give birth in the past 12 months Now married:
29.5% (939)Unmarried:
70.5% (2,242)
Marital status - American Indian / Alaska Native population 15 years and over
Males 86.1% Never married13.9% Now married0.0% Separated0.0% Widowed0.0% DivorcedFemales 51.0% Never married15.5% Now married21.4% Separated0.0% Widowed12.1% DivorcedWomen who gave birth in the past 12 months Now married:
0.0% (0)Unmarried:
100.0% (17)
Women who did not give birth in the past 12 months Now married:
37.9% (75)Unmarried:
62.1% (124)
Marital status - Asian population 15 years and over
Males 41.7% Never married46.4% Now married5.1% Separated0.0% Widowed6.8% DivorcedFemales 33.5% Never married44.8% Now married7.9% Separated7.8% Widowed6.0% DivorcedWomen who gave birth in the past 12 months Now married:
100.0% (335)Unmarried:
0.0% (0)
Women who did not give birth in the past 12 months Now married:
42.6% (1,026)Unmarried:
57.4% (1,381)
Marital status - Other race population 15 years and over
Males 56.3% Never married31.0% Now married7.7% Separated0.8% Widowed4.3% DivorcedFemales 30.6% Never married33.8% Now married4.8% Separated10.4% Widowed20.3% DivorcedWomen who gave birth in the past 12 months Now married:
62.1% (280)Unmarried:
37.9% (170)
Women who did not give birth in the past 12 months Now married:
40.8% (2,642)Unmarried:
59.2% (3,829)
Marital status - Two or more races population 15 years and over
Males 48.6% Never married37.9% Now married0.0% Separated0.0% Widowed13.4% DivorcedFemales 54.2% Never married33.7% Now married6.6% Separated1.8% Widowed3.7% DivorcedWomen who gave birth in the past 12 months Now married:
26.6% (87)Unmarried:
73.4% (240)
Women who did not give birth in the past 12 months Now married:
45.4% (1,689)Unmarried:
54.6% (2,033)
Marital status - White alone, not Hispanic / Latino population 15 years and over
Males 40.4% Never married41.0% Now married0.0% Separated9.4% Widowed9.2% DivorcedFemales 37.5% Never married35.3% Now married3.3% Separated10.8% Widowed13.2% DivorcedWomen who gave birth in the past 12 months Now married:
30.5% (50)Unmarried:
69.5% (114)
Women who did not give birth in the past 12 months Now married:
25.4% (1,656)Unmarried:
74.6% (4,853)
Marital status - Hispanic or Latino population 15 years and over
Males 51.2% Never married35.8% Now married3.8% Separated1.4% Widowed7.8% DivorcedFemales 40.4% Never married38.1% Now married4.8% Separated5.8% Widowed11.0% DivorcedWomen who gave birth in the past 12 months Now married:
52.7% (68)Unmarried:
47.3% (61)
Women who did not give birth in the past 12 months Now married:
42.5% (4,569)Unmarried:
57.5% (6,191)
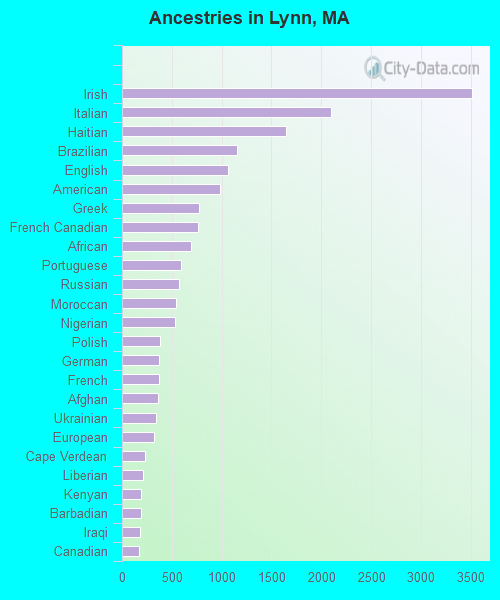
Ancestries in Lynn
3,509 5.9% Irish2,097 3.5% Italian1,647 2.8% Haitian1,153 1.9% Brazilian1,063 1.8% English982 1.6% American777 1.3% Greek762 1.3% French Canadian691 1.2% African593 1.0% Portuguese574 1.0% Russian541 0.9% Moroccan533 0.9% Nigerian377 0.6% Polish373 0.6% German368 0.6% French362 0.6% Afghan346 0.6% Ukrainian317 0.5% European231 0.4% Cape Verdean208 0.3% Liberian192 0.3% Kenyan191 0.3% Barbadian183 0.3% Iraqi174 0.3% Canadian154 0.3% Eastern European132 0.2% Jamaican128 0.2% Scottish127 0.2% Ugandan124 0.2% Albanian100 0.2% Ghanaian98 0.2% Sudanese93 0.2% Romanian81 0.1% Scandinavian77 0.1% Ethiopian70 0.1% Serbian65 0.1% Iranian61 0.1% Trinidadian and Tobagonian58 0.10% Egyptian55 0.09% Swedish50 0.08% British49 0.08% Finnish45 0.08% West Indian44 0.07% Norwegian42 0.07% Armenian41 0.07% Northern European35 0.06% Slovak31 0.05% Yugoslavian29 0.05% British West Indian25 0.04% Soviet Union17 0.03% Palestinian16 0.03% Scotch-Irish15 0.03% Arab10 0.02% Hungarian9 0.02% Celtic7 0.01% Lithuanian5 0.01% Dutch5 0.01% Welsh5 0.01% Bahamian
Geographical mobility in Lynn Same house 1 year ago 41,524 94.6% White (Caucasian)11,341 87.8% Black or African American700 100.0% American Indian / Alaska Native5,235 83.3% Asian88 100.0% Native Hawaiian / Pacific Islander23,109 90.4% Other race14,402 90.4% Two or more races32,728 94.7% White alone, not Hispanic / Latino39,169 94.0% Hispanic or LatinoMoved within same county 666 1.5% White / Caucasian755 5.8% Black or African American10 1.4% American Indian / Alaska Native244 3.9% Asian1,177 4.6% Other race521 3.3% Two or more races666 1.9% White alone, not Hispanic / Latino762 1.8% Hispanic or LatinoMoved within same state 1,189 2.7% White / Caucasian652 5.0% Black or African American394 6.3% Asian289 1.1% Other race752 4.7% Two or more races751 2.2% White alone, not Hispanic / Latino1,137 2.7% Hispanic or LatinoMoved from different state 100 0.2% White / Caucasian101 0.8% Black or African American63 0.2% Other race7 0.0% Two or more races259 0.6% Hispanic or LatinoMoved from abroad 428 1.0% White56 0.4% Black or African American247 3.9% Asian299 1.2% Other race428 1.2% White alone, not Hispanic / Latino353 0.8% Hispanic or Latino
Children Nativity (place of birth) in Lynn
Children under 6 years - Living with two parents Both parents native 658 100.0% NativeBoth parents foreign-born 2,423 94.8% Native134 5.2% Foreign-bornOne native, one foreign-born parent 604 100.0% NativeChildren under 6 years - Living with one parent Native parent 1,080 100.0% NativeForeign-born parent 1,274 74.9% Native427 25.1% Foreign-bornChildren 6 to 17 years - Living with two parents Both parents native 925 100.0% NativeBoth parents foreign-born 4,452 85.4% Native764 14.6% Foreign-bornOne native, one foreign-born parent 454 100.0% NativeChildren 6 to 17 years - Living with one parent Native parent 4,908 100.0% NativeForeign-born parent 3,161 55.5% Native2,533 44.5% Foreign-born
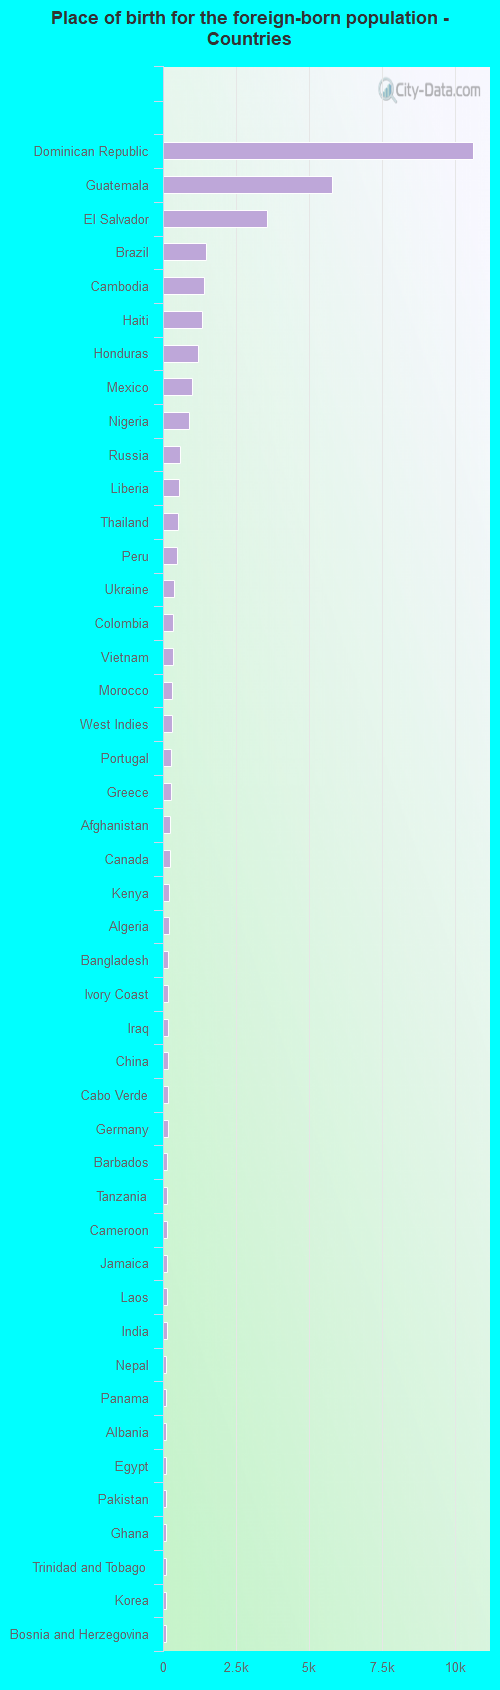
Place of birth for residents in Lynn 27,201 Americas26,969 Latin America12,773 Caribbean11,724 Central America3,935 Asia3,727 Africa2,485 South Eastern Asia2,471 South America2,410 Europe2,056 Western Africa1,473 Eastern Europe870 South Central Asia637 Southern Europe611 Northern Africa553 Eastern Africa341 Eastern Asia232 Western Asia231 Northern America225 China171 Middle Africa167 Western Europe132 Northern Europe10,644 Dominican Republic5,800 Guatemala3,565 El Salvador1,476 Brazil1,402 Cambodia1,351 Haiti1,196 Honduras982 Mexico878 Nigeria593 Russia547 Liberia508 Thailand473 Peru369 Ukraine332 Colombia327 Vietnam304 Morocco300 West Indies273 Portugal270 Greece233 Afghanistan231 Canada213 Kenya202 Algeria188 Bangladesh188 Ivory Coast181 Iraq181 China174 Cabo Verde167 Germany145 Barbados144 Tanzania142 Cameroon141 Jamaica136 Laos129 India115 Nepal113 Panama107 Albania104 Egypt104 Pakistan102 Ghana98 Trinidad and Tobago97 Korea97 Bosnia and Herzegovina94 Philippines92 Ireland92 Uganda84 Azores Islands83 Poland82 Italy67 Moldova67 Bhutan64 Costa Rica61 Guyana53 Eritrea50 Cuba47 Venezuela38 Azerbaijan38 Ecuador37 Hong Kong28 Chile25 Sierra Leone21 England20 Belarus18 Democratic Republic of Congo (Zaire)18 Japan18 Sweden17 Grenada16 Iran15 Indonesia15 Hungary13 Uzbekistan12 Dominica10 Spain10 Zimbabwe9 Ethiopia9 Romania7 Lithuania6 Taiwan
Grandparents responsible for own grandchildren in Lynn
Grandparents (30 to 59 years) White / Caucasian 46 10.8% Responsible for grandchildren379 89.2% Not responsible for grandchildrenBlack or African American 17 43.3% Responsible for grandchildren22 56.7% Not responsible for grandchildrenAsian 26 14.1% Responsible for grandchildren158 85.9% Not responsible for grandchildrenOther race 116 22.5% Responsible for grandchildren399 77.5% Not responsible for grandchildrenTwo or more races 59 33.3% Responsible for grandchildren117 66.7% Not responsible for grandchildrenWhite alone, not Hispanic / Latino 21 4.9% Responsible for grandchildren411 95.1% Not responsible for grandchildrenHispanic or Latino 121 19.9% Responsible for grandchildren486 80.1% Not responsible for grandchildrenGrandparents (60 years and over) White / Caucasian 83 11.9% Responsible for grandchildren614 88.1% Not responsible for grandchildrenBlack or African American 16 8.4% Responsible for grandchildren177 91.6% Not responsible for grandchildrenAsian 3 0.8% Responsible for grandchildren397 99.2% Not responsible for grandchildrenOther race 422 100.0% Not responsible for grandchildrenTwo or more races 23 14.6% Responsible for grandchildren134 85.4% Not responsible for grandchildrenWhite alone, not Hispanic / Latino 95 17.3% Responsible for grandchildren454 82.7% Not responsible for grandchildrenHispanic or Latino 19 2.6% Responsible for grandchildren712 97.4% Not responsible for grandchildren