Races in Lyndhurst, New Jersey (NJ) Detailed Stats
Ancestries, Foreign-born residents, place of birth

Recent posts about races in Lyndhurst, New Jersey on our local forum with over 2,400,000 registered users:
 | Moving from greater Philly area suburb to Northern NJ (73 replies) |
| Buying a house. Should we consider Lodi for a family of 4? (6 replies) |
| Is Lyndhurst Going "Downhill" ? (19 replies) |
| Best location to buy a house in NJ (20 replies) |
| Lyndhurst Diversity (17 replies) |
| The New Jersey Unicorn town (18 replies) |
Latest news about races in Lyndhurst, NJ collected exclusively by city-data.com from local newspapers, TV, and radio stations
17.9% of Lyndhurst, NJ residents are foreign-born (7.8% born in Europe, 5.6% born in Asia, 3.9% born in Latin America), which is 28.1% less than the foreign-born rate of 23.0% across the entire state of New Jersey.
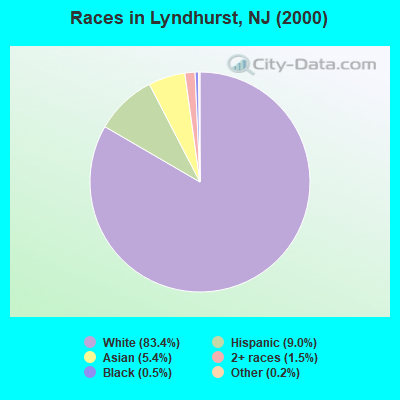
Race distribution in Lyndhurst

- 16,16683.4%White alone
- 1,7449.0%Hispanic
- 1,0425.4%Asian alone
- 2821.5%Two or more races
- 980.5%Black alone
- 430.2%Other race alone
- 70.04%American Indian alone
- 10.01%Native Hawaiian and Other
Pacific Islander alone
2000
2022
-
- 5,557,20966.0%White alone
- 1,117,19113.3%Hispanic
- 1,096,17113.0%Black alone
- 477,0125.7%Asian alone
- 133,6891.6%Two or more races
- 19,5650.2%Other race alone
- 11,3380.1%American Indian alone
- 2,1750.03%Native Hawaiian and Other
Pacific Islander alone

-
- 4,766,47651.5%White alone
- 2,028,47021.9%Hispanic
- 1,111,63212.0%Black alone
- 923,54610.0%Asian alone
- 332,2373.6%Two or more races
- 89,8471.0%Other race alone
- 8,5570.09%American Indian alone
- 9340.01%Native Hawaiian and Other
Pacific Islander alone

Income and house value in Lyndhurst
- Median household income in 2022
- $95,823White non-Hispanic householders
- $169,965Black householders
- $100,906American Indian and Alaska Native householders
- $115,665Asian householders
- $70,768Some other race householders
- $111,495Two or more races householders
- $91,792Hispanic or Latino race householders
- Median 2022 house value
- $439,236White Non-Hispanic householders
- $390,458Black or African American householders
- $390,458American Indian or Alaska Native householders
- $415,928Asian householders
- $437,554Some other race householders
- $443,080Two or more races householders
- $457,017Hispanic or Latino householders
Household income for White non-Hispanic householders

Household income for Black householders

Household income for American Indian and Alaska Native householders

Household income for Asian householders

Household income for Two or more races householders

Household income for Hispanic or Latino race householders

Foreign-born residents in Lyndhurst
3,479 residents are foreign born (7.8% Europe, 5.6% Asia, 3.9% Latin America).
| This city: | 17.9% |
| New Jersey: | 17.5% |
Ancestries in Lyndhurst

- 7,91433.8%Italian
- 3,85616.5%Other
- 3,53815.1%Irish
- 2,39410.2%Polish
- 1,8137.8%German
- 5432.3%Portuguese
- 5132.2%English
- 4141.8%United States
- 2681.1%Scottish
- 2571.1%Dutch
- 2220.9%Scotch-Irish
- 2160.9%French
- 1780.8%Hungarian
- 1760.8%Arab
- 1760.8%Greek
- 1600.7%Ukrainian
- 1520.6%Russian
- 1130.5%Swedish
- 1100.5%Czech
- 970.4%Lithuanian
- 610.3%Norwegian
- 560.2%Slovak
- 460.2%Welsh
- 430.2%Swiss
- 270.1%French Canadian
- 240.1%Danish
- 220.09%West Indian

Zip codes: 07071.