Races in Long Beach, Mississippi (MS) Detailed Stats
Ancestries, Foreign-born residents, place of birth
Settings
X


Recent posts about races in Long Beach, Mississippi on our local forum with over 2,400,000 registered users:
 | Up to 20 gunshots, before CALIFORNIA car crashes THROUGH Jackson home (18 replies) |
| Possibly Gulfport or Biloxi (8 replies) |
| Where should I move to in Mississippi (36 replies) |
| Relocation Assistance near Stennis Space Center (7 replies) |
| Life in Coastal Mississippi? (10 replies) |
| What's So Bad About Mississippi? (236 replies) |
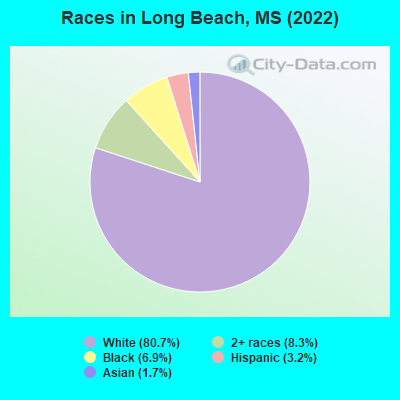
According to 2022 data, the most numerous races in Long Beach, MS are White alone (13,721 residents), Black alone (1,167 residents), and Hispanic (538 residents). 92.9% of Long Beach residents speak English at home. 5.8% of Long Beach, MS residents are foreign-born (2.1% born in Asia, 1.7% born in Europe, 1.0% born in Latin America, 0.9% born in North America), which is 65.5% greater than the foreign-born rate of 2.0% across the entire state of Mississippi.
Race distribution in Long Beach
2000
2022

- 14,90586.1%White alone
- 1,2717.3%Black alone
- 4412.5%Asian alone
- 3972.3%Hispanic
- 2131.2%Two or more races
- 530.3%American Indian alone
- 280.2%Other race alone
- 120.07%Native Hawaiian and Other
Pacific Islander alone

-
- 13,72180.7%White alone
- 1,4078.3%Two or more races
- 1,1676.9%Black alone
- 5383.2%Hispanic
- 2951.7%Asian alone
- 160.09%American Indian alone
2000
2022
-
- 1,727,90860.7%White alone
- 1,028,47336.2%Black alone
- 39,5691.4%Hispanic
- 17,2720.6%Two or more races
- 18,3490.6%Asian alone
- 11,2240.4%American Indian alone
- 1,2940.05%Other race alone
- 5690.02%Native Hawaiian and Other
Pacific Islander alone

-
- 1,625,97955.3%White alone
- 1,072,96236.5%Black alone
- 97,1773.3%Hispanic
- 96,3673.3%Two or more races
- 25,2170.9%Asian alone
- 12,4570.4%American Indian alone
- 9,5010.3%Other race alone
- 3970.01%Native Hawaiian and Other
Pacific Islander alone

Income and house value in Long Beach
- Median household income in 2022
- $68,920White non-Hispanic householders
- $42,497Black householders
- $25,275Asian householders
- $77,551Two or more races householders
- Median 2022 house value
- $209,072White Non-Hispanic householders
- $142,764Black or African American householders
- $144,118Asian householders
- $160,356Some other race householders
- $233,205Two or more races householders
- $192,834Hispanic or Latino householders
Household income for White non-Hispanic householders

Household income for Black householders

Household income for American Indian and Alaska Native householders

Household income for Asian householders

Household income for Two or more races householders

Household income for Hispanic or Latino race householders

Median age by race in Long Beach
- 42.9Median age for White residents
- 38.4Males
- 47.5Females
- 34.9Median age for Black or African American residents
- 37.3Males
- 27.6Females
- 75.1Median age for American Indian / Alaska Native residents
- -661,654,134.7Males
- -624,521,072.2Females
- 61.6Median age for Asian residents
- 38.9Males
- 69.9Females
- -666,666,666.0Median age for Native Hawaiian / Pacific Islander residents
- -668,724,279.2Males
- -670,599,802.7Females
- -529,976,018.7Median age for Other race residents
- -606,837,606.2Males
- -416,326,530.2Females
- 33.7Median age for Two or more races residents
- 15.7Males
- 59.6Females
- 43.4Median age for White alone residents
- 39.0Males
- 47.8Females
- 35.6Median age for Hispanic or Latino residents
- 11.5Males
- 49.5Females
Owner/renter occupied households by race in Long Beach
- House owners and renters - White residents
- 4,06070.7%Owner occupied
- 1,68029.3%Renter occupied
- House owners and renters - Black or African American residents
- 17834.8%Owner occupied
- 33565.2%Renter occupied
- House owners and renters - American Indian / Alaska Native residents
- 869.4%Owner occupied
- 330.6%Renter occupied
- House owners and renters - Asian residents
- 9288.9%Owner occupied
- 1111.1%Renter occupied
- House owners and renters - Other race residents
- 26100.0%Owner occupied
- House owners and renters - Two or more races residents
- 37959.9%Owner occupied
- 25440.1%Renter occupied
- House owners and renters - White alone residents
- 4,08971.0%Owner occupied
- 1,67029.0%Renter occupied
- House owners and renters - Hispanic or Latino residents
- 5729.6%Owner occupied
- 13570.4%Renter occupied
Language usage in Long Beach
- English speakers - Total
- 92.9% of residents of Long Beach speak English at home.
- 2.3% of residents speak Spanish at home
- 26271.8%Speak English very well
- 10328.2%Speak English less than very well
- 5.3% of residents speak other language at home
- 69781.0%Speak English very well
- 16419.0%Speak English less than very well
- English speakers - Born in the United States
- 93.0% of residents of Long Beach speak English at home.
- 2.5% of residents speak Spanish at home
- 11359.5%Speak English very well
- 7740.5%Speak English less than very well
- 1.9% of residents speak other language at home
- 13897.2%Speak English very well
- 42.8%Speak English less than very well
- English speakers - Native, born elsewhere
- 94.7% of residents of Long Beach speak English at home.
- 8.2% of residents speak Spanish at home
- 17100.0%Speak English very well
- English speakers - Foreign-born
- 49.3% of residents of Long Beach speak English at home.
- 13.2% of residents speak Spanish at home
- 7473.3%Speak English very well
- 2726.7%Speak English less than very well
- 46.7% of residents speak other language at home
- 25872.5%Speak English very well
- 9827.5%Speak English less than very well
White (Caucasian) - Speak only English
| Native: | 98.2% (12,636) |
| Foreign-born: | 66.4% (196) |
White (Caucasian) - Speak another language
| Native: | 1.8% (232) |
| Foreign-born: | 43.3% (128) |
Asian - Speak only English
| Native: | 69.7% (10) |
| Foreign-born: | 43.4% (140) |
Two or more races - Speak only English
| Native: | 90.2% (1,257) |
| Foreign-born: | 65.8% (44) |
Two or more races - Speak another language
| Native: | 3.7% (52) |
| Foreign-born: | 46.9% (32) |
White alone - Speak only English
| Native: | 98.7% (12,565) |
| Foreign-born: | 49.0% (198) |
White alone - Speak another language
| Native: | 1.3% (164) |
| Foreign-born: | 50.3% (203) |
Hispanic or Latino - Speak only English
| Native: | 63.1% (221) |
| Foreign-born: | 11.8% (11) |
Hispanic or Latino - Speak another language
| Native: | 37.0% (129) |
| Foreign-born: | 88.1% (80) |
Foreign-born residents in Long Beach
984 residents are foreign born (2.1% Asia, 1.7% Europe, 1.0% Latin America, 0.9% North America).
| This city: | 5.8% |
| Mississippi: | 2.3% |


Marital status for residents in Long Beach
Marital status - White (Caucasian) population 15 years and over
- Males
- 40.5%Never married
- 47.8%Now married
- 0.0%Separated
- 1.9%Widowed
- 9.8%Divorced
- Females
- 21.3%Never married
- 43.5%Now married
- 3.7%Separated
- 15.2%Widowed
- 16.3%Divorced
Women who gave birth in the past 12 months
| Now married: | 92.7% (87) |
| Unmarried: | 7.3% (7) |
Women who did not give birth in the past 12 months
| Now married: | 44.9% (1,322) |
| Unmarried: | 55.1% (1,622) |
Marital status - Black or African American population 15 years and over
- Males
- 20.9%Never married
- 35.4%Now married
- 7.8%Separated
- 0.0%Widowed
- 35.9%Divorced
- Females
- 36.8%Never married
- 35.8%Now married
- 0.0%Separated
- 22.5%Widowed
- 4.8%Divorced
Women who gave birth in the past 12 months
| Now married: | 100.0% (55) |
| Unmarried: | 0.0% (0) |
Women who did not give birth in the past 12 months
| Now married: | 31.2% (80) |
| Unmarried: | 68.8% (176) |
Marital status - American Indian / Alaska Native population 15 years and over
- Males
- 0.0%Never married
- 100.0%Now married
- 0.0%Separated
- 0.0%Widowed
- 0.0%Divorced
- Females
- 0.0%Never married
- 0.0%Now married
- 0.0%Separated
- 33.3%Widowed
- 66.7%Divorced
Marital status - Asian population 15 years and over
- Males
- 4.2%Never married
- 95.8%Now married
- 0.0%Separated
- 0.0%Widowed
- 0.0%Divorced
- Females
- 4.7%Never married
- 32.7%Now married
- 0.0%Separated
- 1.6%Widowed
- 61.1%Divorced
Women who gave birth in the past 12 months
| Now married: | 100.0% (10) |
| Unmarried: | 0.0% (0) |
Women who did not give birth in the past 12 months
| Now married: | 72.7% (34) |
| Unmarried: | 27.3% (13) |
Marital status - Two or more races population 15 years and over
- Males
- 21.4%Never married
- 61.4%Now married
- 0.0%Separated
- 0.0%Widowed
- 17.3%Divorced
- Females
- 30.3%Never married
- 30.1%Now married
- 0.0%Separated
- 20.2%Widowed
- 19.4%Divorced
Women who did not give birth in the past 12 months
| Now married: | 36.0% (138) |
| Unmarried: | 64.0% (244) |
Marital status - White alone, not Hispanic / Latino population 15 years and over
- Males
- 40.9%Never married
- 47.3%Now married
- 0.0%Separated
- 2.0%Widowed
- 9.8%Divorced
- Females
- 21.5%Never married
- 43.8%Now married
- 3.0%Separated
- 15.3%Widowed
- 16.4%Divorced
Women who gave birth in the past 12 months
| Now married: | 92.7% (88) |
| Unmarried: | 7.3% (7) |
Women who did not give birth in the past 12 months
| Now married: | 44.0% (1,284) |
| Unmarried: | 56.0% (1,633) |
Marital status - Hispanic or Latino population 15 years and over
- Males
- 12.9%Never married
- 82.2%Now married
- 0.0%Separated
- 0.0%Widowed
- 5.0%Divorced
- Females
- 0.0%Never married
- 24.4%Now married
- 26.7%Separated
- 29.0%Widowed
- 19.9%Divorced
Women who did not give birth in the past 12 months
| Now married: | 69.2% (67) |
| Unmarried: | 30.8% (30) |
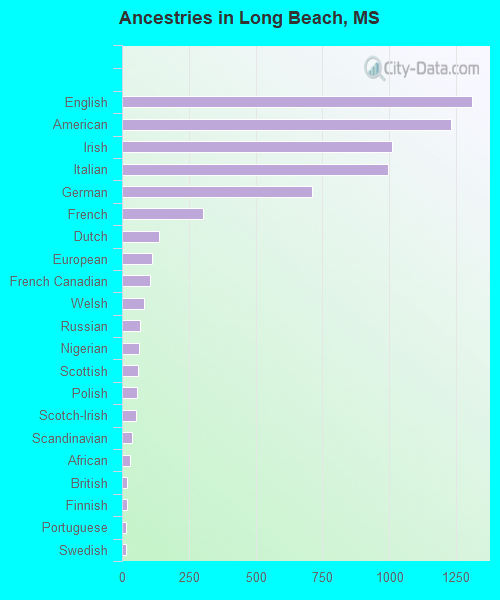
Ancestries in Long Beach

- 1,30915.5%English
- 1,23314.6%American
- 1,01011.9%Irish
- 99811.8%Italian
- 7108.4%German
- 3023.6%French
- 1371.6%Dutch
- 1121.3%European
- 1041.2%French Canadian
- 821.0%Welsh
- 660.8%Russian
- 640.8%Nigerian
- 610.7%Scottish
- 580.7%Polish
- 510.6%Scotch-Irish
- 360.4%Scandinavian
- 300.4%African
- 200.2%British
- 180.2%Finnish
- 150.2%Portuguese
- 140.2%Swedish
- 90.1%Canadian
- 80.09%Norwegian
- 60.07%Cajun
- 10.01%Danish
Geographical mobility in Long Beach

- Same house 1 year ago
- 11,71984.8%White (Caucasian)
- 90478.8%Black or African American
- 1599.4%American Indian / Alaska Native
- 31191.2%Asian
- 26100.0%Other race
- 1,45695.2%Two or more races
- 11,55984.5%White alone, not Hispanic / Latino
- 45389.2%Hispanic or Latino

-
- Moved within same county
- 7745.6%White / Caucasian
- 433.7%Black or African American
- 61.6%Asian
- 593.9%Two or more races
- 7935.8%White alone, not Hispanic / Latino
- 275.3%Hispanic or Latino

-
- Moved within same state
- 2681.9%White / Caucasian
- 1109.6%Black or African American
- 2742.0%White alone, not Hispanic / Latino

-
- Moved from different state
- 9797.1%White / Caucasian
- 554.8%Black or African American
- 20.5%Asian
- 372.4%Two or more races
- 9587.0%White alone, not Hispanic / Latino
- 20.5%Hispanic or Latino

-
- Moved from abroad
- 1310.9%White
- 349.8%Asian
- 1321.0%White alone, not Hispanic / Latino

Children Nativity (place of birth) in Long Beach
Place of birth for residents in Long Beach
![Place of birth for the foreign-born population - Regions]()
- 360Asia
- 319Americas
- 296Europe
- 281South Eastern Asia
- 165Latin America
- 160Eastern Europe
- 154Northern America
- 141Central America
- 94Western Europe
- 69Eastern Asia
- 41Northern Europe
- 27China
- 23Caribbean
- 9South Central Asia
- 8Africa
- 8Northern Africa

![Place of birth for the foreign-born population - Countries]()
- 205Philippines
- 154Canada
- 141Mexico
- 70Germany
- 60Vietnam
- 40Korea
- 27China
- 25United Kingdom
- 24Netherlands
- 21Grenada
- 16Scotland
- 16Thailand
- 9India
- 8Egypt
- 2Cuba
- 1Japan

Zip codes: 39560.