Races in Little Canada, Minnesota (MN) Detailed Stats
Data:
Races - White alone (%)
Races - White alone (% change since 2000)
Races - Black alone (%)
Races - Black alone (% change since 2000)
Races - American Indian alone (%)
Races - American Indian alone (% change since 2000)
Races - Asian alone (%)
Races - Asian alone (% change since 2000)
Races - Hispanic (%)
Races - Hispanic (% change since 2000)
Races - Native Hawaiian and Other Pacific Islander alone (%)
Races - Native Hawaiian and Other Pacific Islander alone (% change since 2000)
Races - Two or more races(%)
Races - Two or more races(% change since 2000)
Races - Other race alone (%)
Races - Other race alone (% change since 2000)
Racial diversity
Place of birth - Born in state of residence (%)
Place of birth - Born in state of residence (%) - White
Place of birth - Born in state of residence (%) - Black or African American
Place of birth - Born in state of residence (%) - Asian
Place of birth - Born in state of residence (%) - Hispanic or Latino
Place of birth - Born in state of residence (%) - American Indian and Alaska Native
Place of birth - Born in state of residence (%) - Multirace
Place of birth - Born in state of residence (%) - Other Race
Place of birth - Born in other state (%)
Place of birth - Born in other state (%) - White
Place of birth - Born in other state (%) - Black or African American
Place of birth - Born in other state (%) - Asian
Place of birth - Born in other state (%) - Hispanic or Latino
Place of birth - Born in other state (%) - American Indian and Alaska Native
Place of birth - Born in other state (%) - Multirace
Place of birth - Born in other state (%) - Other Race
Place of birth - Native, outside of US (%)
Place of birth - Native, outside of US (%) - White
Place of birth - Native, outside of US (%) - Black or African American
Place of birth - Native, outside of US (%) - Asian
Place of birth - Native, outside of US (%) - Hispanic or Latino
Place of birth - Native, outside of US (%) - American Indian and Alaska Native
Place of birth - Native, outside of US (%) - Multirace
Place of birth - Native, outside of US (%) - Other Race
Place of birth - Foreign born (%)
Place of birth - Foreign born (%) - White
Place of birth - Foreign born (%) - Black or African American
Place of birth - Foreign born (%) - Asian
Place of birth - Foreign born (%) - Hispanic or Latino
Place of birth - Foreign born (%) - American Indian and Alaska Native
Place of birth - Foreign born (%) - Multirace
Place of birth - Foreign born (%) - Other Race
Residents speaking English at home (%)
Residents speaking English at home - Born in the United States (%)
Residents speaking English at home - Native, born elsewhere (%)
Residents speaking English at home - Foreign born (%)
Residents speaking Spanish at home (%)
Residents speaking Spanish at home - Born in the United States (%)
Residents speaking Spanish at home - Native, born elsewhere (%)
Residents speaking Spanish at home - Foreign born (%)
Residents speaking other language at home (%)
Residents speaking other language at home - Born in the United States (%)
Residents speaking other language at home - Native, born elsewhere (%)
Residents speaking other language at home - Foreign born (%)
Marital status - Never married (%)
Marital status - Now married (%)
Marital status - Separated (%)
Marital status - Widowed (%)
Marital status - Divorced (%)
Ancestries Reported - Arab (%)
Ancestries Reported - Czech (%)
Ancestries Reported - Danish (%)
Ancestries Reported - Dutch (%)
Ancestries Reported - English (%)
Ancestries Reported - French (%)
Ancestries Reported - French Canadian (%)
Ancestries Reported - German (%)
Ancestries Reported - Greek (%)
Ancestries Reported - Hungarian (%)
Ancestries Reported - Irish (%)
Ancestries Reported - Italian (%)
Ancestries Reported - Lithuanian (%)
Ancestries Reported - Norwegian (%)
Ancestries Reported - Polish (%)
Ancestries Reported - Portuguese (%)
Ancestries Reported - Russian (%)
Ancestries Reported - Scotch-Irish (%)
Ancestries Reported - Scottish (%)
Ancestries Reported - Slovak (%)
Ancestries Reported - Subsaharan African (%)
Ancestries Reported - Swedish (%)
Ancestries Reported - Swiss (%)
Ancestries Reported - Ukrainian (%)
Ancestries Reported - United States (%)
Ancestries Reported - Welsh (%)
Ancestries Reported - West Indian (%)
Ancestries Reported - Other (%)
Geographical mobility - Same house 1 year ago (%)
Geographical mobility - Same house 1 year ago (%) - White
Geographical mobility - Same house 1 year ago (%) - Black or African American
Geographical mobility - Same house 1 year ago (%) - Asian
Geographical mobility - Same house 1 year ago (%) - Hispanic or Latino
Geographical mobility - Same house 1 year ago (%) - American Indian and Alaska Native
Geographical mobility - Same house 1 year ago (%) - Multirace
Geographical mobility - Same house 1 year ago (%) - Other Race
Geographical mobility - Moved within same county (%)
Geographical mobility - Moved within same county (%) - White
Geographical mobility - Moved within same county (%) - Black or African American
Geographical mobility - Moved within same county (%) - Asian
Geographical mobility - Moved within same county (%) - Hispanic or Latino
Geographical mobility - Moved within same county (%) - American Indian and Alaska Native
Geographical mobility - Moved within same county (%) - Multirace
Geographical mobility - Moved within same county (%) - Other Race
Geographical mobility - Moved from different county within same state (%)
Geographical mobility - Moved from different county within same state (%) - White
Geographical mobility - Moved from different county within same state (%) - Black or African American
Geographical mobility - Moved from different county within same state (%) - Asian
Geographical mobility - Moved from different county within same state (%) - Hispanic or Latino
Geographical mobility - Moved from different county within same state (%) - American Indian and Alaska Native
Geographical mobility - Moved from different county within same state (%) - Multirace
Geographical mobility - Moved from different county within same state (%) - Other Race
Geographical mobility - Moved from different state (%)
Geographical mobility - Moved from different state (%) - White
Geographical mobility - Moved from different state (%) - Black or African American
Geographical mobility - Moved from different state (%) - Asian
Geographical mobility - Moved from different state (%) - Hispanic or Latino
Geographical mobility - Moved from different state (%) - American Indian and Alaska Native
Geographical mobility - Moved from different state (%) - Multirace
Geographical mobility - Moved from different state (%) - Other Race
Geographical mobility - Moved from abroad (%)
Geographical mobility - Moved from abroad (%) - White
Geographical mobility - Moved from abroad (%) - Black or African American
Geographical mobility - Moved from abroad (%) - Asian
Geographical mobility - Moved from abroad (%) - Hispanic or Latino
Geographical mobility - Moved from abroad (%) - American Indian and Alaska Native
Geographical mobility - Moved from abroad (%) - Multirace
Geographical mobility - Moved from abroad (%) - Other Race
Place of birth for the foreign-born population - Ireland (%)
Place of birth for the foreign-born population - Denmark (%)
Place of birth for the foreign-born population - Norway (%)
Place of birth for the foreign-born population - Sweden (%)
Place of birth for the foreign-born population - United Kingdom (%)
Place of birth for the foreign-born population - England (%)
Place of birth for the foreign-born population - Scotland (%)
Place of birth for the foreign-born population - Other Northern Europe (%)
Place of birth for the foreign-born population - Austria (%)
Place of birth for the foreign-born population - Belgium (%)
Place of birth for the foreign-born population - France (%)
Place of birth for the foreign-born population - Germany (%)
Place of birth for the foreign-born population - Netherlands (%)
Place of birth for the foreign-born population - Switzerland (%)
Place of birth for the foreign-born population - Other Western Europe (%)
Place of birth for the foreign-born population - Greece (%)
Place of birth for the foreign-born population - Italy (%)
Place of birth for the foreign-born population - Portugal (%)
Place of birth for the foreign-born population - Spain (%)
Place of birth for the foreign-born population - Other Southern Europe (%)
Place of birth for the foreign-born population - Albania (%)
Place of birth for the foreign-born population - Belarus (%)
Place of birth for the foreign-born population - Bosnia and Herzegovina (%)
Place of birth for the foreign-born population - Bulgaria (%)
Place of birth for the foreign-born population - Croatia (%)
Place of birth for the foreign-born population - Czechoslovakia (%)
Place of birth for the foreign-born population - Hungary (%)
Place of birth for the foreign-born population - Latvia (%)
Place of birth for the foreign-born population - Lithuania (%)
Place of birth for the foreign-born population - North Macedonia (Macedonia) (%)
Place of birth for the foreign-born population - Moldova (%)
Place of birth for the foreign-born population - Poland (%)
Place of birth for the foreign-born population - Romania (%)
Place of birth for the foreign-born population - Russia (%)
Place of birth for the foreign-born population - Serbia (%)
Place of birth for the foreign-born population - Ukraine (%)
Place of birth for the foreign-born population - Other Eastern Europe (%)
Place of birth for the foreign-born population - China (%)
Place of birth for the foreign-born population - Hong Kong (%)
Place of birth for the foreign-born population - Taiwan (%)
Place of birth for the foreign-born population - Japan (%)
Place of birth for the foreign-born population - Korea (%)
Place of birth for the foreign-born population - Other Eastern Asia (%)
Place of birth for the foreign-born population - Afghanistan (%)
Place of birth for the foreign-born population - Bangladesh (%)
Place of birth for the foreign-born population - India (%)
Place of birth for the foreign-born population - Iran (%)
Place of birth for the foreign-born population - Kazakhstan (%)
Place of birth for the foreign-born population - Nepal (%)
Place of birth for the foreign-born population - Pakistan (%)
Place of birth for the foreign-born population - Sri Lanka (%)
Place of birth for the foreign-born population - Uzbekistan (%)
Place of birth for the foreign-born population - Other South Central Asia (%)
Place of birth for the foreign-born population - Burma (%)
Place of birth for the foreign-born population - Cambodia (%)
Place of birth for the foreign-born population - Indonesia (%)
Place of birth for the foreign-born population - Laos (%)
Place of birth for the foreign-born population - Malaysia (%)
Place of birth for the foreign-born population - Philippines (%)
Place of birth for the foreign-born population - Singapore (%)
Place of birth for the foreign-born population - Thailand (%)
Place of birth for the foreign-born population - Vietnam (%)
Place of birth for the foreign-born population - Other South Eastern Asia (%)
Place of birth for the foreign-born population - Armenia (%)
Place of birth for the foreign-born population - Iraq (%)
Place of birth for the foreign-born population - Israel (%)
Place of birth for the foreign-born population - Jordan (%)
Place of birth for the foreign-born population - Kuwait (%)
Place of birth for the foreign-born population - Lebanon (%)
Place of birth for the foreign-born population - Saudi Arabia (%)
Place of birth for the foreign-born population - Syria (%)
Place of birth for the foreign-born population - Turkey (%)
Place of birth for the foreign-born population - Yemen (%)
Place of birth for the foreign-born population - Other Western Asia (%)
Place of birth for the foreign-born population - Eritrea (%)
Place of birth for the foreign-born population - Ethiopia (%)
Place of birth for the foreign-born population - Kenya (%)
Place of birth for the foreign-born population - Somalia (%)
Place of birth for the foreign-born population - Uganda (%)
Place of birth for the foreign-born population - Zimbabwe (%)
Place of birth for the foreign-born population - Other Eastern Africa (%)
Place of birth for the foreign-born population - Cameroon (%)
Place of birth for the foreign-born population - Congo (%)
Place of birth for the foreign-born population - Democratic Republic of Congo (Zaire) (%)
Place of birth for the foreign-born population - Other Middle Africa (%)
Place of birth for the foreign-born population - Egypt (%)
Place of birth for the foreign-born population - Morocco (%)
Place of birth for the foreign-born population - Sudan (%)
Place of birth for the foreign-born population - Other Northern Africa (%)
Place of birth for the foreign-born population - South Africa (%)
Place of birth for the foreign-born population - Other Southern Africa (%)
Place of birth for the foreign-born population - Cabo Verde (%)
Place of birth for the foreign-born population - Ghana (%)
Place of birth for the foreign-born population - Liberia (%)
Place of birth for the foreign-born population - Nigeria (%)
Place of birth for the foreign-born population - Senegal (%)
Place of birth for the foreign-born population - Sierra Leone (%)
Place of birth for the foreign-born population - Other Western Africa (%)
Place of birth for the foreign-born population - Australia (%)
Place of birth for the foreign-born population - New Zealand (%)
Place of birth for the foreign-born population - Fiji (%)
Place of birth for the foreign-born population - Micronesia (%)
Place of birth for the foreign-born population - Bahamas (%)
Place of birth for the foreign-born population - Barbados (%)
Place of birth for the foreign-born population - Cuba (%)
Place of birth for the foreign-born population - Dominica (%)
Place of birth for the foreign-born population - Dominican Republic (%)
Place of birth for the foreign-born population - Grenada (%)
Place of birth for the foreign-born population - Haiti (%)
Place of birth for the foreign-born population - Jamaica (%)
Place of birth for the foreign-born population - St. Vincent and the Grenadines (%)
Place of birth for the foreign-born population - Trinidad and Tobago (%)
Place of birth for the foreign-born population - West Indies (%)
Place of birth for the foreign-born population - Other Caribbean (%)
Place of birth for the foreign-born population - Belize (%)
Place of birth for the foreign-born population - Costa Rica (%)
Place of birth for the foreign-born population - El Salvador (%)
Place of birth for the foreign-born population - Guatemala (%)
Place of birth for the foreign-born population - Honduras (%)
Place of birth for the foreign-born population - Mexico (%)
Place of birth for the foreign-born population - Nicaragua (%)
Place of birth for the foreign-born population - Panama (%)
Place of birth for the foreign-born population - Other Central America (%)
Place of birth for the foreign-born population - Argentina (%)
Place of birth for the foreign-born population - Bolivia (%)
Place of birth for the foreign-born population - Brazil (%)
Place of birth for the foreign-born population - Chile (%)
Place of birth for the foreign-born population - Colombia (%)
Place of birth for the foreign-born population - Ecuador (%)
Place of birth for the foreign-born population - Guyana (%)
Place of birth for the foreign-born population - Peru (%)
Place of birth for the foreign-born population - Uruguay (%)
Place of birth for the foreign-born population - Venezuela (%)
Place of birth for the foreign-born population - Other South America (%)
Place of birth for the foreign-born population - Canada (%)
Place of birth for the foreign-born population - Other Northern America (%)
Place of birth for the foreign-born population - Other (%)
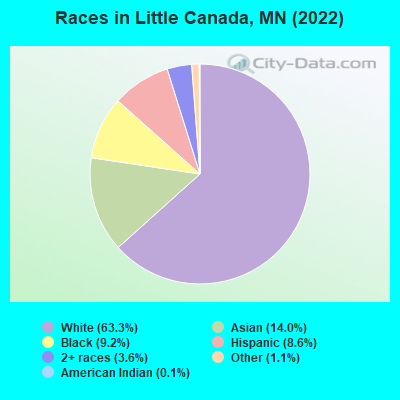
According to 2022 data, the most numerous races in Little Canada, MN are White alone (6,588 residents), Black alone (958 residents), and Hispanic (900 residents). 77.4% of Little Canada residents speak English at home. 11.2% of Little Canada, MN residents are foreign-born (6.2% born in Asia, 2.8% born in Africa, 1.6% born in Latin America), which is 28.7% greater than the foreign-born rate of 8.0% across the entire state of Minnesota.
Race distribution in Little Canada
2000 2022
4,337,143 88.2% White alone 168,813 3.4% Black alone 143,382 2.9% Hispanic 141,083 2.9% Asian alone 70,304 1.4% Two or more races 52,009 1.1% American Indian alone 5,031 0.1% Other race alone 1,714 0.03% Native Hawaiian and Other
4,356,347 76.2% White alone 395,179 6.9% Black alone 333,830 5.8% Hispanic 294,800 5.2% Asian alone 259,649 4.5% Two or more races 42,125 0.7% American Indian alone 32,976 0.6% Other race alone 2,278 0.04% Native Hawaiian and Other
Income and house value in Little Canada Median household income in 2022 $72,192 White non-Hispanic householders$44,001 Black householders$63,732 Asian householders$68,225 Two or more races householders$50,194 Hispanic or Latino race householdersMedian 2022 house value $398,474 White Non-Hispanic householders$361,652 Black or African American householders$295,897 American Indian or Alaska Native householders $418,464 Asian householders$310,626 Two or more races householders$178,853 Hispanic or Latino householders
Median age by race in Little Canada
53.2 Median age for White residents51.2 55.5 29.0 Median age for Black or African American residents32.0 29.3 -820,846,904.7 Median age for American Indian / Alaska Native residents-1,081,272,083.7 -696,340,256.5 32.6 Median age for Asian residents32.3 30.7 -744,336,568.8 Median age for Native Hawaiian / Pacific Islander residents-856,799,036.4 -534,959,349.1 10.5 Median age for Other race residents5.7 36.7 21.0 Median age for Two or more races residents20.9 23.5 53.8 Median age for White alone residents51.2 55.5 18.4 Median age for Hispanic or Latino residents17.6 20.9
Owner/renter occupied households by race in Little Canada
House owners and renters - White residents 2,316 68.1% Owner occupied1,086 31.9% Renter occupiedHouse owners and renters - Black or African American residents 75 15.3% Owner occupied415 84.7% Renter occupiedHouse owners and renters - American Indian / Alaska Native residents 19 100.0% Renter occupiedHouse owners and renters - Asian residents 274 63.3% Owner occupied159 36.7% Renter occupiedHouse owners and renters - Other race residents 11 100.0% Owner occupiedHouse owners and renters - Two or more races residents 285 79.9% Owner occupied72 20.1% Renter occupiedHouse owners and renters - White alone residents 2,336 68.5% Owner occupied1,074 31.5% Renter occupiedHouse owners and renters - Hispanic or Latino residents 122 63.3% Owner occupied70 36.7% Renter occupied
Language usage in Little Canada
English speakers - Total 77.4% of residents of Little Canada speak English at home.
7.6% of residents speak Spanish at home 666 88.9% Speak English very well83 11.1% Speak English less than very well14.7% of residents speak other language at home 851 58.6% Speak English very well602 41.4% Speak English less than very well
English speakers - Born in the United States 89.6% of residents of Little Canada speak English at home.
3.4% of residents speak Spanish at home 77 100.0% Speak English very well7.3% of residents speak other language at home 97 58.8% Speak English very well68 41.2% Speak English less than very well
English speakers - Native, born elsewhere 86.2% of residents of Little Canada speak English at home.
English speakers - Foreign-born 17.2% of residents of Little Canada speak English at home.
10.6% of residents speak Spanish at home 32 27.1% Speak English very well86 72.9% Speak English less than very well70.9% of residents speak other language at home 376 47.8% Speak English very well410 52.2% Speak English less than very well
White (Caucasian) - Speak only English Native:
98.5% (6,308)Foreign-born:
59.3% (20)
White (Caucasian) - Speak another language Native:
1.7% (109)Foreign-born:
48.6% (16)
Black or African American - Speak only English Native:
90.2% (475)Foreign-born:
29.9% (79)
Black or African American - Speak another language Native:
9.9% (52)Foreign-born:
66.5% (176)
Asian - Speak only English Native:
28.5% (181)Foreign-born:
7.6% (50)
Asian - Speak another language Native:
70.3% (446)Foreign-born:
92.2% (606)
Other race - Speak only English Native:
25.7% (21)Foreign-born:
39.4% (55)
Other race - Speak another language Native:
73.3% (58)Foreign-born:
62.3% (87)
Two or more races - Speak another language Native:
68.5% (717)Foreign-born:
100.0% (37)
Hispanic or Latino - Speak only English Native:
13.3% (95)Foreign-born:
35.4% (63)
Hispanic or Latino - Speak another language Native:
89.5% (636)Foreign-born:
65.5% (116)
Foreign-born residents in Little Canada 1,168 residents are foreign born (6.2% Asia , 2.8% Africa , 1.6% Latin America ).
This city:
11.2%Minnesota:
8.5%
Marital status for residents in Little Canada Marital status - White (Caucasian) population 15 years and over
Males 33.2% Never married52.3% Now married0.0% Separated1.9% Widowed12.6% DivorcedFemales 28.7% Never married44.5% Now married1.0% Separated9.2% Widowed16.6% DivorcedWomen who gave birth in the past 12 months Now married:
100.0% (27)Unmarried:
0.0% (0)
Women who did not give birth in the past 12 months Now married:
37.1% (439)Unmarried:
62.9% (745)
Marital status - Black or African American population 15 years and over
Males 47.5% Never married16.9% Now married4.7% Separated21.0% Widowed9.8% DivorcedFemales 69.3% Never married12.5% Now married3.4% Separated5.2% Widowed9.6% DivorcedWomen who gave birth in the past 12 months Now married:
100.0% (5)Unmarried:
0.0% (0)
Women who did not give birth in the past 12 months Now married:
4.9% (14)Unmarried:
95.1% (270)
Marital status - Asian population 15 years and over
Males 45.1% Never married51.8% Now married0.0% Separated3.0% Widowed0.0% DivorcedFemales 46.1% Never married42.1% Now married0.2% Separated7.6% Widowed4.0% DivorcedWomen who gave birth in the past 12 months Now married:
24.6% (14)Unmarried:
75.4% (42)
Women who did not give birth in the past 12 months Now married:
29.4% (95)Unmarried:
70.6% (228)
Marital status - Other race population 15 years and over
Males 0.0% Never married100.0% Now married0.0% Separated0.0% Widowed0.0% DivorcedFemales 0.0% Never married100.0% Now married0.0% Separated0.0% Widowed0.0% DivorcedWomen who gave birth in the past 12 months Now married:
100.0% (14)Unmarried:
0.0% (0)
Women who did not give birth in the past 12 months Now married:
100.0% (59)Unmarried:
0.0% (0)
Marital status - Two or more races population 15 years and over
Males 90.5% Never married9.5% Now married0.0% Separated0.0% Widowed0.0% DivorcedFemales 47.4% Never married24.2% Now married22.9% Separated0.0% Widowed5.5% DivorcedWomen who gave birth in the past 12 months Now married:
100.0% (15)Unmarried:
0.0% (0)
Women who did not give birth in the past 12 months Now married:
44.4% (133)Unmarried:
55.6% (167)
Marital status - White alone, not Hispanic / Latino population 15 years and over
Males 32.4% Never married52.9% Now married0.0% Separated1.9% Widowed12.7% DivorcedFemales 27.1% Never married45.7% Now married1.0% Separated9.5% Widowed16.7% DivorcedWomen who gave birth in the past 12 months Now married:
100.0% (28)Unmarried:
0.0% (0)
Women who did not give birth in the past 12 months Now married:
39.2% (452)Unmarried:
60.8% (700)
Marital status - Hispanic or Latino population 15 years and over
Males 77.3% Never married22.7% Now married0.0% Separated0.0% Widowed0.0% DivorcedFemales 62.8% Never married12.8% Now married21.1% Separated0.0% Widowed3.3% DivorcedWomen who gave birth in the past 12 months Now married:
100.0% (8)Unmarried:
0.0% (0)
Women who did not give birth in the past 12 months Now married:
33.4% (108)Unmarried:
66.6% (215)
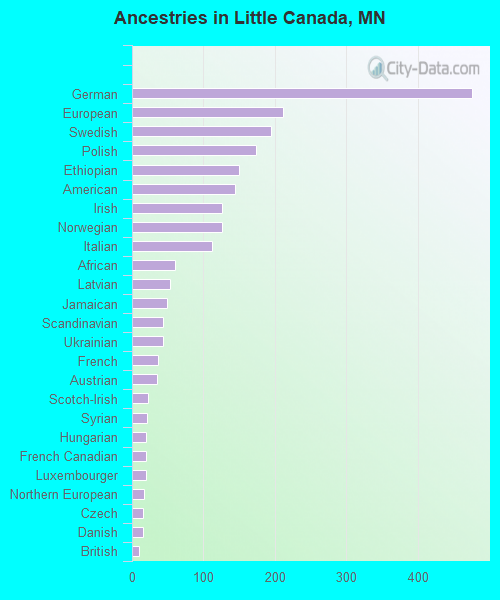
Ancestries in Little Canada
476 9.9% German212 4.4% European194 4.0% Swedish174 3.6% Polish150 3.1% Ethiopian144 3.0% American126 2.6% Irish126 2.6% Norwegian112 2.3% Italian60 1.3% African53 1.1% Latvian49 1.0% Jamaican43 0.9% Scandinavian43 0.9% Ukrainian37 0.8% French35 0.7% Austrian22 0.5% Scotch-Irish21 0.4% Syrian20 0.4% Hungarian19 0.4% French Canadian19 0.4% Luxembourger17 0.4% Northern European16 0.3% Czech15 0.3% Danish10 0.2% British10 0.2% Dutch10 0.2% Finnish8 0.2% Romanian5 0.1% Haitian
Children Nativity (place of birth) in Little Canada
Children under 6 years - Living with two parents Both parents native 135 100.0% NativeBoth parents foreign-born 87 100.0% NativeOne native, one foreign-born parent 34 100.0% NativeChildren under 6 years - Living with one parent Native parent 281 100.0% NativeForeign-born parent 255 100.0% NativeChildren 6 to 17 years - Living with two parents Both parents native 614 97.4% Native17 2.6% Foreign-bornBoth parents foreign-born 112 74.5% Native38 25.5% Foreign-bornOne native, one foreign-born parent 13 100.0% NativeChildren 6 to 17 years - Living with one parent Native parent 509 100.0% NativeForeign-born parent 50 48.4% Native53 51.6% Foreign-born
Grandparents responsible for own grandchildren in Little Canada
Grandparents (30 to 59 years) White / Caucasian 80 100.0% Responsible for grandchildrenTwo or more races 34 100.0% Not responsible for grandchildrenWhite alone, not Hispanic / Latino 80 100.0% Responsible for grandchildrenHispanic or Latino 49 100.0% Not responsible for grandchildren
Grandparents (60 years and over) White / Caucasian 78 100.0% Not responsible for grandchildrenWhite alone, not Hispanic / Latino 82 100.0% Not responsible for grandchildren