Races in La Grande, Oregon (OR) Detailed Stats
Ancestries, Foreign-born residents, place of birth
Settings
X


Recent posts about races in La Grande, Oregon on our local forum with over 2,400,000 registered users:
 | Hermiston vs. La Grande? (22 replies) |
| Pro and Cons on Klamath Falls (195 replies) |
| It would be nice to have real news media in Oregon. (21 replies) |
| How to Oregonians feel about Calif. transplants (308 replies) |
| House in the rural areas of eastern Oregon (27 replies) |
| Is there a; Heavily forested mountain town, a lot of snow in December in OR? (39 replies) |
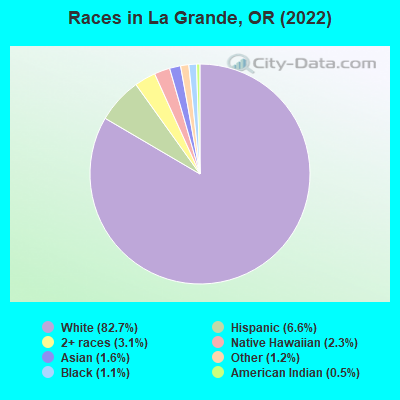
According to 2022 data, the most numerous races in La Grande, OR are White alone (10,860 residents), Hispanic (868 residents), and Two or more races (413 residents). 93.7% of La Grande residents speak English at home. 3.6% of La Grande, OR residents are foreign-born (1.5% born in Oceania, 1.0% born in Asia, 0.7% born in Latin America), which is 146.7% less than the foreign-born rate of 9.0% across the entire state of Oregon.
Race distribution in La Grande
2000
2022

- 11,31291.8%White alone
- 3422.8%Hispanic
- 2101.7%Two or more races
- 1521.2%Asian alone
- 1100.9%Native Hawaiian and Other
Pacific Islander alone - 850.7%American Indian alone
- 770.6%Black alone
- 390.3%Other race alone

-
- 10,86082.7%White alone
- 8686.6%Hispanic
- 4133.1%Two or more races
- 2992.3%Native Hawaiian and Other
Pacific Islander alone - 2041.6%Asian alone
- 1551.2%Other race alone
- 1381.1%Black alone
- 710.5%American Indian alone
2000
2022
-
- 2,857,61683.5%White alone
- 275,3148.0%Hispanic
- 100,3332.9%Asian alone
- 82,7332.4%Two or more races
- 53,3251.6%Black alone
- 40,1301.2%American Indian alone
- 7,3980.2%Native Hawaiian and Other
Pacific Islander alone - 4,5500.1%Other race alone

-
- 3,037,57171.6%White alone
- 609,53814.4%Hispanic
- 252,7446.0%Two or more races
- 191,2834.5%Asian alone
- 78,2281.8%Black alone
- 29,3990.7%American Indian alone
- 25,7310.6%Other race alone
- 15,6430.4%Native Hawaiian and Other
Pacific Islander alone

Income and house value in La Grande
- Median household income in 2022
- $50,657White non-Hispanic householders
- $59,597Asian householders
- $47,843Native Hawaiian and other Pacific Islander householders
- $48,786Some other race householders
- $66,229Two or more races householders
- Median 2022 house value
- $265,627White Non-Hispanic householders
- $174,563Black or African American householders
- $400,041American Indian or Alaska Native householders
- $256,317Native Hawaiian and other Pacific Islander householders
- $258,936Some other race householders
- $269,118Two or more races householders
- $282,502Hispanic or Latino householders
Household income for White non-Hispanic householders

Household income for Black householders

Household income for American Indian and Alaska Native householders

Household income for Asian householders

Household income for Native Hawaiian and other Pacific Islander householders

Household income for Some other race householders

Household income for Two or more races householders

Household income for Hispanic or Latino race householders

Median age by race in La Grande
- 35.8Median age for White residents
- 34.8Males
- 37.3Females
- 22.5Median age for Black or African American residents
- 23.3Males
- 22.1Females
- 32.0Median age for American Indian / Alaska Native residents
- 30.4Males
- 30.9Females
- 33.3Median age for Asian residents
- 35.0Males
- 32.3Females
- 34.8Median age for Native Hawaiian / Pacific Islander residents
- 33.1Males
- 49.6Females
- 21.6Median age for Other race residents
- 20.3Males
- 23.9Females
- 25.3Median age for Two or more races residents
- 23.2Males
- 28.1Females
- 36.2Median age for White alone residents
- 35.6Males
- 36.9Females
- 23.0Median age for Hispanic or Latino residents
- 21.2Males
- 24.6Females
Owner/renter occupied households by race in La Grande
- House owners and renters - White residents
- 2,67155.8%Owner occupied
- 2,12044.2%Renter occupied
- House owners and renters - Black or African American residents
- 66100.0%Renter occupied
- House owners and renters - American Indian / Alaska Native residents
- 2266.9%Owner occupied
- 1133.1%Renter occupied
- House owners and renters - Asian residents
- 1319.4%Owner occupied
- 5380.6%Renter occupied
- House owners and renters - Native Hawaiian / Pacific Islander residents
- 1211.3%Owner occupied
- 9588.7%Renter occupied
- House owners and renters - Other race residents
- 3049.4%Owner occupied
- 3050.6%Renter occupied
- House owners and renters - Two or more races residents
- 6033.7%Owner occupied
- 11766.3%Renter occupied
- House owners and renters - White alone residents
- 2,63855.9%Owner occupied
- 2,08044.1%Renter occupied
- House owners and renters - Hispanic or Latino residents
- 9539.3%Owner occupied
- 14760.7%Renter occupied
Language usage in La Grande
- English speakers - Total
- 93.7% of residents of La Grande speak English at home.
- 2.3% of residents speak Spanish at home
- 20872.0%Speak English very well
- 8128.0%Speak English less than very well
- 3.8% of residents speak other language at home
- 33269.6%Speak English very well
- 14530.4%Speak English less than very well
- English speakers - Born in the United States
- 96.0% of residents of La Grande speak English at home.
- 1.5% of residents speak Spanish at home
- 4358.1%Speak English very well
- 3141.9%Speak English less than very well
- 2.4% of residents speak other language at home
- 8871.5%Speak English very well
- 3528.5%Speak English less than very well
- English speakers - Native, born elsewhere
- 54.8% of residents of La Grande speak English at home.
- 13.5% of residents speak Spanish at home
- 17100.0%Speak English very well
- 29.4% of residents speak other language at home
- 37100.0%Speak English very well
- English speakers - Foreign-born
- 19.7% of residents of La Grande speak English at home.
- 18.6% of residents speak Spanish at home
- 5160.0%Speak English very well
- 3440.0%Speak English less than very well
- 58.7% of residents speak other language at home
- 17163.6%Speak English very well
- 9836.4%Speak English less than very well
White (Caucasian) - Speak only English
| Native: | 98.9% (10,440) |
| Foreign-born: | 46.4% (18) |
White (Caucasian) - Speak another language
| Native: | 1.7% (176) |
| Foreign-born: | 55.8% (22) |
Black or African American - Speak only English
| Native: | 99.5% (127) |
| Foreign-born: | 43.0% (15) |
Asian - Speak only English
| Native: | 35.3% (28) |
| Foreign-born: | 40.0% (57) |
Asian - Speak another language
| Native: | 63.7% (50) |
| Foreign-born: | 61.5% (88) |
Native Hawaiian / Pacific Islander - Speak another language
| Native: | 20.4% (18) |
| Foreign-born: | 96.9% (168) |
Other race - Speak another language
| Native: | 34.2% (86) |
| Foreign-born: | 100.0% (13) |
Two or more races - Speak another language
| Native: | 3.7% (20) |
| Foreign-born: | 100.0% (45) |
White alone - Speak only English
| Native: | 98.3% (10,114) |
| Foreign-born: | 44.1% (19) |
White alone - Speak another language
| Native: | 1.7% (173) |
| Foreign-born: | 55.9% (24) |
Hispanic or Latino - Speak another language
| Native: | 23.0% (165) |
| Foreign-born: | 99.4% (86) |
Foreign-born residents in La Grande
479 residents are foreign born (1.5% Oceania, 1.0% Asia, 0.7% Latin America).
| This city: | 3.6% |
| Oregon: | 9.8% |


Marital status for residents in La Grande
Marital status - White (Caucasian) population 15 years and over
- Males
- 38.6%Never married
- 45.2%Now married
- 1.9%Separated
- 5.0%Widowed
- 9.2%Divorced
- Females
- 31.9%Never married
- 38.8%Now married
- 3.4%Separated
- 9.9%Widowed
- 16.1%Divorced
Women who gave birth in the past 12 months
| Now married: | 100.0% (76) |
| Unmarried: | 0.0% (0) |
Women who did not give birth in the past 12 months
| Now married: | 37.3% (930) |
| Unmarried: | 62.7% (1,563) |
Marital status - Black or African American population 15 years and over
- Males
- 100.0%Never married
- 0.0%Now married
- 0.0%Separated
- 0.0%Widowed
- 0.0%Divorced
- Females
- 100.0%Never married
- 0.0%Now married
- 0.0%Separated
- 0.0%Widowed
- 0.0%Divorced
Women who did not give birth in the past 12 months
| Now married: | 0.0% (0) |
| Unmarried: | 100.0% (27) |
Marital status - American Indian / Alaska Native population 15 years and over
- Males
- 8.9%Never married
- 89.3%Now married
- 0.0%Separated
- 0.0%Widowed
- 1.8%Divorced
- Females
- 72.7%Never married
- 0.0%Now married
- 0.0%Separated
- 0.0%Widowed
- 27.3%Divorced
Women who did not give birth in the past 12 months
| Now married: | 0.0% (0) |
| Unmarried: | 100.0% (31) |
Marital status - Asian population 15 years and over
- Males
- 32.7%Never married
- 37.8%Now married
- 0.0%Separated
- 0.0%Widowed
- 29.6%Divorced
- Females
- 55.2%Never married
- 43.7%Now married
- 0.0%Separated
- 0.0%Widowed
- 1.1%Divorced
Women who did not give birth in the past 12 months
| Now married: | 38.5% (31) |
| Unmarried: | 61.5% (50) |
Marital status - Native Hawaiian / Pacific Islander population 15 years and over
- Males
- 48.8%Never married
- 39.2%Now married
- 0.0%Separated
- 12.0%Widowed
- 0.0%Divorced
- Females
- 46.5%Never married
- 41.9%Now married
- 0.0%Separated
- 0.0%Widowed
- 11.6%Divorced
Women who did not give birth in the past 12 months
| Now married: | 70.6% (38) |
| Unmarried: | 29.4% (16) |
Marital status - Other race population 15 years and over
- Males
- 81.4%Never married
- 18.6%Now married
- 0.0%Separated
- 0.0%Widowed
- 0.0%Divorced
- Females
- 42.4%Never married
- 44.1%Now married
- 0.0%Separated
- 0.0%Widowed
- 13.6%Divorced
Women who did not give birth in the past 12 months
| Now married: | 51.0% (36) |
| Unmarried: | 49.0% (34) |
Marital status - Two or more races population 15 years and over
- Males
- 44.8%Never married
- 41.0%Now married
- 1.5%Separated
- 3.7%Widowed
- 9.0%Divorced
- Females
- 44.5%Never married
- 37.6%Now married
- 0.0%Separated
- 3.3%Widowed
- 14.7%Divorced
Women who gave birth in the past 12 months
| Now married: | 100.0% (5) |
| Unmarried: | 0.0% (0) |
Women who did not give birth in the past 12 months
| Now married: | 39.3% (94) |
| Unmarried: | 60.7% (145) |
Marital status - White alone, not Hispanic / Latino population 15 years and over
- Males
- 37.7%Never married
- 45.9%Now married
- 2.0%Separated
- 5.1%Widowed
- 9.2%Divorced
- Females
- 30.4%Never married
- 39.5%Now married
- 3.6%Separated
- 10.4%Widowed
- 16.2%Divorced
Women who gave birth in the past 12 months
| Now married: | 100.0% (79) |
| Unmarried: | 0.0% (0) |
Women who did not give birth in the past 12 months
| Now married: | 38.1% (909) |
| Unmarried: | 61.9% (1,476) |
Marital status - Hispanic or Latino population 15 years and over
- Males
- 77.4%Never married
- 19.3%Now married
- 0.0%Separated
- 0.0%Widowed
- 3.3%Divorced
- Females
- 60.4%Never married
- 25.4%Now married
- 0.0%Separated
- 0.0%Widowed
- 14.2%Divorced
Women who did not give birth in the past 12 months
| Now married: | 24.0% (76) |
| Unmarried: | 76.0% (240) |
Ancestries in La Grande

- 1,08119.1%German
- 76413.5%American
- 63211.2%English
- 2744.8%Irish
- 1552.7%European
- 1402.5%Norwegian
- 871.5%Italian
- 771.4%Scotch-Irish
- 490.9%Scandinavian
- 420.7%French
- 370.7%Czech
- 300.5%British
- 280.5%Dutch
- 250.4%Swedish
- 200.4%Basque
- 190.3%Scottish
- 190.3%Ukrainian
- 160.3%Polish
- 140.2%French Canadian
- 130.2%Welsh
- 120.2%Ethiopian
- 110.2%Cajun
- 90.2%Portuguese
- 70.1%Northern European
- 70.1%Romanian
- 50.09%Eastern European
- 40.07%Armenian
- 40.07%Russian
- 10.02%African

Geographical mobility in La Grande

- Same house 1 year ago
- 9,04482.3%White (Caucasian)
- 159100.0%Black or African American
- 9175.4%American Indian / Alaska Native
- 231100.0%Asian
- 28091.5%Native Hawaiian / Pacific Islander
- 22786.2%Other race
- 59893.7%Two or more races
- 8,89682.1%White alone, not Hispanic / Latino
- 73084.0%Hispanic or Latino

-
- Moved within same county
- 1,0419.5%White / Caucasian
- 1512.4%American Indian / Alaska Native
- 269.9%Other race
- 274.2%Two or more races
- 1,0729.9%White alone, not Hispanic / Latino
- 526.0%Hispanic or Latino

-
- Moved within same state
- 4674.2%White / Caucasian
- 10.5%Asian
- 4414.2%Native Hawaiian / Pacific Islander
- 62.2%Other race
- 172.6%Two or more races
- 4334.0%White alone, not Hispanic / Latino
- 465.3%Hispanic or Latino

-
- Moved from different state
- 3092.8%White / Caucasian
- 95.4%Black or African American
- 64.6%American Indian / Alaska Native
- 31.0%Other race
- 40.6%Two or more races
- 2912.7%White alone, not Hispanic / Latino
- 424.8%Hispanic or Latino

-
- Moved from abroad
- 1181.1%White
- 41.2%Native Hawaiian / Pacific Islander
- 1241.1%White alone, not Hispanic / Latino

Children Nativity (place of birth) in La Grande
Place of birth for residents in La Grande
![Place of birth for the foreign-born population - Regions]()
- 204Oceania
- 132Asia
- 102Eastern Asia
- 96Americas
- 95Latin America
- 82China
- 63Central America
- 30Europe
- 29South Eastern Asia
- 28Western Europe
- 23South America
- 14Africa
- 14Eastern Africa
- 9Caribbean
- 2Northern Europe
- 1Northern America

![Place of birth for the foreign-born population - Countries]()
- 166Micronesia
- 60China
- 59Guatemala
- 22Hong Kong
- 20Singapore
- 16France
- 14Ethiopia
- 13Chile
- 12Netherlands
- 12Japan
- 10Peru
- 9Philippines
- 9Dominican Republic
- 8Korea
- 4Mexico
- 2England
- 1Canada

Zip codes: 97850.