Races in Kenosha, Wisconsin (WI) Detailed Stats
Data:
Races - White alone (%)
Races - White alone (% change since 2000)
Races - Black alone (%)
Races - Black alone (% change since 2000)
Races - American Indian alone (%)
Races - American Indian alone (% change since 2000)
Races - Asian alone (%)
Races - Asian alone (% change since 2000)
Races - Hispanic (%)
Races - Hispanic (% change since 2000)
Races - Native Hawaiian and Other Pacific Islander alone (%)
Races - Native Hawaiian and Other Pacific Islander alone (% change since 2000)
Races - Two or more races(%)
Races - Two or more races(% change since 2000)
Races - Other race alone (%)
Races - Other race alone (% change since 2000)
Racial diversity
Place of birth - Born in state of residence (%)
Place of birth - Born in state of residence (%) - White
Place of birth - Born in state of residence (%) - Black or African American
Place of birth - Born in state of residence (%) - Asian
Place of birth - Born in state of residence (%) - Hispanic or Latino
Place of birth - Born in state of residence (%) - American Indian and Alaska Native
Place of birth - Born in state of residence (%) - Multirace
Place of birth - Born in state of residence (%) - Other Race
Place of birth - Born in other state (%)
Place of birth - Born in other state (%) - White
Place of birth - Born in other state (%) - Black or African American
Place of birth - Born in other state (%) - Asian
Place of birth - Born in other state (%) - Hispanic or Latino
Place of birth - Born in other state (%) - American Indian and Alaska Native
Place of birth - Born in other state (%) - Multirace
Place of birth - Born in other state (%) - Other Race
Place of birth - Native, outside of US (%)
Place of birth - Native, outside of US (%) - White
Place of birth - Native, outside of US (%) - Black or African American
Place of birth - Native, outside of US (%) - Asian
Place of birth - Native, outside of US (%) - Hispanic or Latino
Place of birth - Native, outside of US (%) - American Indian and Alaska Native
Place of birth - Native, outside of US (%) - Multirace
Place of birth - Native, outside of US (%) - Other Race
Place of birth - Foreign born (%)
Place of birth - Foreign born (%) - White
Place of birth - Foreign born (%) - Black or African American
Place of birth - Foreign born (%) - Asian
Place of birth - Foreign born (%) - Hispanic or Latino
Place of birth - Foreign born (%) - American Indian and Alaska Native
Place of birth - Foreign born (%) - Multirace
Place of birth - Foreign born (%) - Other Race
Residents speaking English at home (%)
Residents speaking English at home - Born in the United States (%)
Residents speaking English at home - Native, born elsewhere (%)
Residents speaking English at home - Foreign born (%)
Residents speaking Spanish at home (%)
Residents speaking Spanish at home - Born in the United States (%)
Residents speaking Spanish at home - Native, born elsewhere (%)
Residents speaking Spanish at home - Foreign born (%)
Residents speaking other language at home (%)
Residents speaking other language at home - Born in the United States (%)
Residents speaking other language at home - Native, born elsewhere (%)
Residents speaking other language at home - Foreign born (%)
Marital status - Never married (%)
Marital status - Now married (%)
Marital status - Separated (%)
Marital status - Widowed (%)
Marital status - Divorced (%)
Ancestries Reported - Arab (%)
Ancestries Reported - Czech (%)
Ancestries Reported - Danish (%)
Ancestries Reported - Dutch (%)
Ancestries Reported - English (%)
Ancestries Reported - French (%)
Ancestries Reported - French Canadian (%)
Ancestries Reported - German (%)
Ancestries Reported - Greek (%)
Ancestries Reported - Hungarian (%)
Ancestries Reported - Irish (%)
Ancestries Reported - Italian (%)
Ancestries Reported - Lithuanian (%)
Ancestries Reported - Norwegian (%)
Ancestries Reported - Polish (%)
Ancestries Reported - Portuguese (%)
Ancestries Reported - Russian (%)
Ancestries Reported - Scotch-Irish (%)
Ancestries Reported - Scottish (%)
Ancestries Reported - Slovak (%)
Ancestries Reported - Subsaharan African (%)
Ancestries Reported - Swedish (%)
Ancestries Reported - Swiss (%)
Ancestries Reported - Ukrainian (%)
Ancestries Reported - United States (%)
Ancestries Reported - Welsh (%)
Ancestries Reported - West Indian (%)
Ancestries Reported - Other (%)
Geographical mobility - Same house 1 year ago (%)
Geographical mobility - Same house 1 year ago (%) - White
Geographical mobility - Same house 1 year ago (%) - Black or African American
Geographical mobility - Same house 1 year ago (%) - Asian
Geographical mobility - Same house 1 year ago (%) - Hispanic or Latino
Geographical mobility - Same house 1 year ago (%) - American Indian and Alaska Native
Geographical mobility - Same house 1 year ago (%) - Multirace
Geographical mobility - Same house 1 year ago (%) - Other Race
Geographical mobility - Moved within same county (%)
Geographical mobility - Moved within same county (%) - White
Geographical mobility - Moved within same county (%) - Black or African American
Geographical mobility - Moved within same county (%) - Asian
Geographical mobility - Moved within same county (%) - Hispanic or Latino
Geographical mobility - Moved within same county (%) - American Indian and Alaska Native
Geographical mobility - Moved within same county (%) - Multirace
Geographical mobility - Moved within same county (%) - Other Race
Geographical mobility - Moved from different county within same state (%)
Geographical mobility - Moved from different county within same state (%) - White
Geographical mobility - Moved from different county within same state (%) - Black or African American
Geographical mobility - Moved from different county within same state (%) - Asian
Geographical mobility - Moved from different county within same state (%) - Hispanic or Latino
Geographical mobility - Moved from different county within same state (%) - American Indian and Alaska Native
Geographical mobility - Moved from different county within same state (%) - Multirace
Geographical mobility - Moved from different county within same state (%) - Other Race
Geographical mobility - Moved from different state (%)
Geographical mobility - Moved from different state (%) - White
Geographical mobility - Moved from different state (%) - Black or African American
Geographical mobility - Moved from different state (%) - Asian
Geographical mobility - Moved from different state (%) - Hispanic or Latino
Geographical mobility - Moved from different state (%) - American Indian and Alaska Native
Geographical mobility - Moved from different state (%) - Multirace
Geographical mobility - Moved from different state (%) - Other Race
Geographical mobility - Moved from abroad (%)
Geographical mobility - Moved from abroad (%) - White
Geographical mobility - Moved from abroad (%) - Black or African American
Geographical mobility - Moved from abroad (%) - Asian
Geographical mobility - Moved from abroad (%) - Hispanic or Latino
Geographical mobility - Moved from abroad (%) - American Indian and Alaska Native
Geographical mobility - Moved from abroad (%) - Multirace
Geographical mobility - Moved from abroad (%) - Other Race
Place of birth for the foreign-born population - Ireland (%)
Place of birth for the foreign-born population - Denmark (%)
Place of birth for the foreign-born population - Norway (%)
Place of birth for the foreign-born population - Sweden (%)
Place of birth for the foreign-born population - United Kingdom (%)
Place of birth for the foreign-born population - England (%)
Place of birth for the foreign-born population - Scotland (%)
Place of birth for the foreign-born population - Other Northern Europe (%)
Place of birth for the foreign-born population - Austria (%)
Place of birth for the foreign-born population - Belgium (%)
Place of birth for the foreign-born population - France (%)
Place of birth for the foreign-born population - Germany (%)
Place of birth for the foreign-born population - Netherlands (%)
Place of birth for the foreign-born population - Switzerland (%)
Place of birth for the foreign-born population - Other Western Europe (%)
Place of birth for the foreign-born population - Greece (%)
Place of birth for the foreign-born population - Italy (%)
Place of birth for the foreign-born population - Portugal (%)
Place of birth for the foreign-born population - Spain (%)
Place of birth for the foreign-born population - Other Southern Europe (%)
Place of birth for the foreign-born population - Albania (%)
Place of birth for the foreign-born population - Belarus (%)
Place of birth for the foreign-born population - Bosnia and Herzegovina (%)
Place of birth for the foreign-born population - Bulgaria (%)
Place of birth for the foreign-born population - Croatia (%)
Place of birth for the foreign-born population - Czechoslovakia (%)
Place of birth for the foreign-born population - Hungary (%)
Place of birth for the foreign-born population - Latvia (%)
Place of birth for the foreign-born population - Lithuania (%)
Place of birth for the foreign-born population - North Macedonia (Macedonia) (%)
Place of birth for the foreign-born population - Moldova (%)
Place of birth for the foreign-born population - Poland (%)
Place of birth for the foreign-born population - Romania (%)
Place of birth for the foreign-born population - Russia (%)
Place of birth for the foreign-born population - Serbia (%)
Place of birth for the foreign-born population - Ukraine (%)
Place of birth for the foreign-born population - Other Eastern Europe (%)
Place of birth for the foreign-born population - China (%)
Place of birth for the foreign-born population - Hong Kong (%)
Place of birth for the foreign-born population - Taiwan (%)
Place of birth for the foreign-born population - Japan (%)
Place of birth for the foreign-born population - Korea (%)
Place of birth for the foreign-born population - Other Eastern Asia (%)
Place of birth for the foreign-born population - Afghanistan (%)
Place of birth for the foreign-born population - Bangladesh (%)
Place of birth for the foreign-born population - India (%)
Place of birth for the foreign-born population - Iran (%)
Place of birth for the foreign-born population - Kazakhstan (%)
Place of birth for the foreign-born population - Nepal (%)
Place of birth for the foreign-born population - Pakistan (%)
Place of birth for the foreign-born population - Sri Lanka (%)
Place of birth for the foreign-born population - Uzbekistan (%)
Place of birth for the foreign-born population - Other South Central Asia (%)
Place of birth for the foreign-born population - Burma (%)
Place of birth for the foreign-born population - Cambodia (%)
Place of birth for the foreign-born population - Indonesia (%)
Place of birth for the foreign-born population - Laos (%)
Place of birth for the foreign-born population - Malaysia (%)
Place of birth for the foreign-born population - Philippines (%)
Place of birth for the foreign-born population - Singapore (%)
Place of birth for the foreign-born population - Thailand (%)
Place of birth for the foreign-born population - Vietnam (%)
Place of birth for the foreign-born population - Other South Eastern Asia (%)
Place of birth for the foreign-born population - Armenia (%)
Place of birth for the foreign-born population - Iraq (%)
Place of birth for the foreign-born population - Israel (%)
Place of birth for the foreign-born population - Jordan (%)
Place of birth for the foreign-born population - Kuwait (%)
Place of birth for the foreign-born population - Lebanon (%)
Place of birth for the foreign-born population - Saudi Arabia (%)
Place of birth for the foreign-born population - Syria (%)
Place of birth for the foreign-born population - Turkey (%)
Place of birth for the foreign-born population - Yemen (%)
Place of birth for the foreign-born population - Other Western Asia (%)
Place of birth for the foreign-born population - Eritrea (%)
Place of birth for the foreign-born population - Ethiopia (%)
Place of birth for the foreign-born population - Kenya (%)
Place of birth for the foreign-born population - Somalia (%)
Place of birth for the foreign-born population - Uganda (%)
Place of birth for the foreign-born population - Zimbabwe (%)
Place of birth for the foreign-born population - Other Eastern Africa (%)
Place of birth for the foreign-born population - Cameroon (%)
Place of birth for the foreign-born population - Congo (%)
Place of birth for the foreign-born population - Democratic Republic of Congo (Zaire) (%)
Place of birth for the foreign-born population - Other Middle Africa (%)
Place of birth for the foreign-born population - Egypt (%)
Place of birth for the foreign-born population - Morocco (%)
Place of birth for the foreign-born population - Sudan (%)
Place of birth for the foreign-born population - Other Northern Africa (%)
Place of birth for the foreign-born population - South Africa (%)
Place of birth for the foreign-born population - Other Southern Africa (%)
Place of birth for the foreign-born population - Cabo Verde (%)
Place of birth for the foreign-born population - Ghana (%)
Place of birth for the foreign-born population - Liberia (%)
Place of birth for the foreign-born population - Nigeria (%)
Place of birth for the foreign-born population - Senegal (%)
Place of birth for the foreign-born population - Sierra Leone (%)
Place of birth for the foreign-born population - Other Western Africa (%)
Place of birth for the foreign-born population - Australia (%)
Place of birth for the foreign-born population - New Zealand (%)
Place of birth for the foreign-born population - Fiji (%)
Place of birth for the foreign-born population - Micronesia (%)
Place of birth for the foreign-born population - Bahamas (%)
Place of birth for the foreign-born population - Barbados (%)
Place of birth for the foreign-born population - Cuba (%)
Place of birth for the foreign-born population - Dominica (%)
Place of birth for the foreign-born population - Dominican Republic (%)
Place of birth for the foreign-born population - Grenada (%)
Place of birth for the foreign-born population - Haiti (%)
Place of birth for the foreign-born population - Jamaica (%)
Place of birth for the foreign-born population - St. Vincent and the Grenadines (%)
Place of birth for the foreign-born population - Trinidad and Tobago (%)
Place of birth for the foreign-born population - West Indies (%)
Place of birth for the foreign-born population - Other Caribbean (%)
Place of birth for the foreign-born population - Belize (%)
Place of birth for the foreign-born population - Costa Rica (%)
Place of birth for the foreign-born population - El Salvador (%)
Place of birth for the foreign-born population - Guatemala (%)
Place of birth for the foreign-born population - Honduras (%)
Place of birth for the foreign-born population - Mexico (%)
Place of birth for the foreign-born population - Nicaragua (%)
Place of birth for the foreign-born population - Panama (%)
Place of birth for the foreign-born population - Other Central America (%)
Place of birth for the foreign-born population - Argentina (%)
Place of birth for the foreign-born population - Bolivia (%)
Place of birth for the foreign-born population - Brazil (%)
Place of birth for the foreign-born population - Chile (%)
Place of birth for the foreign-born population - Colombia (%)
Place of birth for the foreign-born population - Ecuador (%)
Place of birth for the foreign-born population - Guyana (%)
Place of birth for the foreign-born population - Peru (%)
Place of birth for the foreign-born population - Uruguay (%)
Place of birth for the foreign-born population - Venezuela (%)
Place of birth for the foreign-born population - Other South America (%)
Place of birth for the foreign-born population - Canada (%)
Place of birth for the foreign-born population - Other Northern America (%)
Place of birth for the foreign-born population - Other (%)
Latest news about races in Kenosha, WI collected exclusively by city-data.com from local newspapers, TV, and radio stations
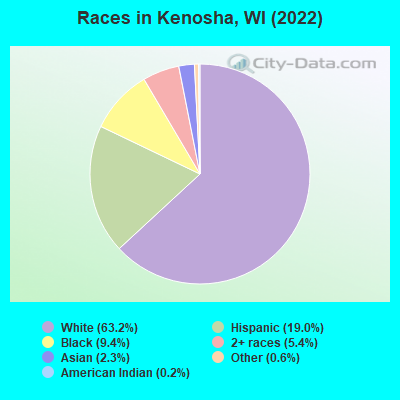
According to 2022 data, the most numerous races in Kenosha, WI are White alone (62,513 residents), Hispanic (18,837 residents), and Black alone (9,310 residents). 86.8% of Kenosha residents speak English at home. 8.9% of Kenosha, WI residents are foreign-born (5.1% born in Latin America, 1.8% born in Europe, 1.5% born in Asia), which is 43.6% greater than the foreign-born rate of 5.0% across the entire state of Wisconsin.
Race distribution in Kenosha
2000 2022
4,681,630 87.3% White alone 300,245 5.6% Black alone 192,921 3.6% Hispanic 87,995 1.6% Asian alone 51,921 1.0% Two or more races 43,980 0.8% American Indian alone 3,637 0.07% Other race alone 1,346 0.03% Native Hawaiian and Other
4,654,031 79.0% White alone 447,022 7.6% Hispanic 345,678 5.9% Black alone 217,532 3.7% Two or more races 172,242 2.9% Asian alone 33,762 0.6% American Indian alone 19,680 0.3% Other race alone 2,592 0.04% Native Hawaiian and Other
Income and house value in Kenosha Median household income in 2022 $64,993 White non-Hispanic householders$38,902 Black householders$156,084 Asian householders$44,193 Some other race householders$85,380 Two or more races householders$72,669 Hispanic or Latino race householdersMedian 2022 house value $213,084 White Non-Hispanic householders$180,543 Black or African American householders$171,526 American Indian or Alaska Native householders $260,720 Asian householders$192,109 Some other race householders$219,945 Two or more races householders$193,873 Hispanic or Latino householders
Median age by race in Kenosha
41.7 Median age for White residents41.6 42.0 33.1 Median age for Black or African American residents33.5 28.8 26.4 Median age for American Indian / Alaska Native residents51.6 29.5 37.4 Median age for Asian residents36.7 37.7 -666,666,666.0 Median age for Native Hawaiian / Pacific Islander residents-666,666,666.0 -666,666,666.0 31.0 Median age for Other race residents25.3 43.0 24.8 Median age for Two or more races residents24.3 26.1 43.1 Median age for White alone residents42.6 43.8 27.1 Median age for Hispanic or Latino residents27.5 25.8
Owner/renter occupied households by race in Kenosha
House owners and renters - White residents 20,768 66.1% Owner occupied10,672 33.9% Renter occupiedHouse owners and renters - Black or African American residents 1,000 24.9% Owner occupied3,011 75.1% Renter occupiedHouse owners and renters - American Indian / Alaska Native residents 79 43.0% Owner occupied105 57.0% Renter occupiedHouse owners and renters - Asian residents 574 75.1% Owner occupied190 24.9% Renter occupiedHouse owners and renters - Native Hawaiian / Pacific Islander residents 12 52.1% Owner occupied11 47.9% Renter occupiedHouse owners and renters - Other race residents 698 43.5% Owner occupied908 56.5% Renter occupiedHouse owners and renters - Two or more races residents 1,733 55.0% Owner occupied1,418 45.0% Renter occupiedHouse owners and renters - White alone residents 20,112 66.8% Owner occupied9,981 33.2% Renter occupiedHouse owners and renters - Hispanic or Latino residents 2,701 53.3% Owner occupied2,367 46.7% Renter occupied
Language usage in Kenosha
English speakers - Total 86.8% of residents of Kenosha speak English at home.
9.4% of residents speak Spanish at home 5,892 66.6% Speak English very well2,959 33.4% Speak English less than very well3.8% of residents speak other language at home 1,953 54.9% Speak English very well1,602 45.1% Speak English less than very well
English speakers - Born in the United States 87.6% of residents of Kenosha speak English at home.
11.1% of residents speak Spanish at home 3,171 79.9% Speak English very well800 20.1% Speak English less than very well1.3% of residents speak other language at home 468 100.0% Speak English very well
English speakers - Native, born elsewhere 59.7% of residents of Kenosha speak English at home.
40.3% of residents speak Spanish at home 105 22.3% Speak English very well366 77.7% Speak English less than very well
English speakers - Foreign-born 17.5% of residents of Kenosha speak English at home.
42.4% of residents speak Spanish at home 1,245 44.8% Speak English very well1,531 55.2% Speak English less than very well40.1% of residents speak other language at home 1,072 40.9% Speak English very well1,550 59.1% Speak English less than very well
White (Caucasian) - Speak only English Native:
98.1% (63,821)Foreign-born:
55.7% (610)
White (Caucasian) - Speak another language Native:
1.9% (1,250)Foreign-born:
44.3% (486)
Black or African American - Speak only English Native:
97.6% (8,463)Foreign-born:
29.2% (142)
Black or African American - Speak another language Native:
2.1% (178)Foreign-born:
72.2% (351)
American Indian / Alaska Native - Speak only English Native:
85.0% (404)Foreign-born:
31.9% (16)
American Indian / Alaska Native - Speak another language Native:
15.1% (72)Foreign-born:
67.6% (33)
Asian - Speak only English Native:
29.0% (170)Foreign-born:
10.6% (182)
Asian - Speak another language Native:
71.0% (416)Foreign-born:
89.4% (1,537)
Native Hawaiian / Pacific Islander - Speak only English Native:
99.5% (63)Foreign-born:
96.3% (8)
Other race - Speak only English Native:
67.3% (1,867)Foreign-born:
18.8% (123)
Other race - Speak another language Native:
24.4% (678)Foreign-born:
77.5% (506)
Two or more races - Speak only English Native:
61.3% (6,961)Foreign-born:
5.2% (126)
Two or more races - Speak another language Native:
38.7% (4,390)Foreign-born:
94.8% (2,299)
White alone - Speak only English Native:
98.4% (61,212)Foreign-born:
52.1% (476)
White alone - Speak another language Native:
1.6% (968)Foreign-born:
47.9% (438)
Hispanic or Latino - Speak only English Native:
56.1% (6,847)Foreign-born:
14.9% (485)
Hispanic or Latino - Speak another language Native:
43.9% (5,363)Foreign-born:
85.1% (2,776)
Foreign-born residents in Kenosha 8,769 residents are foreign born (5.1% Latin America , 1.8% Europe , 1.5% Asia ).
This city:
8.9%Wisconsin:
5.0%
Marital status for residents in Kenosha Marital status - White (Caucasian) population 15 years and over
Males 33.8% Never married47.1% Now married0.7% Separated3.7% Widowed14.6% DivorcedFemales 32.6% Never married41.6% Now married0.2% Separated8.5% Widowed17.2% DivorcedWomen who gave birth in the past 12 months Now married:
59.3% (678)Unmarried:
40.7% (465)
Women who did not give birth in the past 12 months Now married:
36.9% (5,869)Unmarried:
63.1% (10,023)
Marital status - Black or African American population 15 years and over
Males 46.3% Never married28.3% Now married0.0% Separated10.9% Widowed14.5% DivorcedFemales 67.0% Never married21.9% Now married0.0% Separated2.7% Widowed8.4% DivorcedWomen who gave birth in the past 12 months Now married:
39.4% (86)Unmarried:
60.6% (132)
Women who did not give birth in the past 12 months Now married:
33.7% (895)Unmarried:
66.3% (1,762)
Marital status - American Indian / Alaska Native population 15 years and over
Males 60.8% Never married32.9% Now married0.0% Separated0.0% Widowed6.3% DivorcedFemales 45.5% Never married20.7% Now married7.8% Separated15.7% Widowed10.3% DivorcedWomen who did not give birth in the past 12 months Now married:
30.6% (70)Unmarried:
69.4% (159)
Marital status - Asian population 15 years and over
Males 16.4% Never married46.3% Now married0.0% Separated35.5% Widowed1.8% DivorcedFemales 18.3% Never married71.5% Now married0.0% Separated0.0% Widowed10.2% DivorcedWomen who gave birth in the past 12 months Now married:
71.1% (27)Unmarried:
28.9% (11)
Women who did not give birth in the past 12 months Now married:
61.7% (352)Unmarried:
38.3% (219)
Marital status - Native Hawaiian / Pacific Islander population 15 years and over
Males 0.0% Never married100.0% Now married0.0% Separated0.0% Widowed0.0% DivorcedFemales 0.0% Never married100.0% Now married0.0% Separated0.0% Widowed0.0% DivorcedWomen who did not give birth in the past 12 months Now married:
100.0% (7)Unmarried:
0.0% (0)
Marital status - Other race population 15 years and over
Males 53.1% Never married31.2% Now married4.0% Separated0.5% Widowed11.2% DivorcedFemales 56.9% Never married41.1% Now married0.0% Separated0.9% Widowed1.1% DivorcedWomen who gave birth in the past 12 months Now married:
52.6% (27)Unmarried:
47.4% (25)
Women who did not give birth in the past 12 months Now married:
30.9% (301)Unmarried:
69.1% (675)
Marital status - Two or more races population 15 years and over
Males 52.7% Never married43.5% Now married0.0% Separated0.0% Widowed3.8% DivorcedFemales 28.2% Never married68.4% Now married0.0% Separated0.8% Widowed2.6% DivorcedWomen who gave birth in the past 12 months Now married:
62.5% (93)Unmarried:
37.5% (56)
Women who did not give birth in the past 12 months Now married:
50.6% (2,117)Unmarried:
49.4% (2,064)
Marital status - White alone, not Hispanic / Latino population 15 years and over
Males 34.1% Never married46.7% Now married0.0% Separated3.9% Widowed15.3% DivorcedFemales 31.3% Never married42.5% Now married0.2% Separated8.7% Widowed17.3% DivorcedWomen who gave birth in the past 12 months Now married:
68.5% (678)Unmarried:
31.5% (312)
Women who did not give birth in the past 12 months Now married:
38.1% (5,821)Unmarried:
61.9% (9,471)
Marital status - Hispanic or Latino population 15 years and over
Males 50.7% Never married41.0% Now married1.9% Separated0.5% Widowed6.0% DivorcedFemales 40.1% Never married46.4% Now married3.9% Separated2.4% Widowed7.2% DivorcedWomen who gave birth in the past 12 months Now married:
44.2% (95)Unmarried:
55.8% (120)
Women who did not give birth in the past 12 months Now married:
45.5% (2,273)Unmarried:
54.5% (2,725)
Ancestries in Kenosha
6,571 14.1% German2,937 6.3% Italian2,200 4.7% American2,111 4.5% Irish1,840 3.9% Polish1,240 2.7% English915 2.0% European834 1.8% Norwegian667 1.4% Albanian285 0.6% Dutch273 0.6% French264 0.6% Swedish258 0.6% Scottish226 0.5% Danish222 0.5% Scandinavian215 0.5% Finnish168 0.4% Nigerian167 0.4% Greek159 0.3% Lithuanian156 0.3% African148 0.3% French Canadian131 0.3% Czech131 0.3% Russian102 0.2% Slovak99 0.2% Hungarian88 0.2% Slavic78 0.2% British75 0.2% Serbian69 0.1% Scotch-Irish67 0.1% Brazilian65 0.1% Eastern European65 0.1% Canadian47 0.1% Ukrainian43 0.09% Arab41 0.09% Haitian40 0.09% Yugoslavian36 0.08% Jordanian32 0.07% Armenian27 0.06% Czechoslovakian20 0.04% Belgian17 0.04% Macedonian16 0.03% Romanian16 0.03% Bulgarian16 0.03% Jamaican13 0.03% Swiss12 0.03% Iranian12 0.03% Lebanese11 0.02% Portuguese11 0.02% Turkish11 0.02% Egyptian10 0.02% Australian10 0.02% New Zealander9 0.02% Icelander8 0.02% Ugandan8 0.02% Latvian7 0.01% Luxembourger4 0.01% Croatian3 0.01% Northern European
Geographical mobility in Kenosha Same house 1 year ago 60,986 89.8% White (Caucasian)8,415 86.4% Black or African American452 84.4% American Indian / Alaska Native1,703 76.8% Asian71 100.0% Native Hawaiian / Pacific Islander2,493 81.0% Other race11,284 76.5% Two or more races57,874 89.6% White alone, not Hispanic / Latino13,844 74.9% Hispanic or LatinoMoved within same county 4,454 6.6% White / Caucasian663 6.8% Black or African American72 13.5% American Indian / Alaska Native93 4.2% Asian295 9.6% Other race2,543 17.2% Two or more races4,242 6.6% White alone, not Hispanic / Latino1,908 10.3% Hispanic or LatinoMoved within same state 954 1.4% White / Caucasian421 4.3% Black or African American6 1.0% American Indian / Alaska Native298 13.4% Asian112 3.6% Other race360 2.4% Two or more races954 1.5% White alone, not Hispanic / Latino571 3.1% Hispanic or LatinoMoved from different state 1,410 2.1% White / Caucasian209 2.1% Black or African American4 0.8% American Indian / Alaska Native128 5.7% Asian46 1.5% Other race556 3.8% Two or more races1,410 2.2% White alone, not Hispanic / Latino1,436 7.8% Hispanic or LatinoMoved from abroad 80 0.1% White20 0.2% Black or African American112 3.6% Other race80 0.1% White alone, not Hispanic / Latino137 0.7% Hispanic or Latino
Children Nativity (place of birth) in Kenosha
Children under 6 years - Living with two parents Both parents native 3,169 100.0% NativeBoth parents foreign-born 515 75.1% Native171 24.9% Foreign-bornOne native, one foreign-born parent 389 100.0% NativeChildren under 6 years - Living with one parent Native parent 2,197 100.0% NativeForeign-born parent 266 86.6% Native41 13.4% Foreign-bornChildren 6 to 17 years - Living with two parents Both parents native 6,523 100.0% Native1 0.0% Foreign-bornBoth parents foreign-born 1,213 91.9% Native107 8.1% Foreign-bornOne native, one foreign-born parent 1,000 97.8% Native22 2.2% Foreign-bornChildren 6 to 17 years - Living with one parent Native parent 5,943 100.0% NativeForeign-born parent 551 50.0% Native551 50.0% Foreign-born
Grandparents responsible for own grandchildren in Kenosha
Grandparents (30 to 59 years) White / Caucasian 142 58.7% Responsible for grandchildren100 41.3% Not responsible for grandchildrenBlack or African American 28 23.3% Responsible for grandchildren92 76.7% Not responsible for grandchildrenOther race 16 100.0% Not responsible for grandchildrenTwo or more races 3 1.6% Responsible for grandchildren169 98.4% Not responsible for grandchildrenWhite alone, not Hispanic / Latino 67 50.9% Responsible for grandchildren65 49.1% Not responsible for grandchildrenHispanic or Latino 89 35.8% Responsible for grandchildren161 64.2% Not responsible for grandchildrenGrandparents (60 years and over) White / Caucasian 247 46.6% Responsible for grandchildren284 53.4% Not responsible for grandchildrenBlack or African American 14 100.0% Not responsible for grandchildrenOther race 8 13.0% Responsible for grandchildren57 87.0% Not responsible for grandchildrenTwo or more races 33 22.8% Responsible for grandchildren112 77.2% Not responsible for grandchildrenWhite alone, not Hispanic / Latino 250 64.3% Responsible for grandchildren139 35.7% Not responsible for grandchildrenHispanic or Latino 27 8.4% Responsible for grandchildren297 91.6% Not responsible for grandchildren