Races in Kenner, Louisiana (LA) Detailed Stats
Data:
Races - White alone (%)
Races - White alone (% change since 2000)
Races - Black alone (%)
Races - Black alone (% change since 2000)
Races - American Indian alone (%)
Races - American Indian alone (% change since 2000)
Races - Asian alone (%)
Races - Asian alone (% change since 2000)
Races - Hispanic (%)
Races - Hispanic (% change since 2000)
Races - Native Hawaiian and Other Pacific Islander alone (%)
Races - Native Hawaiian and Other Pacific Islander alone (% change since 2000)
Races - Two or more races(%)
Races - Two or more races(% change since 2000)
Races - Other race alone (%)
Races - Other race alone (% change since 2000)
Racial diversity
Place of birth - Born in state of residence (%)
Place of birth - Born in state of residence (%) - White
Place of birth - Born in state of residence (%) - Black or African American
Place of birth - Born in state of residence (%) - Asian
Place of birth - Born in state of residence (%) - Hispanic or Latino
Place of birth - Born in state of residence (%) - American Indian and Alaska Native
Place of birth - Born in state of residence (%) - Multirace
Place of birth - Born in state of residence (%) - Other Race
Place of birth - Born in other state (%)
Place of birth - Born in other state (%) - White
Place of birth - Born in other state (%) - Black or African American
Place of birth - Born in other state (%) - Asian
Place of birth - Born in other state (%) - Hispanic or Latino
Place of birth - Born in other state (%) - American Indian and Alaska Native
Place of birth - Born in other state (%) - Multirace
Place of birth - Born in other state (%) - Other Race
Place of birth - Native, outside of US (%)
Place of birth - Native, outside of US (%) - White
Place of birth - Native, outside of US (%) - Black or African American
Place of birth - Native, outside of US (%) - Asian
Place of birth - Native, outside of US (%) - Hispanic or Latino
Place of birth - Native, outside of US (%) - American Indian and Alaska Native
Place of birth - Native, outside of US (%) - Multirace
Place of birth - Native, outside of US (%) - Other Race
Place of birth - Foreign born (%)
Place of birth - Foreign born (%) - White
Place of birth - Foreign born (%) - Black or African American
Place of birth - Foreign born (%) - Asian
Place of birth - Foreign born (%) - Hispanic or Latino
Place of birth - Foreign born (%) - American Indian and Alaska Native
Place of birth - Foreign born (%) - Multirace
Place of birth - Foreign born (%) - Other Race
Residents speaking English at home (%)
Residents speaking English at home - Born in the United States (%)
Residents speaking English at home - Native, born elsewhere (%)
Residents speaking English at home - Foreign born (%)
Residents speaking Spanish at home (%)
Residents speaking Spanish at home - Born in the United States (%)
Residents speaking Spanish at home - Native, born elsewhere (%)
Residents speaking Spanish at home - Foreign born (%)
Residents speaking other language at home (%)
Residents speaking other language at home - Born in the United States (%)
Residents speaking other language at home - Native, born elsewhere (%)
Residents speaking other language at home - Foreign born (%)
Marital status - Never married (%)
Marital status - Now married (%)
Marital status - Separated (%)
Marital status - Widowed (%)
Marital status - Divorced (%)
Ancestries Reported - Arab (%)
Ancestries Reported - Czech (%)
Ancestries Reported - Danish (%)
Ancestries Reported - Dutch (%)
Ancestries Reported - English (%)
Ancestries Reported - French (%)
Ancestries Reported - French Canadian (%)
Ancestries Reported - German (%)
Ancestries Reported - Greek (%)
Ancestries Reported - Hungarian (%)
Ancestries Reported - Irish (%)
Ancestries Reported - Italian (%)
Ancestries Reported - Lithuanian (%)
Ancestries Reported - Norwegian (%)
Ancestries Reported - Polish (%)
Ancestries Reported - Portuguese (%)
Ancestries Reported - Russian (%)
Ancestries Reported - Scotch-Irish (%)
Ancestries Reported - Scottish (%)
Ancestries Reported - Slovak (%)
Ancestries Reported - Subsaharan African (%)
Ancestries Reported - Swedish (%)
Ancestries Reported - Swiss (%)
Ancestries Reported - Ukrainian (%)
Ancestries Reported - United States (%)
Ancestries Reported - Welsh (%)
Ancestries Reported - West Indian (%)
Ancestries Reported - Other (%)
Geographical mobility - Same house 1 year ago (%)
Geographical mobility - Same house 1 year ago (%) - White
Geographical mobility - Same house 1 year ago (%) - Black or African American
Geographical mobility - Same house 1 year ago (%) - Asian
Geographical mobility - Same house 1 year ago (%) - Hispanic or Latino
Geographical mobility - Same house 1 year ago (%) - American Indian and Alaska Native
Geographical mobility - Same house 1 year ago (%) - Multirace
Geographical mobility - Same house 1 year ago (%) - Other Race
Geographical mobility - Moved within same county (%)
Geographical mobility - Moved within same county (%) - White
Geographical mobility - Moved within same county (%) - Black or African American
Geographical mobility - Moved within same county (%) - Asian
Geographical mobility - Moved within same county (%) - Hispanic or Latino
Geographical mobility - Moved within same county (%) - American Indian and Alaska Native
Geographical mobility - Moved within same county (%) - Multirace
Geographical mobility - Moved within same county (%) - Other Race
Geographical mobility - Moved from different county within same state (%)
Geographical mobility - Moved from different county within same state (%) - White
Geographical mobility - Moved from different county within same state (%) - Black or African American
Geographical mobility - Moved from different county within same state (%) - Asian
Geographical mobility - Moved from different county within same state (%) - Hispanic or Latino
Geographical mobility - Moved from different county within same state (%) - American Indian and Alaska Native
Geographical mobility - Moved from different county within same state (%) - Multirace
Geographical mobility - Moved from different county within same state (%) - Other Race
Geographical mobility - Moved from different state (%)
Geographical mobility - Moved from different state (%) - White
Geographical mobility - Moved from different state (%) - Black or African American
Geographical mobility - Moved from different state (%) - Asian
Geographical mobility - Moved from different state (%) - Hispanic or Latino
Geographical mobility - Moved from different state (%) - American Indian and Alaska Native
Geographical mobility - Moved from different state (%) - Multirace
Geographical mobility - Moved from different state (%) - Other Race
Geographical mobility - Moved from abroad (%)
Geographical mobility - Moved from abroad (%) - White
Geographical mobility - Moved from abroad (%) - Black or African American
Geographical mobility - Moved from abroad (%) - Asian
Geographical mobility - Moved from abroad (%) - Hispanic or Latino
Geographical mobility - Moved from abroad (%) - American Indian and Alaska Native
Geographical mobility - Moved from abroad (%) - Multirace
Geographical mobility - Moved from abroad (%) - Other Race
Place of birth for the foreign-born population - Ireland (%)
Place of birth for the foreign-born population - Denmark (%)
Place of birth for the foreign-born population - Norway (%)
Place of birth for the foreign-born population - Sweden (%)
Place of birth for the foreign-born population - United Kingdom (%)
Place of birth for the foreign-born population - England (%)
Place of birth for the foreign-born population - Scotland (%)
Place of birth for the foreign-born population - Other Northern Europe (%)
Place of birth for the foreign-born population - Austria (%)
Place of birth for the foreign-born population - Belgium (%)
Place of birth for the foreign-born population - France (%)
Place of birth for the foreign-born population - Germany (%)
Place of birth for the foreign-born population - Netherlands (%)
Place of birth for the foreign-born population - Switzerland (%)
Place of birth for the foreign-born population - Other Western Europe (%)
Place of birth for the foreign-born population - Greece (%)
Place of birth for the foreign-born population - Italy (%)
Place of birth for the foreign-born population - Portugal (%)
Place of birth for the foreign-born population - Spain (%)
Place of birth for the foreign-born population - Other Southern Europe (%)
Place of birth for the foreign-born population - Albania (%)
Place of birth for the foreign-born population - Belarus (%)
Place of birth for the foreign-born population - Bosnia and Herzegovina (%)
Place of birth for the foreign-born population - Bulgaria (%)
Place of birth for the foreign-born population - Croatia (%)
Place of birth for the foreign-born population - Czechoslovakia (%)
Place of birth for the foreign-born population - Hungary (%)
Place of birth for the foreign-born population - Latvia (%)
Place of birth for the foreign-born population - Lithuania (%)
Place of birth for the foreign-born population - North Macedonia (Macedonia) (%)
Place of birth for the foreign-born population - Moldova (%)
Place of birth for the foreign-born population - Poland (%)
Place of birth for the foreign-born population - Romania (%)
Place of birth for the foreign-born population - Russia (%)
Place of birth for the foreign-born population - Serbia (%)
Place of birth for the foreign-born population - Ukraine (%)
Place of birth for the foreign-born population - Other Eastern Europe (%)
Place of birth for the foreign-born population - China (%)
Place of birth for the foreign-born population - Hong Kong (%)
Place of birth for the foreign-born population - Taiwan (%)
Place of birth for the foreign-born population - Japan (%)
Place of birth for the foreign-born population - Korea (%)
Place of birth for the foreign-born population - Other Eastern Asia (%)
Place of birth for the foreign-born population - Afghanistan (%)
Place of birth for the foreign-born population - Bangladesh (%)
Place of birth for the foreign-born population - India (%)
Place of birth for the foreign-born population - Iran (%)
Place of birth for the foreign-born population - Kazakhstan (%)
Place of birth for the foreign-born population - Nepal (%)
Place of birth for the foreign-born population - Pakistan (%)
Place of birth for the foreign-born population - Sri Lanka (%)
Place of birth for the foreign-born population - Uzbekistan (%)
Place of birth for the foreign-born population - Other South Central Asia (%)
Place of birth for the foreign-born population - Burma (%)
Place of birth for the foreign-born population - Cambodia (%)
Place of birth for the foreign-born population - Indonesia (%)
Place of birth for the foreign-born population - Laos (%)
Place of birth for the foreign-born population - Malaysia (%)
Place of birth for the foreign-born population - Philippines (%)
Place of birth for the foreign-born population - Singapore (%)
Place of birth for the foreign-born population - Thailand (%)
Place of birth for the foreign-born population - Vietnam (%)
Place of birth for the foreign-born population - Other South Eastern Asia (%)
Place of birth for the foreign-born population - Armenia (%)
Place of birth for the foreign-born population - Iraq (%)
Place of birth for the foreign-born population - Israel (%)
Place of birth for the foreign-born population - Jordan (%)
Place of birth for the foreign-born population - Kuwait (%)
Place of birth for the foreign-born population - Lebanon (%)
Place of birth for the foreign-born population - Saudi Arabia (%)
Place of birth for the foreign-born population - Syria (%)
Place of birth for the foreign-born population - Turkey (%)
Place of birth for the foreign-born population - Yemen (%)
Place of birth for the foreign-born population - Other Western Asia (%)
Place of birth for the foreign-born population - Eritrea (%)
Place of birth for the foreign-born population - Ethiopia (%)
Place of birth for the foreign-born population - Kenya (%)
Place of birth for the foreign-born population - Somalia (%)
Place of birth for the foreign-born population - Uganda (%)
Place of birth for the foreign-born population - Zimbabwe (%)
Place of birth for the foreign-born population - Other Eastern Africa (%)
Place of birth for the foreign-born population - Cameroon (%)
Place of birth for the foreign-born population - Congo (%)
Place of birth for the foreign-born population - Democratic Republic of Congo (Zaire) (%)
Place of birth for the foreign-born population - Other Middle Africa (%)
Place of birth for the foreign-born population - Egypt (%)
Place of birth for the foreign-born population - Morocco (%)
Place of birth for the foreign-born population - Sudan (%)
Place of birth for the foreign-born population - Other Northern Africa (%)
Place of birth for the foreign-born population - South Africa (%)
Place of birth for the foreign-born population - Other Southern Africa (%)
Place of birth for the foreign-born population - Cabo Verde (%)
Place of birth for the foreign-born population - Ghana (%)
Place of birth for the foreign-born population - Liberia (%)
Place of birth for the foreign-born population - Nigeria (%)
Place of birth for the foreign-born population - Senegal (%)
Place of birth for the foreign-born population - Sierra Leone (%)
Place of birth for the foreign-born population - Other Western Africa (%)
Place of birth for the foreign-born population - Australia (%)
Place of birth for the foreign-born population - New Zealand (%)
Place of birth for the foreign-born population - Fiji (%)
Place of birth for the foreign-born population - Micronesia (%)
Place of birth for the foreign-born population - Bahamas (%)
Place of birth for the foreign-born population - Barbados (%)
Place of birth for the foreign-born population - Cuba (%)
Place of birth for the foreign-born population - Dominica (%)
Place of birth for the foreign-born population - Dominican Republic (%)
Place of birth for the foreign-born population - Grenada (%)
Place of birth for the foreign-born population - Haiti (%)
Place of birth for the foreign-born population - Jamaica (%)
Place of birth for the foreign-born population - St. Vincent and the Grenadines (%)
Place of birth for the foreign-born population - Trinidad and Tobago (%)
Place of birth for the foreign-born population - West Indies (%)
Place of birth for the foreign-born population - Other Caribbean (%)
Place of birth for the foreign-born population - Belize (%)
Place of birth for the foreign-born population - Costa Rica (%)
Place of birth for the foreign-born population - El Salvador (%)
Place of birth for the foreign-born population - Guatemala (%)
Place of birth for the foreign-born population - Honduras (%)
Place of birth for the foreign-born population - Mexico (%)
Place of birth for the foreign-born population - Nicaragua (%)
Place of birth for the foreign-born population - Panama (%)
Place of birth for the foreign-born population - Other Central America (%)
Place of birth for the foreign-born population - Argentina (%)
Place of birth for the foreign-born population - Bolivia (%)
Place of birth for the foreign-born population - Brazil (%)
Place of birth for the foreign-born population - Chile (%)
Place of birth for the foreign-born population - Colombia (%)
Place of birth for the foreign-born population - Ecuador (%)
Place of birth for the foreign-born population - Guyana (%)
Place of birth for the foreign-born population - Peru (%)
Place of birth for the foreign-born population - Uruguay (%)
Place of birth for the foreign-born population - Venezuela (%)
Place of birth for the foreign-born population - Other South America (%)
Place of birth for the foreign-born population - Canada (%)
Place of birth for the foreign-born population - Other Northern America (%)
Place of birth for the foreign-born population - Other (%)
Latest news about races in Kenner, LA collected exclusively by city-data.com from local newspapers, TV, and radio stations
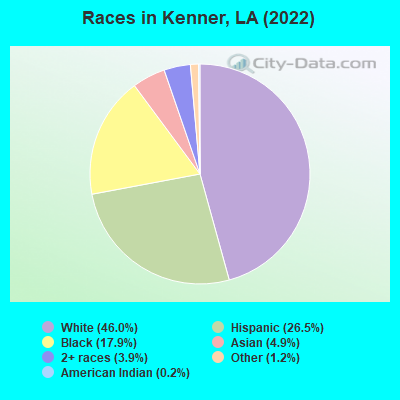
According to 2022 data, the most numerous races in Kenner, LA are White alone (29,540 residents), Black alone (11,502 residents), and Hispanic (17,000 residents). 75.9% of Kenner residents speak English at home. 20.4% of Kenner, LA residents are foreign-born (13.7% born in Latin America, 4.2% born in Asia), which is 80.4% greater than the foreign-born rate of 4.0% across the entire state of Louisiana.
Race distribution in Kenner
2000 2022
2,794,391 62.5% White alone 1,443,390 32.3% Black alone 107,738 2.4% Hispanic 54,256 1.2% Asian alone 39,260 0.9% Two or more races 24,129 0.5% American Indian alone 4,736 0.1% Other race alone 1,076 0.02% Native Hawaiian and Other
2,603,221 56.7% White alone 1,420,055 30.9% Black alone 262,213 5.7% Hispanic 183,270 4.0% Two or more races 81,169 1.8% Asian alone 19,991 0.4% American Indian alone 18,043 0.4% Other race alone 2,279 0.05% Native Hawaiian and Other
Income and house value in Kenner Median household income in 2022 $68,444 White non-Hispanic householders$45,540 Black householders$72,404 American Indian and Alaska Native householders$75,466 Asian householders$48,392 Some other race householders$72,099 Two or more races householders$52,912 Hispanic or Latino race householdersMedian 2022 house value $288,180 White Non-Hispanic householders$188,498 Black or African American householders$177,159 American Indian or Alaska Native householders $382,429 Asian householders$278,495 Native Hawaiian and other Pacific Islander householders$214,717 Some other race householders$287,943 Two or more races householders$219,914 Hispanic or Latino householders
Median age by race in Kenner
52.4 Median age for White residents50.3 54.0 36.9 Median age for Black or African American residents37.0 36.9 45.1 Median age for American Indian / Alaska Native residents45.0 -666,666,666.0 32.5 Median age for Asian residents32.5 28.0 62.2 Median age for Native Hawaiian / Pacific Islander residents-666,666,666.0 -666,666,666.0 32.6 Median age for Other race residents34.7 32.3 28.0 Median age for Two or more races residents23.0 31.5 54.2 Median age for White alone residents52.3 54.4 32.3 Median age for Hispanic or Latino residents37.1 29.2
Owner/renter occupied households by race in Kenner
House owners and renters - White residents 10,978 76.7% Owner occupied3,338 23.3% Renter occupiedHouse owners and renters - Black or African American residents 2,279 39.8% Owner occupied3,454 60.2% Renter occupiedHouse owners and renters - American Indian / Alaska Native residents 32 11.7% Owner occupied240 88.3% Renter occupiedHouse owners and renters - Asian residents 843 59.3% Owner occupied578 40.7% Renter occupiedHouse owners and renters - Native Hawaiian / Pacific Islander residents 12 100.0% Renter occupiedHouse owners and renters - Other race residents 413 19.8% Owner occupied1,677 80.2% Renter occupiedHouse owners and renters - Two or more races residents 1,520 55.3% Owner occupied1,231 44.7% Renter occupiedHouse owners and renters - White alone residents 10,735 80.7% Owner occupied2,566 19.3% Renter occupiedHouse owners and renters - Hispanic or Latino residents 1,939 35.8% Owner occupied3,479 64.2% Renter occupied
Language usage in Kenner
English speakers - Total 75.9% of residents of Kenner speak English at home.
16.2% of residents speak Spanish at home 5,282 53.9% Speak English very well4,526 46.1% Speak English less than very well7.9% of residents speak other language at home 3,086 64.5% Speak English very well1,696 35.5% Speak English less than very well
English speakers - Born in the United States 87.7% of residents of Kenner speak English at home.
11.8% of residents speak Spanish at home 917 75.2% Speak English very well303 24.8% Speak English less than very well0.5% of residents speak other language at home 49 100.0% Speak English very well
English speakers - Native, born elsewhere 33.3% of residents of Kenner speak English at home.
12.6% of residents speak Spanish at home 174 84.9% Speak English very well31 15.1% Speak English less than very well54.2% of residents speak other language at home 848 95.9% Speak English very well36 4.1% Speak English less than very well
English speakers - Foreign-born 11.2% of residents of Kenner speak English at home.
61.6% of residents speak Spanish at home 2,375 36.8% Speak English very well4,077 63.2% Speak English less than very well27.2% of residents speak other language at home 1,192 41.8% Speak English very well1,660 58.2% Speak English less than very well
White (Caucasian) - Speak only English Native:
97.8% (29,110)Foreign-born:
25.8% (199)
White (Caucasian) - Speak another language Native:
2.2% (642)Foreign-born:
74.2% (573)
Black or African American - Speak only English Native:
97.2% (10,582)Foreign-born:
25.2% (31)
Black or African American - Speak another language Native:
2.5% (269)Foreign-born:
74.9% (93)
American Indian / Alaska Native - Speak only English Native:
77.7% (115)Foreign-born:
9.8% (40)
American Indian / Alaska Native - Speak another language Native:
23.1% (34)Foreign-born:
92.2% (374)
Asian - Speak only English Native:
20.5% (195)Foreign-born:
7.1% (152)
Asian - Speak another language Native:
90.8% (863)Foreign-born:
93.0% (1,988)
Other race - Speak only English Native:
64.5% (1,438)Foreign-born:
24.6% (563)
Other race - Speak another language Native:
35.5% (792)Foreign-born:
75.4% (1,727)
Two or more races - Speak only English Native:
61.8% (3,293)Foreign-born:
2.2% (78)
Two or more races - Speak another language Native:
38.2% (2,036)Foreign-born:
97.8% (3,402)
White alone - Speak only English Native:
96.8% (26,247)Foreign-born:
21.4% (203)
White alone - Speak another language Native:
3.2% (873)Foreign-born:
77.4% (735)
Hispanic or Latino - Speak only English Native:
60.2% (4,633)Foreign-born:
8.3% (563)
Hispanic or Latino - Speak another language Native:
39.8% (3,068)Foreign-born:
91.7% (6,189)
Foreign-born residents in Kenner 13,132 residents are foreign born (13.7% Latin America , 4.2% Asia ).
This city:
20.4%Louisiana:
4.2%
Marital status for residents in Kenner Marital status - White (Caucasian) population 15 years and over
Males 29.0% Never married55.9% Now married0.3% Separated3.3% Widowed11.6% DivorcedFemales 21.0% Never married45.9% Now married1.3% Separated11.7% Widowed20.1% DivorcedWomen who gave birth in the past 12 months Now married:
54.8% (312)Unmarried:
45.2% (257)
Women who did not give birth in the past 12 months Now married:
39.4% (1,954)Unmarried:
60.6% (3,010)
Marital status - Black or African American population 15 years and over
Males 37.9% Never married33.2% Now married1.1% Separated5.7% Widowed22.0% DivorcedFemales 38.3% Never married30.5% Now married6.0% Separated4.9% Widowed20.2% DivorcedWomen who gave birth in the past 12 months Now married:
46.7% (77)Unmarried:
53.3% (87)
Women who did not give birth in the past 12 months Now married:
20.9% (647)Unmarried:
79.1% (2,445)
Marital status - American Indian / Alaska Native population 15 years and over
Males 39.3% Never married53.0% Now married0.0% Separated0.0% Widowed7.7% DivorcedFemales 50.4% Never married10.2% Now married7.9% Separated31.5% Widowed0.0% DivorcedWomen who did not give birth in the past 12 months Now married:
15.9% (8)Unmarried:
84.1% (44)
Marital status - Asian population 15 years and over
Males 33.6% Never married58.1% Now married0.0% Separated1.3% Widowed7.1% DivorcedFemales 20.7% Never married55.7% Now married0.0% Separated22.2% Widowed1.4% DivorcedWomen who gave birth in the past 12 months Now married:
100.0% (10)Unmarried:
0.0% (0)
Women who did not give birth in the past 12 months Now married:
50.1% (359)Unmarried:
49.9% (357)
Marital status - Native Hawaiian / Pacific Islander population 15 years and over
Males 0.0% Never married0.0% Now married0.0% Separated0.0% Widowed100.0% DivorcedFemales 0.0% Never married0.0% Now married0.0% Separated100.0% Widowed0.0% DivorcedMarital status - Other race population 15 years and over
Males 58.1% Never married39.3% Now married0.0% Separated2.3% Widowed0.3% DivorcedFemales 45.2% Never married36.9% Now married2.5% Separated6.9% Widowed8.5% DivorcedWomen who gave birth in the past 12 months Now married:
100.0% (48)Unmarried:
0.0% (0)
Women who did not give birth in the past 12 months Now married:
32.8% (563)Unmarried:
67.2% (1,151)
Marital status - Two or more races population 15 years and over
Males 60.9% Never married29.5% Now married0.0% Separated0.0% Widowed9.6% DivorcedFemales 35.3% Never married43.0% Now married0.0% Separated8.3% Widowed13.4% DivorcedWomen who gave birth in the past 12 months Now married:
26.8% (52)Unmarried:
73.2% (142)
Women who did not give birth in the past 12 months Now married:
43.5% (916)Unmarried:
56.5% (1,191)
Marital status - White alone, not Hispanic / Latino population 15 years and over
Males 24.6% Never married58.7% Now married0.3% Separated3.6% Widowed12.8% DivorcedFemales 19.0% Never married46.9% Now married1.3% Separated12.1% Widowed20.7% DivorcedWomen who gave birth in the past 12 months Now married:
59.3% (312)Unmarried:
40.7% (214)
Women who did not give birth in the past 12 months Now married:
42.2% (1,954)Unmarried:
57.8% (2,680)
Marital status - Hispanic or Latino population 15 years and over
Males 62.2% Never married35.5% Now married0.0% Separated0.0% Widowed2.3% DivorcedFemales 51.6% Never married33.1% Now married0.0% Separated4.2% Widowed11.1% DivorcedWomen who gave birth in the past 12 months Now married:
22.8% (52)Unmarried:
77.2% (176)
Women who did not give birth in the past 12 months Now married:
26.1% (1,067)Unmarried:
73.9% (3,027)
Ancestries in Kenner
2,986 8.2% Italian2,289 6.3% American1,633 4.5% French1,516 4.2% German1,413 3.9% English805 2.2% Irish375 1.0% European217 0.6% Arab204 0.6% African176 0.5% Egyptian171 0.5% Iranian162 0.4% Nigerian151 0.4% French Canadian125 0.3% Ethiopian123 0.3% Lebanese115 0.3% Romanian104 0.3% Cajun75 0.2% Palestinian68 0.2% Somali63 0.2% Turkish56 0.2% Syrian56 0.2% Brazilian47 0.1% Slovene47 0.1% Jamaican45 0.1% British45 0.1% Russian45 0.1% Jordanian26 0.07% Norwegian26 0.07% Greek22 0.06% Polish22 0.06% Dutch19 0.05% Scottish19 0.05% Bulgarian19 0.05% Israeli18 0.05% Swiss14 0.04% Eastern European11 0.03% Canadian9 0.02% Alsatian8 0.02% Swedish7 0.02% Danish7 0.02% Yugoslavian4 0.01% Austrian4 0.01% Welsh
Geographical mobility in Kenner Same house 1 year ago 31,195 90.9% White (Caucasian)9,881 86.2% Black or African American410 94.6% American Indian / Alaska Native2,875 92.1% Asian32 100.0% Native Hawaiian / Pacific Islander4,059 84.4% Other race7,994 76.5% Two or more races26,683 90.9% White alone, not Hispanic / Latino13,834 82.4% Hispanic or LatinoMoved within same county 1,855 5.4% White / Caucasian453 4.0% Black or African American18 4.1% American Indian / Alaska Native51 1.6% Asian159 3.3% Other race1,439 13.8% Two or more races1,597 5.4% White alone, not Hispanic / Latino1,367 8.1% Hispanic or LatinoMoved within same state 886 2.6% White / Caucasian556 4.9% Black or African American243 5.0% Other race501 4.8% Two or more races812 2.8% White alone, not Hispanic / Latino586 3.5% Hispanic or LatinoMoved from different state 559 1.6% White / Caucasian252 2.2% Black or African American169 5.4% Asian233 4.9% Other race225 2.1% Two or more races360 1.2% White alone, not Hispanic / Latino347 2.1% Hispanic or LatinoMoved from abroad 58 0.2% White118 1.0% Black or African American17 0.5% Asian23 0.5% Other race147 1.4% Two or more races90 0.3% White alone, not Hispanic / Latino233 1.4% Hispanic or Latino
Children Nativity (place of birth) in Kenner
Children under 6 years - Living with two parents Both parents native 2,197 100.0% NativeBoth parents foreign-born 557 96.0% Native23 4.0% Foreign-bornOne native, one foreign-born parent 46 100.0% NativeChildren under 6 years - Living with one parent Native parent 1,752 100.0% NativeForeign-born parent 243 54.6% Native202 45.4% Foreign-bornChildren 6 to 17 years - Living with two parents Both parents native 3,499 99.8% Native9 0.2% Foreign-bornBoth parents foreign-born 962 70.8% Native398 29.2% Foreign-bornOne native, one foreign-born parent 416 100.0% NativeChildren 6 to 17 years - Living with one parent Native parent 2,455 100.0% NativeForeign-born parent 1,019 54.3% Native856 45.7% Foreign-born
Grandparents responsible for own grandchildren in Kenner
Grandparents (30 to 59 years) White / Caucasian 81 48.5% Responsible for grandchildren86 51.5% Not responsible for grandchildrenBlack or African American 34 92.0% Responsible for grandchildren3 8.0% Not responsible for grandchildrenOther race 11 7.2% Responsible for grandchildren144 92.8% Not responsible for grandchildrenTwo or more races 6 32.8% Responsible for grandchildren12 67.2% Not responsible for grandchildrenWhite alone, not Hispanic / Latino 103 62.9% Responsible for grandchildren61 37.1% Not responsible for grandchildrenHispanic or Latino 13 6.2% Responsible for grandchildren199 93.8% Not responsible for grandchildrenGrandparents (60 years and over) White / Caucasian 140 29.5% Responsible for grandchildren334 70.5% Not responsible for grandchildrenBlack or African American 37 16.1% Responsible for grandchildren191 83.9% Not responsible for grandchildrenOther race 79 58.9% Responsible for grandchildren55 41.1% Not responsible for grandchildrenTwo or more races 16 21.7% Responsible for grandchildren58 78.3% Not responsible for grandchildrenWhite alone, not Hispanic / Latino 148 35.9% Responsible for grandchildren265 64.1% Not responsible for grandchildrenHispanic or Latino 38 15.1% Responsible for grandchildren213 84.9% Not responsible for grandchildren