Races in Jefferson Valley-Yorktown, New York (NY) Detailed Stats
Data:
Races - White alone (%)
Races - White alone (% change since 2000)
Races - Black alone (%)
Races - Black alone (% change since 2000)
Races - American Indian alone (%)
Races - American Indian alone (% change since 2000)
Races - Asian alone (%)
Races - Asian alone (% change since 2000)
Races - Hispanic (%)
Races - Hispanic (% change since 2000)
Races - Native Hawaiian and Other Pacific Islander alone (%)
Races - Native Hawaiian and Other Pacific Islander alone (% change since 2000)
Races - Two or more races(%)
Races - Two or more races(% change since 2000)
Races - Other race alone (%)
Races - Other race alone (% change since 2000)
Racial diversity
Place of birth - Born in state of residence (%)
Place of birth - Born in state of residence (%) - White
Place of birth - Born in state of residence (%) - Black or African American
Place of birth - Born in state of residence (%) - Asian
Place of birth - Born in state of residence (%) - Hispanic or Latino
Place of birth - Born in state of residence (%) - American Indian and Alaska Native
Place of birth - Born in state of residence (%) - Multirace
Place of birth - Born in state of residence (%) - Other Race
Place of birth - Born in other state (%)
Place of birth - Born in other state (%) - White
Place of birth - Born in other state (%) - Black or African American
Place of birth - Born in other state (%) - Asian
Place of birth - Born in other state (%) - Hispanic or Latino
Place of birth - Born in other state (%) - American Indian and Alaska Native
Place of birth - Born in other state (%) - Multirace
Place of birth - Born in other state (%) - Other Race
Place of birth - Native, outside of US (%)
Place of birth - Native, outside of US (%) - White
Place of birth - Native, outside of US (%) - Black or African American
Place of birth - Native, outside of US (%) - Asian
Place of birth - Native, outside of US (%) - Hispanic or Latino
Place of birth - Native, outside of US (%) - American Indian and Alaska Native
Place of birth - Native, outside of US (%) - Multirace
Place of birth - Native, outside of US (%) - Other Race
Place of birth - Foreign born (%)
Place of birth - Foreign born (%) - White
Place of birth - Foreign born (%) - Black or African American
Place of birth - Foreign born (%) - Asian
Place of birth - Foreign born (%) - Hispanic or Latino
Place of birth - Foreign born (%) - American Indian and Alaska Native
Place of birth - Foreign born (%) - Multirace
Place of birth - Foreign born (%) - Other Race
Residents speaking English at home (%)
Residents speaking English at home - Born in the United States (%)
Residents speaking English at home - Native, born elsewhere (%)
Residents speaking English at home - Foreign born (%)
Residents speaking Spanish at home (%)
Residents speaking Spanish at home - Born in the United States (%)
Residents speaking Spanish at home - Native, born elsewhere (%)
Residents speaking Spanish at home - Foreign born (%)
Residents speaking other language at home (%)
Residents speaking other language at home - Born in the United States (%)
Residents speaking other language at home - Native, born elsewhere (%)
Residents speaking other language at home - Foreign born (%)
Marital status - Never married (%)
Marital status - Now married (%)
Marital status - Separated (%)
Marital status - Widowed (%)
Marital status - Divorced (%)
Ancestries Reported - Arab (%)
Ancestries Reported - Czech (%)
Ancestries Reported - Danish (%)
Ancestries Reported - Dutch (%)
Ancestries Reported - English (%)
Ancestries Reported - French (%)
Ancestries Reported - French Canadian (%)
Ancestries Reported - German (%)
Ancestries Reported - Greek (%)
Ancestries Reported - Hungarian (%)
Ancestries Reported - Irish (%)
Ancestries Reported - Italian (%)
Ancestries Reported - Lithuanian (%)
Ancestries Reported - Norwegian (%)
Ancestries Reported - Polish (%)
Ancestries Reported - Portuguese (%)
Ancestries Reported - Russian (%)
Ancestries Reported - Scotch-Irish (%)
Ancestries Reported - Scottish (%)
Ancestries Reported - Slovak (%)
Ancestries Reported - Subsaharan African (%)
Ancestries Reported - Swedish (%)
Ancestries Reported - Swiss (%)
Ancestries Reported - Ukrainian (%)
Ancestries Reported - United States (%)
Ancestries Reported - Welsh (%)
Ancestries Reported - West Indian (%)
Ancestries Reported - Other (%)
Geographical mobility - Same house 1 year ago (%)
Geographical mobility - Same house 1 year ago (%) - White
Geographical mobility - Same house 1 year ago (%) - Black or African American
Geographical mobility - Same house 1 year ago (%) - Asian
Geographical mobility - Same house 1 year ago (%) - Hispanic or Latino
Geographical mobility - Same house 1 year ago (%) - American Indian and Alaska Native
Geographical mobility - Same house 1 year ago (%) - Multirace
Geographical mobility - Same house 1 year ago (%) - Other Race
Geographical mobility - Moved within same county (%)
Geographical mobility - Moved within same county (%) - White
Geographical mobility - Moved within same county (%) - Black or African American
Geographical mobility - Moved within same county (%) - Asian
Geographical mobility - Moved within same county (%) - Hispanic or Latino
Geographical mobility - Moved within same county (%) - American Indian and Alaska Native
Geographical mobility - Moved within same county (%) - Multirace
Geographical mobility - Moved within same county (%) - Other Race
Geographical mobility - Moved from different county within same state (%)
Geographical mobility - Moved from different county within same state (%) - White
Geographical mobility - Moved from different county within same state (%) - Black or African American
Geographical mobility - Moved from different county within same state (%) - Asian
Geographical mobility - Moved from different county within same state (%) - Hispanic or Latino
Geographical mobility - Moved from different county within same state (%) - American Indian and Alaska Native
Geographical mobility - Moved from different county within same state (%) - Multirace
Geographical mobility - Moved from different county within same state (%) - Other Race
Geographical mobility - Moved from different state (%)
Geographical mobility - Moved from different state (%) - White
Geographical mobility - Moved from different state (%) - Black or African American
Geographical mobility - Moved from different state (%) - Asian
Geographical mobility - Moved from different state (%) - Hispanic or Latino
Geographical mobility - Moved from different state (%) - American Indian and Alaska Native
Geographical mobility - Moved from different state (%) - Multirace
Geographical mobility - Moved from different state (%) - Other Race
Geographical mobility - Moved from abroad (%)
Geographical mobility - Moved from abroad (%) - White
Geographical mobility - Moved from abroad (%) - Black or African American
Geographical mobility - Moved from abroad (%) - Asian
Geographical mobility - Moved from abroad (%) - Hispanic or Latino
Geographical mobility - Moved from abroad (%) - American Indian and Alaska Native
Geographical mobility - Moved from abroad (%) - Multirace
Geographical mobility - Moved from abroad (%) - Other Race
Place of birth for the foreign-born population - Ireland (%)
Place of birth for the foreign-born population - Denmark (%)
Place of birth for the foreign-born population - Norway (%)
Place of birth for the foreign-born population - Sweden (%)
Place of birth for the foreign-born population - United Kingdom (%)
Place of birth for the foreign-born population - England (%)
Place of birth for the foreign-born population - Scotland (%)
Place of birth for the foreign-born population - Other Northern Europe (%)
Place of birth for the foreign-born population - Austria (%)
Place of birth for the foreign-born population - Belgium (%)
Place of birth for the foreign-born population - France (%)
Place of birth for the foreign-born population - Germany (%)
Place of birth for the foreign-born population - Netherlands (%)
Place of birth for the foreign-born population - Switzerland (%)
Place of birth for the foreign-born population - Other Western Europe (%)
Place of birth for the foreign-born population - Greece (%)
Place of birth for the foreign-born population - Italy (%)
Place of birth for the foreign-born population - Portugal (%)
Place of birth for the foreign-born population - Spain (%)
Place of birth for the foreign-born population - Other Southern Europe (%)
Place of birth for the foreign-born population - Albania (%)
Place of birth for the foreign-born population - Belarus (%)
Place of birth for the foreign-born population - Bosnia and Herzegovina (%)
Place of birth for the foreign-born population - Bulgaria (%)
Place of birth for the foreign-born population - Croatia (%)
Place of birth for the foreign-born population - Czechoslovakia (%)
Place of birth for the foreign-born population - Hungary (%)
Place of birth for the foreign-born population - Latvia (%)
Place of birth for the foreign-born population - Lithuania (%)
Place of birth for the foreign-born population - North Macedonia (Macedonia) (%)
Place of birth for the foreign-born population - Moldova (%)
Place of birth for the foreign-born population - Poland (%)
Place of birth for the foreign-born population - Romania (%)
Place of birth for the foreign-born population - Russia (%)
Place of birth for the foreign-born population - Serbia (%)
Place of birth for the foreign-born population - Ukraine (%)
Place of birth for the foreign-born population - Other Eastern Europe (%)
Place of birth for the foreign-born population - China (%)
Place of birth for the foreign-born population - Hong Kong (%)
Place of birth for the foreign-born population - Taiwan (%)
Place of birth for the foreign-born population - Japan (%)
Place of birth for the foreign-born population - Korea (%)
Place of birth for the foreign-born population - Other Eastern Asia (%)
Place of birth for the foreign-born population - Afghanistan (%)
Place of birth for the foreign-born population - Bangladesh (%)
Place of birth for the foreign-born population - India (%)
Place of birth for the foreign-born population - Iran (%)
Place of birth for the foreign-born population - Kazakhstan (%)
Place of birth for the foreign-born population - Nepal (%)
Place of birth for the foreign-born population - Pakistan (%)
Place of birth for the foreign-born population - Sri Lanka (%)
Place of birth for the foreign-born population - Uzbekistan (%)
Place of birth for the foreign-born population - Other South Central Asia (%)
Place of birth for the foreign-born population - Burma (%)
Place of birth for the foreign-born population - Cambodia (%)
Place of birth for the foreign-born population - Indonesia (%)
Place of birth for the foreign-born population - Laos (%)
Place of birth for the foreign-born population - Malaysia (%)
Place of birth for the foreign-born population - Philippines (%)
Place of birth for the foreign-born population - Singapore (%)
Place of birth for the foreign-born population - Thailand (%)
Place of birth for the foreign-born population - Vietnam (%)
Place of birth for the foreign-born population - Other South Eastern Asia (%)
Place of birth for the foreign-born population - Armenia (%)
Place of birth for the foreign-born population - Iraq (%)
Place of birth for the foreign-born population - Israel (%)
Place of birth for the foreign-born population - Jordan (%)
Place of birth for the foreign-born population - Kuwait (%)
Place of birth for the foreign-born population - Lebanon (%)
Place of birth for the foreign-born population - Saudi Arabia (%)
Place of birth for the foreign-born population - Syria (%)
Place of birth for the foreign-born population - Turkey (%)
Place of birth for the foreign-born population - Yemen (%)
Place of birth for the foreign-born population - Other Western Asia (%)
Place of birth for the foreign-born population - Eritrea (%)
Place of birth for the foreign-born population - Ethiopia (%)
Place of birth for the foreign-born population - Kenya (%)
Place of birth for the foreign-born population - Somalia (%)
Place of birth for the foreign-born population - Uganda (%)
Place of birth for the foreign-born population - Zimbabwe (%)
Place of birth for the foreign-born population - Other Eastern Africa (%)
Place of birth for the foreign-born population - Cameroon (%)
Place of birth for the foreign-born population - Congo (%)
Place of birth for the foreign-born population - Democratic Republic of Congo (Zaire) (%)
Place of birth for the foreign-born population - Other Middle Africa (%)
Place of birth for the foreign-born population - Egypt (%)
Place of birth for the foreign-born population - Morocco (%)
Place of birth for the foreign-born population - Sudan (%)
Place of birth for the foreign-born population - Other Northern Africa (%)
Place of birth for the foreign-born population - South Africa (%)
Place of birth for the foreign-born population - Other Southern Africa (%)
Place of birth for the foreign-born population - Cabo Verde (%)
Place of birth for the foreign-born population - Ghana (%)
Place of birth for the foreign-born population - Liberia (%)
Place of birth for the foreign-born population - Nigeria (%)
Place of birth for the foreign-born population - Senegal (%)
Place of birth for the foreign-born population - Sierra Leone (%)
Place of birth for the foreign-born population - Other Western Africa (%)
Place of birth for the foreign-born population - Australia (%)
Place of birth for the foreign-born population - New Zealand (%)
Place of birth for the foreign-born population - Fiji (%)
Place of birth for the foreign-born population - Micronesia (%)
Place of birth for the foreign-born population - Bahamas (%)
Place of birth for the foreign-born population - Barbados (%)
Place of birth for the foreign-born population - Cuba (%)
Place of birth for the foreign-born population - Dominica (%)
Place of birth for the foreign-born population - Dominican Republic (%)
Place of birth for the foreign-born population - Grenada (%)
Place of birth for the foreign-born population - Haiti (%)
Place of birth for the foreign-born population - Jamaica (%)
Place of birth for the foreign-born population - St. Vincent and the Grenadines (%)
Place of birth for the foreign-born population - Trinidad and Tobago (%)
Place of birth for the foreign-born population - West Indies (%)
Place of birth for the foreign-born population - Other Caribbean (%)
Place of birth for the foreign-born population - Belize (%)
Place of birth for the foreign-born population - Costa Rica (%)
Place of birth for the foreign-born population - El Salvador (%)
Place of birth for the foreign-born population - Guatemala (%)
Place of birth for the foreign-born population - Honduras (%)
Place of birth for the foreign-born population - Mexico (%)
Place of birth for the foreign-born population - Nicaragua (%)
Place of birth for the foreign-born population - Panama (%)
Place of birth for the foreign-born population - Other Central America (%)
Place of birth for the foreign-born population - Argentina (%)
Place of birth for the foreign-born population - Bolivia (%)
Place of birth for the foreign-born population - Brazil (%)
Place of birth for the foreign-born population - Chile (%)
Place of birth for the foreign-born population - Colombia (%)
Place of birth for the foreign-born population - Ecuador (%)
Place of birth for the foreign-born population - Guyana (%)
Place of birth for the foreign-born population - Peru (%)
Place of birth for the foreign-born population - Uruguay (%)
Place of birth for the foreign-born population - Venezuela (%)
Place of birth for the foreign-born population - Other South America (%)
Place of birth for the foreign-born population - Canada (%)
Place of birth for the foreign-born population - Other Northern America (%)
Place of birth for the foreign-born population - Other (%)
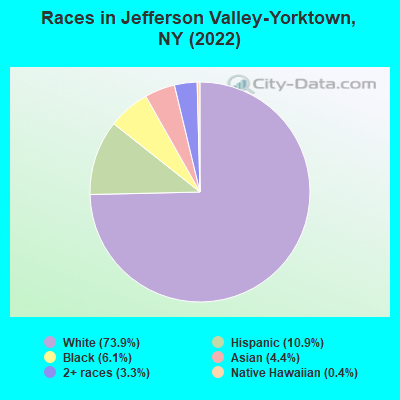
According to 2022 data, the most numerous races in Jefferson Valley-Yorktown, NY are White alone (10,323 residents), Hispanic (1,520 residents), and Black alone (853 residents). 82.9% of Jefferson Valley-Yorktown residents speak English at home. 14.7% of Jefferson Valley-Yorktown, NY residents are foreign-born (5.7% born in Europe, 4.4% born in Latin America, 3.2% born in Asia), which is 49.2% less than the foreign-born rate of 22.0% across the entire state of New York.
Race distribution in Jefferson Valley-Yorktown
2000 2022
11,760,981 62.0% White alone 2,867,583 15.1% Hispanic 2,812,623 14.8% Black alone 1,035,926 5.5% Asian alone 366,116 1.9% Two or more races 75,499 0.4% Other race alone 52,499 0.3% American Indian alone 5,230 0.03% Native Hawaiian and Other
10,408,933 52.9% White alone 3,867,299 19.7% Hispanic 2,633,840 13.4% Black alone 1,776,286 9.0% Asian alone 732,670 3.7% Two or more races 216,110 1.1% Other race alone 35,082 0.2% American Indian alone 6,931 0.04% Native Hawaiian and Other
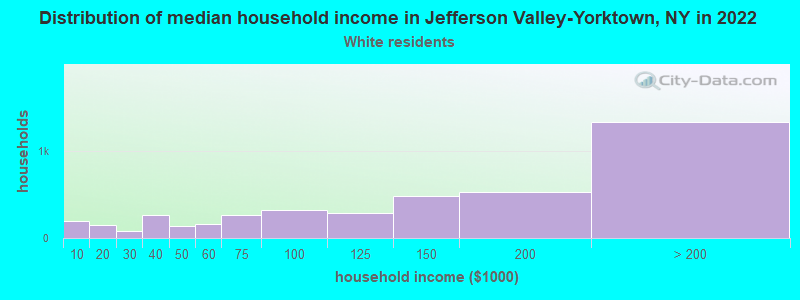
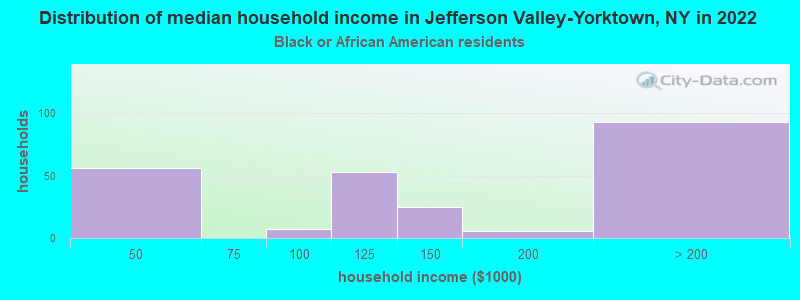
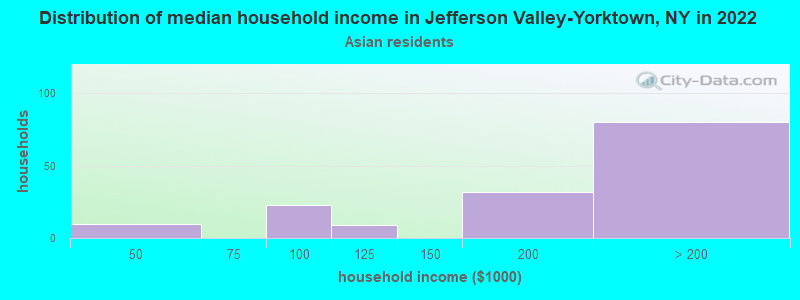
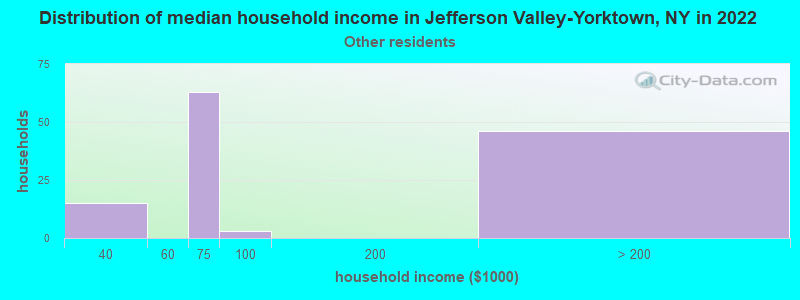
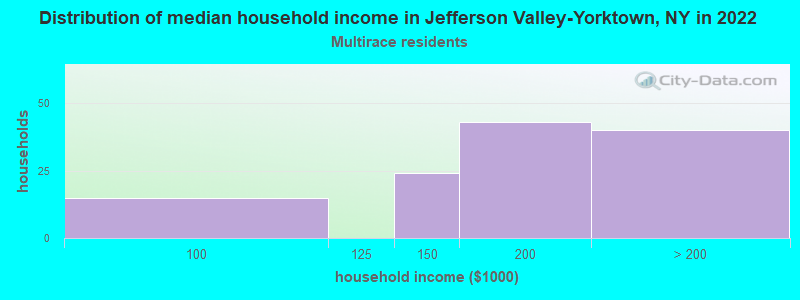
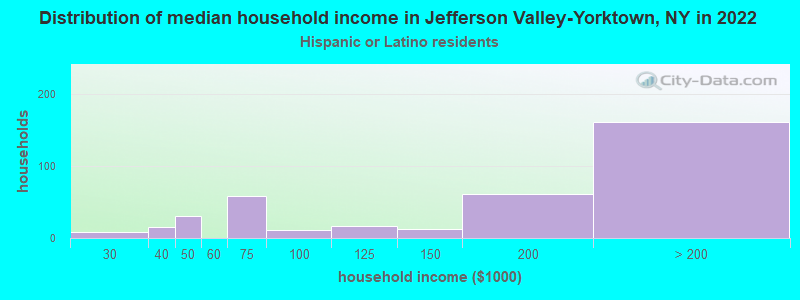
Income and house value in Jefferson Valley-Yorktown Median household income in 2022 $130,900 White non-Hispanic householders$199,181 Asian householders$154,858 Two or more races householders$159,718 Hispanic or Latino race householdersMedian 2022 house value $565,031 White Non-Hispanic householders$610,131 Black or African American householders$525,773 American Indian or Alaska Native householders $772,537 Asian householders$673,457 Some other race householders$944,523 Two or more races householders$635,835 Hispanic or Latino householders
Median age by race in Jefferson Valley-Yorktown
50.1 Median age for White residents49.2 51.7 32.3 Median age for Black or African American residents42.2 28.9 -641,441,440.8 Median age for American Indian / Alaska Native residents-664,804,468.6 -554,999,999.4 38.5 Median age for Asian residents27.9 47.8 -487,992,314.6 Median age for Native Hawaiian / Pacific Islander residents-477,502,295.2 -666,666,666.0 48.4 Median age for Other race residents52.3 47.5 31.7 Median age for Two or more races residents12.9 32.1 50.6 Median age for White alone residents48.8 52.8 39.0 Median age for Hispanic or Latino residents43.8 32.6
Owner/renter occupied households by race in Jefferson Valley-Yorktown
House owners and renters - White residents 4,153 95.8% Owner occupied180 4.2% Renter occupiedHouse owners and renters - Black or African American residents 207 85.5% Owner occupied35 14.5% Renter occupiedHouse owners and renters - American Indian / Alaska Native residents 9 100.0% Owner occupiedHouse owners and renters - Asian residents 171 100.0% Owner occupiedHouse owners and renters - Native Hawaiian / Pacific Islander residents 45 100.0% Renter occupiedHouse owners and renters - Other race residents 59 49.3% Owner occupied61 50.7% Renter occupiedHouse owners and renters - Two or more races residents 88 68.4% Owner occupied41 31.6% Renter occupiedHouse owners and renters - White alone residents 4,109 95.6% Owner occupied190 4.4% Renter occupiedHouse owners and renters - Hispanic or Latino residents 308 78.3% Owner occupied85 21.7% Renter occupied
Language usage in Jefferson Valley-Yorktown
English speakers - Total 82.9% of residents of Jefferson Valley-Yorktown speak English at home.
8.0% of residents speak Spanish at home 663 62.6% Speak English very well396 37.4% Speak English less than very well9.2% of residents speak other language at home 852 69.7% Speak English very well371 30.3% Speak English less than very well
All residents speak only English at home
English speakers - Native, born elsewhere 28.4% of residents of Jefferson Valley-Yorktown speak English at home.
58.8% of residents speak Spanish at home 88 73.3% Speak English very well32 26.7% Speak English less than very well16.2% of residents speak other language at home 33 100.0% Speak English very well
English speakers - Foreign-born 39.0% of residents of Jefferson Valley-Yorktown speak English at home.
19.0% of residents speak Spanish at home 178 45.1% Speak English very well217 54.9% Speak English less than very well43.3% of residents speak other language at home 602 66.7% Speak English very well301 33.3% Speak English less than very well
White (Caucasian) - Speak only English Native:
96.9% (8,994)Foreign-born:
61.3% (500)
White (Caucasian) - Speak another language Native:
4.5% (418)Foreign-born:
47.1% (384)
Black or African American - Speak only English Native:
99.4% (512)Foreign-born:
52.2% (184)
Black or African American - Speak another language Native:
2.2% (11)Foreign-born:
46.3% (164)
Asian - Speak only English Native:
80.0% (157)Foreign-born:
5.7% (22)
Asian - Speak another language Native:
19.6% (38)Foreign-born:
93.5% (365)
Other race - Speak only English Native:
20.4% (50)Foreign-born:
21.5% (20)
Other race - Speak another language Native:
80.7% (197)Foreign-born:
82.5% (77)
Two or more races - Speak only English Native:
53.3% (329)Foreign-born:
20.1% (39)
Two or more races - Speak another language Native:
46.4% (287)Foreign-born:
79.1% (155)
White alone - Speak only English Native:
96.2% (8,823)Foreign-born:
64.4% (492)
White alone - Speak another language Native:
4.1% (378)Foreign-born:
40.0% (305)
Hispanic or Latino - Speak only English Native:
40.7% (413)Foreign-born:
9.1% (36)
Hispanic or Latino - Speak another language Native:
58.4% (591)Foreign-born:
91.3% (356)
Foreign-born residents in Jefferson Valley-Yorktown 2,059 residents are foreign born (5.7% Europe , 4.4% Latin America , 3.2% Asia ).
This city:
14.7%New York:
22.6%
Marital status for residents in Jefferson Valley-Yorktown Marital status - White (Caucasian) population 15 years and over
Males 22.0% Never married65.8% Now married0.0% Separated6.6% Widowed5.7% DivorcedFemales 23.7% Never married57.0% Now married0.9% Separated12.4% Widowed6.0% DivorcedWomen who gave birth in the past 12 months Now married:
100.0% (77)Unmarried:
0.0% (0)
Women who did not give birth in the past 12 months Now married:
48.5% (874)Unmarried:
51.5% (930)
Marital status - Black or African American population 15 years and over
Males 15.7% Never married70.9% Now married0.0% Separated0.0% Widowed13.4% DivorcedFemales 48.3% Never married43.1% Now married6.3% Separated2.3% Widowed0.0% DivorcedWomen who did not give birth in the past 12 months Now married:
47.1% (132)Unmarried:
52.9% (148)
Marital status - Asian population 15 years and over
Males 47.6% Never married46.9% Now married0.0% Separated5.5% Widowed0.0% DivorcedFemales 17.5% Never married71.3% Now married4.9% Separated6.3% Widowed0.0% DivorcedWomen who did not give birth in the past 12 months Now married:
66.7% (76)Unmarried:
33.3% (38)
Marital status - Other race population 15 years and over
Males 14.0% Never married53.7% Now married0.0% Separated0.0% Widowed32.4% DivorcedFemales 26.1% Never married27.6% Now married0.0% Separated0.0% Widowed46.3% DivorcedWomen who did not give birth in the past 12 months Now married:
15.8% (18)Unmarried:
84.2% (96)
Marital status - Two or more races population 15 years and over
Males 0.0% Never married85.2% Now married0.0% Separated0.0% Widowed14.8% DivorcedFemales 62.7% Never married37.3% Now married0.0% Separated0.0% Widowed0.0% DivorcedWomen who did not give birth in the past 12 months Now married:
25.8% (122)Unmarried:
74.2% (349)
Marital status - White alone, not Hispanic / Latino population 15 years and over
Males 22.1% Never married65.0% Now married0.0% Separated7.1% Widowed5.7% DivorcedFemales 23.2% Never married56.7% Now married1.0% Separated13.0% Widowed6.1% DivorcedWomen who gave birth in the past 12 months Now married:
100.0% (44)Unmarried:
0.0% (0)
Women who did not give birth in the past 12 months Now married:
48.4% (843)Unmarried:
51.6% (898)
Marital status - Hispanic or Latino population 15 years and over
Males 18.7% Never married70.4% Now married0.0% Separated0.0% Widowed10.9% DivorcedFemales 44.7% Never married42.5% Now married0.0% Separated1.2% Widowed11.6% DivorcedWomen who gave birth in the past 12 months Now married:
100.0% (40)Unmarried:
0.0% (0)
Women who did not give birth in the past 12 months Now married:
30.6% (157)Unmarried:
69.4% (355)
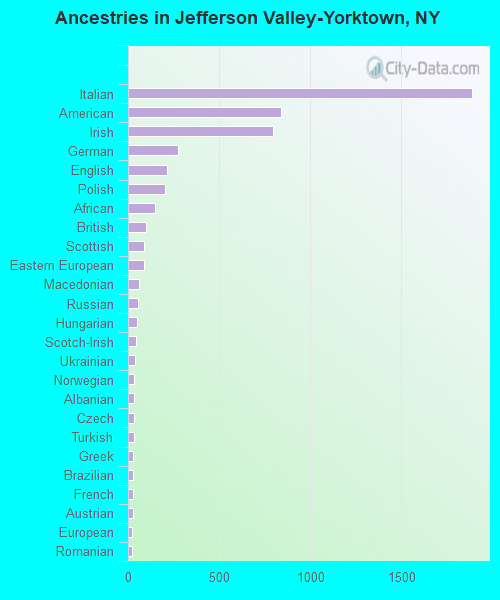
Ancestries in Jefferson Valley-Yorktown
1,887 26.1% Italian840 11.6% American798 11.1% Irish272 3.8% German212 2.9% English201 2.8% Polish146 2.0% African97 1.3% British86 1.2% Scottish86 1.2% Eastern European58 0.8% Macedonian55 0.8% Russian49 0.7% Hungarian46 0.6% Scotch-Irish39 0.5% Ukrainian35 0.5% Norwegian34 0.5% Albanian34 0.5% Czech33 0.5% Turkish29 0.4% Greek28 0.4% Brazilian27 0.4% French25 0.3% Austrian24 0.3% European23 0.3% Romanian21 0.3% Ghanaian16 0.2% Iranian16 0.2% Swiss14 0.2% West Indian13 0.2% Lithuanian11 0.2% French Canadian11 0.2% Czechoslovakian9 0.1% Slovak7 0.10% Lebanese6 0.08% Armenian2 0.03% Haitian
Children Nativity (place of birth) in Jefferson Valley-Yorktown
Children under 6 years - Living with two parents Both parents native 518 100.0% NativeBoth parents foreign-born 94 100.0% NativeOne native, one foreign-born parent 261 100.0% NativeChildren under 6 years - Living with one parent Native parent 1 100.0% NativeForeign-born parent 43 100.0% NativeChildren 6 to 17 years - Living with two parents Both parents native 1,051 99.9% Native1 0.1% Foreign-bornBoth parents foreign-born 104 84.5% Native19 15.5% Foreign-bornOne native, one foreign-born parent 423 98.3% Native7 1.7% Foreign-bornChildren 6 to 17 years - Living with one parent Native parent 214 100.0% NativeForeign-born parent 160 57.0% Native121 43.0% Foreign-born
Grandparents responsible for own grandchildren in Jefferson Valley-Yorktown
Grandparents (30 to 59 years) Black or African American 31 100.0% Not responsible for grandchildren
Grandparents (60 years and over)