Races in Janesville, Wisconsin (WI) Detailed Stats
Data:
Races - White alone (%)
Races - White alone (% change since 2000)
Races - Black alone (%)
Races - Black alone (% change since 2000)
Races - American Indian alone (%)
Races - American Indian alone (% change since 2000)
Races - Asian alone (%)
Races - Asian alone (% change since 2000)
Races - Hispanic (%)
Races - Hispanic (% change since 2000)
Races - Native Hawaiian and Other Pacific Islander alone (%)
Races - Native Hawaiian and Other Pacific Islander alone (% change since 2000)
Races - Two or more races(%)
Races - Two or more races(% change since 2000)
Races - Other race alone (%)
Races - Other race alone (% change since 2000)
Racial diversity
Place of birth - Born in state of residence (%)
Place of birth - Born in state of residence (%) - White
Place of birth - Born in state of residence (%) - Black or African American
Place of birth - Born in state of residence (%) - Asian
Place of birth - Born in state of residence (%) - Hispanic or Latino
Place of birth - Born in state of residence (%) - American Indian and Alaska Native
Place of birth - Born in state of residence (%) - Multirace
Place of birth - Born in state of residence (%) - Other Race
Place of birth - Born in other state (%)
Place of birth - Born in other state (%) - White
Place of birth - Born in other state (%) - Black or African American
Place of birth - Born in other state (%) - Asian
Place of birth - Born in other state (%) - Hispanic or Latino
Place of birth - Born in other state (%) - American Indian and Alaska Native
Place of birth - Born in other state (%) - Multirace
Place of birth - Born in other state (%) - Other Race
Place of birth - Native, outside of US (%)
Place of birth - Native, outside of US (%) - White
Place of birth - Native, outside of US (%) - Black or African American
Place of birth - Native, outside of US (%) - Asian
Place of birth - Native, outside of US (%) - Hispanic or Latino
Place of birth - Native, outside of US (%) - American Indian and Alaska Native
Place of birth - Native, outside of US (%) - Multirace
Place of birth - Native, outside of US (%) - Other Race
Place of birth - Foreign born (%)
Place of birth - Foreign born (%) - White
Place of birth - Foreign born (%) - Black or African American
Place of birth - Foreign born (%) - Asian
Place of birth - Foreign born (%) - Hispanic or Latino
Place of birth - Foreign born (%) - American Indian and Alaska Native
Place of birth - Foreign born (%) - Multirace
Place of birth - Foreign born (%) - Other Race
Residents speaking English at home (%)
Residents speaking English at home - Born in the United States (%)
Residents speaking English at home - Native, born elsewhere (%)
Residents speaking English at home - Foreign born (%)
Residents speaking Spanish at home (%)
Residents speaking Spanish at home - Born in the United States (%)
Residents speaking Spanish at home - Native, born elsewhere (%)
Residents speaking Spanish at home - Foreign born (%)
Residents speaking other language at home (%)
Residents speaking other language at home - Born in the United States (%)
Residents speaking other language at home - Native, born elsewhere (%)
Residents speaking other language at home - Foreign born (%)
Marital status - Never married (%)
Marital status - Now married (%)
Marital status - Separated (%)
Marital status - Widowed (%)
Marital status - Divorced (%)
Ancestries Reported - Arab (%)
Ancestries Reported - Czech (%)
Ancestries Reported - Danish (%)
Ancestries Reported - Dutch (%)
Ancestries Reported - English (%)
Ancestries Reported - French (%)
Ancestries Reported - French Canadian (%)
Ancestries Reported - German (%)
Ancestries Reported - Greek (%)
Ancestries Reported - Hungarian (%)
Ancestries Reported - Irish (%)
Ancestries Reported - Italian (%)
Ancestries Reported - Lithuanian (%)
Ancestries Reported - Norwegian (%)
Ancestries Reported - Polish (%)
Ancestries Reported - Portuguese (%)
Ancestries Reported - Russian (%)
Ancestries Reported - Scotch-Irish (%)
Ancestries Reported - Scottish (%)
Ancestries Reported - Slovak (%)
Ancestries Reported - Subsaharan African (%)
Ancestries Reported - Swedish (%)
Ancestries Reported - Swiss (%)
Ancestries Reported - Ukrainian (%)
Ancestries Reported - United States (%)
Ancestries Reported - Welsh (%)
Ancestries Reported - West Indian (%)
Ancestries Reported - Other (%)
Geographical mobility - Same house 1 year ago (%)
Geographical mobility - Same house 1 year ago (%) - White
Geographical mobility - Same house 1 year ago (%) - Black or African American
Geographical mobility - Same house 1 year ago (%) - Asian
Geographical mobility - Same house 1 year ago (%) - Hispanic or Latino
Geographical mobility - Same house 1 year ago (%) - American Indian and Alaska Native
Geographical mobility - Same house 1 year ago (%) - Multirace
Geographical mobility - Same house 1 year ago (%) - Other Race
Geographical mobility - Moved within same county (%)
Geographical mobility - Moved within same county (%) - White
Geographical mobility - Moved within same county (%) - Black or African American
Geographical mobility - Moved within same county (%) - Asian
Geographical mobility - Moved within same county (%) - Hispanic or Latino
Geographical mobility - Moved within same county (%) - American Indian and Alaska Native
Geographical mobility - Moved within same county (%) - Multirace
Geographical mobility - Moved within same county (%) - Other Race
Geographical mobility - Moved from different county within same state (%)
Geographical mobility - Moved from different county within same state (%) - White
Geographical mobility - Moved from different county within same state (%) - Black or African American
Geographical mobility - Moved from different county within same state (%) - Asian
Geographical mobility - Moved from different county within same state (%) - Hispanic or Latino
Geographical mobility - Moved from different county within same state (%) - American Indian and Alaska Native
Geographical mobility - Moved from different county within same state (%) - Multirace
Geographical mobility - Moved from different county within same state (%) - Other Race
Geographical mobility - Moved from different state (%)
Geographical mobility - Moved from different state (%) - White
Geographical mobility - Moved from different state (%) - Black or African American
Geographical mobility - Moved from different state (%) - Asian
Geographical mobility - Moved from different state (%) - Hispanic or Latino
Geographical mobility - Moved from different state (%) - American Indian and Alaska Native
Geographical mobility - Moved from different state (%) - Multirace
Geographical mobility - Moved from different state (%) - Other Race
Geographical mobility - Moved from abroad (%)
Geographical mobility - Moved from abroad (%) - White
Geographical mobility - Moved from abroad (%) - Black or African American
Geographical mobility - Moved from abroad (%) - Asian
Geographical mobility - Moved from abroad (%) - Hispanic or Latino
Geographical mobility - Moved from abroad (%) - American Indian and Alaska Native
Geographical mobility - Moved from abroad (%) - Multirace
Geographical mobility - Moved from abroad (%) - Other Race
Place of birth for the foreign-born population - Ireland (%)
Place of birth for the foreign-born population - Denmark (%)
Place of birth for the foreign-born population - Norway (%)
Place of birth for the foreign-born population - Sweden (%)
Place of birth for the foreign-born population - United Kingdom (%)
Place of birth for the foreign-born population - England (%)
Place of birth for the foreign-born population - Scotland (%)
Place of birth for the foreign-born population - Other Northern Europe (%)
Place of birth for the foreign-born population - Austria (%)
Place of birth for the foreign-born population - Belgium (%)
Place of birth for the foreign-born population - France (%)
Place of birth for the foreign-born population - Germany (%)
Place of birth for the foreign-born population - Netherlands (%)
Place of birth for the foreign-born population - Switzerland (%)
Place of birth for the foreign-born population - Other Western Europe (%)
Place of birth for the foreign-born population - Greece (%)
Place of birth for the foreign-born population - Italy (%)
Place of birth for the foreign-born population - Portugal (%)
Place of birth for the foreign-born population - Spain (%)
Place of birth for the foreign-born population - Other Southern Europe (%)
Place of birth for the foreign-born population - Albania (%)
Place of birth for the foreign-born population - Belarus (%)
Place of birth for the foreign-born population - Bosnia and Herzegovina (%)
Place of birth for the foreign-born population - Bulgaria (%)
Place of birth for the foreign-born population - Croatia (%)
Place of birth for the foreign-born population - Czechoslovakia (%)
Place of birth for the foreign-born population - Hungary (%)
Place of birth for the foreign-born population - Latvia (%)
Place of birth for the foreign-born population - Lithuania (%)
Place of birth for the foreign-born population - North Macedonia (Macedonia) (%)
Place of birth for the foreign-born population - Moldova (%)
Place of birth for the foreign-born population - Poland (%)
Place of birth for the foreign-born population - Romania (%)
Place of birth for the foreign-born population - Russia (%)
Place of birth for the foreign-born population - Serbia (%)
Place of birth for the foreign-born population - Ukraine (%)
Place of birth for the foreign-born population - Other Eastern Europe (%)
Place of birth for the foreign-born population - China (%)
Place of birth for the foreign-born population - Hong Kong (%)
Place of birth for the foreign-born population - Taiwan (%)
Place of birth for the foreign-born population - Japan (%)
Place of birth for the foreign-born population - Korea (%)
Place of birth for the foreign-born population - Other Eastern Asia (%)
Place of birth for the foreign-born population - Afghanistan (%)
Place of birth for the foreign-born population - Bangladesh (%)
Place of birth for the foreign-born population - India (%)
Place of birth for the foreign-born population - Iran (%)
Place of birth for the foreign-born population - Kazakhstan (%)
Place of birth for the foreign-born population - Nepal (%)
Place of birth for the foreign-born population - Pakistan (%)
Place of birth for the foreign-born population - Sri Lanka (%)
Place of birth for the foreign-born population - Uzbekistan (%)
Place of birth for the foreign-born population - Other South Central Asia (%)
Place of birth for the foreign-born population - Burma (%)
Place of birth for the foreign-born population - Cambodia (%)
Place of birth for the foreign-born population - Indonesia (%)
Place of birth for the foreign-born population - Laos (%)
Place of birth for the foreign-born population - Malaysia (%)
Place of birth for the foreign-born population - Philippines (%)
Place of birth for the foreign-born population - Singapore (%)
Place of birth for the foreign-born population - Thailand (%)
Place of birth for the foreign-born population - Vietnam (%)
Place of birth for the foreign-born population - Other South Eastern Asia (%)
Place of birth for the foreign-born population - Armenia (%)
Place of birth for the foreign-born population - Iraq (%)
Place of birth for the foreign-born population - Israel (%)
Place of birth for the foreign-born population - Jordan (%)
Place of birth for the foreign-born population - Kuwait (%)
Place of birth for the foreign-born population - Lebanon (%)
Place of birth for the foreign-born population - Saudi Arabia (%)
Place of birth for the foreign-born population - Syria (%)
Place of birth for the foreign-born population - Turkey (%)
Place of birth for the foreign-born population - Yemen (%)
Place of birth for the foreign-born population - Other Western Asia (%)
Place of birth for the foreign-born population - Eritrea (%)
Place of birth for the foreign-born population - Ethiopia (%)
Place of birth for the foreign-born population - Kenya (%)
Place of birth for the foreign-born population - Somalia (%)
Place of birth for the foreign-born population - Uganda (%)
Place of birth for the foreign-born population - Zimbabwe (%)
Place of birth for the foreign-born population - Other Eastern Africa (%)
Place of birth for the foreign-born population - Cameroon (%)
Place of birth for the foreign-born population - Congo (%)
Place of birth for the foreign-born population - Democratic Republic of Congo (Zaire) (%)
Place of birth for the foreign-born population - Other Middle Africa (%)
Place of birth for the foreign-born population - Egypt (%)
Place of birth for the foreign-born population - Morocco (%)
Place of birth for the foreign-born population - Sudan (%)
Place of birth for the foreign-born population - Other Northern Africa (%)
Place of birth for the foreign-born population - South Africa (%)
Place of birth for the foreign-born population - Other Southern Africa (%)
Place of birth for the foreign-born population - Cabo Verde (%)
Place of birth for the foreign-born population - Ghana (%)
Place of birth for the foreign-born population - Liberia (%)
Place of birth for the foreign-born population - Nigeria (%)
Place of birth for the foreign-born population - Senegal (%)
Place of birth for the foreign-born population - Sierra Leone (%)
Place of birth for the foreign-born population - Other Western Africa (%)
Place of birth for the foreign-born population - Australia (%)
Place of birth for the foreign-born population - New Zealand (%)
Place of birth for the foreign-born population - Fiji (%)
Place of birth for the foreign-born population - Micronesia (%)
Place of birth for the foreign-born population - Bahamas (%)
Place of birth for the foreign-born population - Barbados (%)
Place of birth for the foreign-born population - Cuba (%)
Place of birth for the foreign-born population - Dominica (%)
Place of birth for the foreign-born population - Dominican Republic (%)
Place of birth for the foreign-born population - Grenada (%)
Place of birth for the foreign-born population - Haiti (%)
Place of birth for the foreign-born population - Jamaica (%)
Place of birth for the foreign-born population - St. Vincent and the Grenadines (%)
Place of birth for the foreign-born population - Trinidad and Tobago (%)
Place of birth for the foreign-born population - West Indies (%)
Place of birth for the foreign-born population - Other Caribbean (%)
Place of birth for the foreign-born population - Belize (%)
Place of birth for the foreign-born population - Costa Rica (%)
Place of birth for the foreign-born population - El Salvador (%)
Place of birth for the foreign-born population - Guatemala (%)
Place of birth for the foreign-born population - Honduras (%)
Place of birth for the foreign-born population - Mexico (%)
Place of birth for the foreign-born population - Nicaragua (%)
Place of birth for the foreign-born population - Panama (%)
Place of birth for the foreign-born population - Other Central America (%)
Place of birth for the foreign-born population - Argentina (%)
Place of birth for the foreign-born population - Bolivia (%)
Place of birth for the foreign-born population - Brazil (%)
Place of birth for the foreign-born population - Chile (%)
Place of birth for the foreign-born population - Colombia (%)
Place of birth for the foreign-born population - Ecuador (%)
Place of birth for the foreign-born population - Guyana (%)
Place of birth for the foreign-born population - Peru (%)
Place of birth for the foreign-born population - Uruguay (%)
Place of birth for the foreign-born population - Venezuela (%)
Place of birth for the foreign-born population - Other South America (%)
Place of birth for the foreign-born population - Canada (%)
Place of birth for the foreign-born population - Other Northern America (%)
Place of birth for the foreign-born population - Other (%)
Latest news about races in Janesville, WI collected exclusively by city-data.com from local newspapers, TV, and radio stations
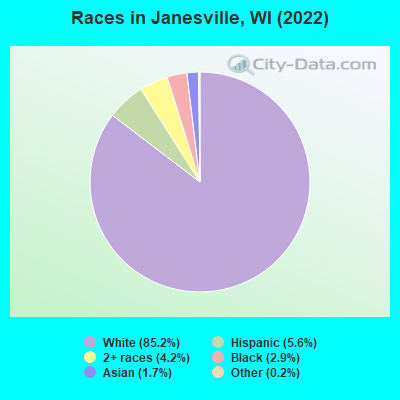
According to 2022 data, the most numerous races in Janesville, WI are White alone (56,039 residents), Hispanic (3,704 residents), and Black alone (1,883 residents). 92.2% of Janesville residents speak English at home. 3.5% of Janesville, WI residents are foreign-born (1.6% born in Latin America, 1.1% born in Asia, 0.6% born in Europe), which is 44.0% less than the foreign-born rate of 5.0% across the entire state of Wisconsin.
Race distribution in Janesville
2000 2022
4,681,630 87.3% White alone 300,245 5.6% Black alone 192,921 3.6% Hispanic 87,995 1.6% Asian alone 51,921 1.0% Two or more races 43,980 0.8% American Indian alone 3,637 0.07% Other race alone 1,346 0.03% Native Hawaiian and Other
4,654,031 79.0% White alone 447,022 7.6% Hispanic 345,678 5.9% Black alone 217,532 3.7% Two or more races 172,242 2.9% Asian alone 33,762 0.6% American Indian alone 19,680 0.3% Other race alone 2,592 0.04% Native Hawaiian and Other
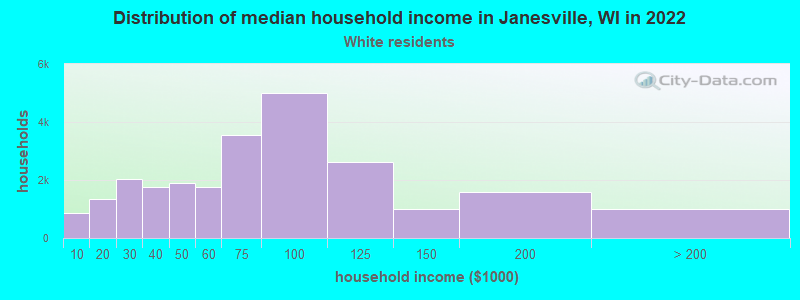
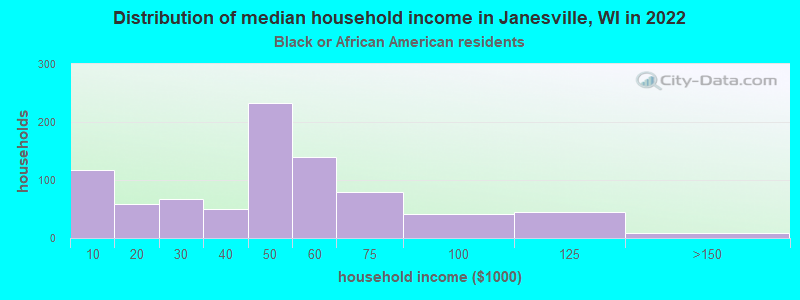
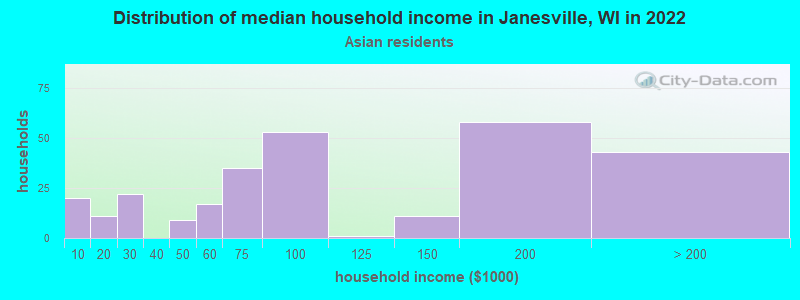
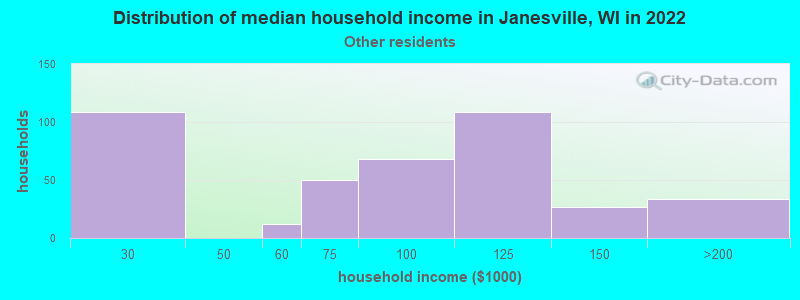
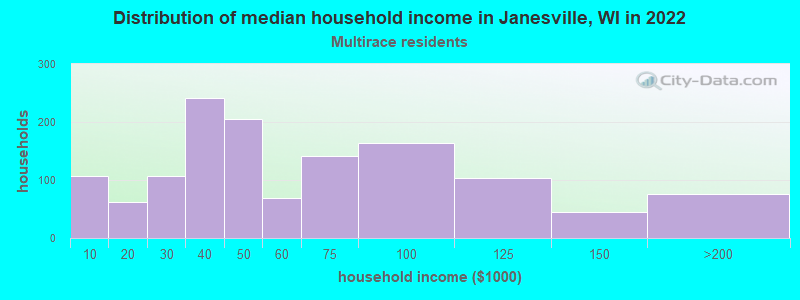
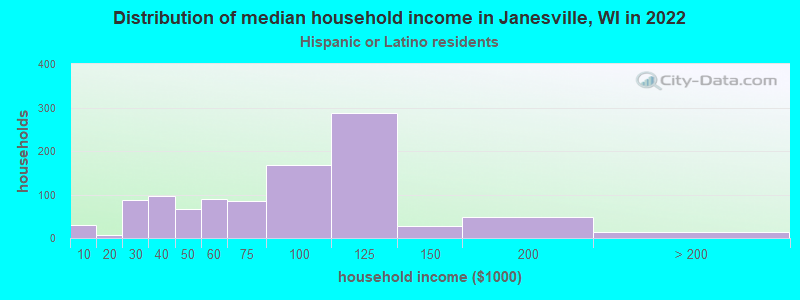
Income and house value in Janesville Median household income in 2022 $70,899 White non-Hispanic householders$40,052 Black householders$59,617 Asian householders$88,651 Some other race householders$39,818 Two or more races householders$86,474 Hispanic or Latino race householdersMedian 2022 house value $201,009 White Non-Hispanic householders$237,155 Black or African American householders$170,687 American Indian or Alaska Native householders $197,796 Asian householders$160,647 Some other race householders$184,744 Two or more races householders$193,981 Hispanic or Latino householders
Median age by race in Janesville
40.6 Median age for White residents40.7 40.5 19.9 Median age for Black or African American residents16.7 43.4 -666,666,666.0 Median age for American Indian / Alaska Native residents-666,666,666.0 -666,666,666.0 39.5 Median age for Asian residents66.5 39.3 -666,666,666.0 Median age for Native Hawaiian / Pacific Islander residents-666,666,666.0 -666,666,666.0 40.7 Median age for Other race residents29.8 46.4 31.2 Median age for Two or more races residents20.9 44.3 40.7 Median age for White alone residents40.7 40.6 24.4 Median age for Hispanic or Latino residents20.8 35.3
Owner/renter occupied households by race in Janesville
House owners and renters - White residents 17,278 70.8% Owner occupied7,117 29.2% Renter occupiedHouse owners and renters - Black or African American residents 149 17.9% Owner occupied685 82.1% Renter occupiedHouse owners and renters - American Indian / Alaska Native residents 53 90.9% Owner occupied5 9.1% Renter occupiedHouse owners and renters - Asian residents 308 62.1% Owner occupied188 37.9% Renter occupiedHouse owners and renters - Other race residents 102 34.6% Owner occupied193 65.4% Renter occupiedHouse owners and renters - Two or more races residents 642 44.1% Owner occupied813 55.9% Renter occupiedHouse owners and renters - White alone residents 17,278 70.8% Owner occupied7,117 29.2% Renter occupiedHouse owners and renters - Hispanic or Latino residents 216 27.7% Owner occupied564 72.3% Renter occupied
Language usage in Janesville
English speakers - Total 92.2% of residents of Janesville speak English at home.
4.6% of residents speak Spanish at home 1,868 65.5% Speak English very well984 34.5% Speak English less than very well2.9% of residents speak other language at home 1,020 56.6% Speak English very well781 43.4% Speak English less than very well
English speakers - Born in the United States 94.0% of residents of Janesville speak English at home.
3.9% of residents speak Spanish at home 609 90.9% Speak English very well61 9.1% Speak English less than very well0.9% of residents speak other language at home 93 62.8% Speak English very well55 37.2% Speak English less than very well
English speakers - Native, born elsewhere 68.5% of residents of Janesville speak English at home.
10.6% of residents speak Spanish at home 32 62.7% Speak English very well19 37.3% Speak English less than very well15.8% of residents speak other language at home 76 100.0% Speak English very well
English speakers - Foreign-born 20.1% of residents of Janesville speak English at home.
44.3% of residents speak Spanish at home 478 46.8% Speak English very well543 53.2% Speak English less than very well39.5% of residents speak other language at home 644 70.6% Speak English very well268 29.4% Speak English less than very well
White (Caucasian) - Speak only English Native:
99.0% (52,204)Foreign-born:
69.2% (341)
White (Caucasian) - Speak another language Native:
1.0% (538)Foreign-born:
30.8% (152)
Black or African American - Speak only English Native:
100.0% (1,930)Foreign-born:
60.2% (55)
Black or African American - Speak another language Native:
0.2% (4)Foreign-born:
24.9% (23)
Asian - Speak only English Native:
50.9% (213)Foreign-born:
19.7% (116)
Asian - Speak another language Native:
51.1% (214)Foreign-born:
80.2% (473)
Other race - Speak only English Native:
70.7% (326)Foreign-born:
8.1% (13)
Other race - Speak another language Native:
96.4% (444)Foreign-born:
91.9% (142)
Two or more races - Speak only English Native:
57.0% (2,385)Foreign-born:
0.3% (2)
Two or more races - Speak another language Native:
30.1% (1,257)Foreign-born:
76.2% (508)
White alone - Speak only English Native:
99.0% (52,144)Foreign-born:
69.2% (341)
White alone - Speak another language Native:
1.0% (523)Foreign-born:
30.8% (152)
Hispanic or Latino - Speak only English Native:
59.7% (1,081)Foreign-born:
2.7% (32)
Hispanic or Latino - Speak another language Native:
40.3% (730)Foreign-born:
97.3% (1,136)
Foreign-born residents in Janesville 2,284 residents are foreign born (1.6% Latin America , 1.1% Asia , 0.6% Europe ).
This city:
3.5%Wisconsin:
5.0%
Marital status for residents in Janesville Marital status - White (Caucasian) population 15 years and over
Males 37.9% Never married44.9% Now married0.5% Separated3.9% Widowed12.8% DivorcedFemales 30.7% Never married45.8% Now married1.0% Separated8.0% Widowed14.5% DivorcedWomen who gave birth in the past 12 months Now married:
85.3% (824)Unmarried:
14.7% (142)
Women who did not give birth in the past 12 months Now married:
38.1% (4,589)Unmarried:
61.9% (7,460)
Marital status - Black or African American population 15 years and over
Males 48.3% Never married43.8% Now married1.3% Separated0.0% Widowed6.6% DivorcedFemales 63.3% Never married16.6% Now married9.9% Separated0.0% Widowed10.2% DivorcedWomen who gave birth in the past 12 months Now married:
0.0% (0)Unmarried:
100.0% (16)
Women who did not give birth in the past 12 months Now married:
29.8% (155)Unmarried:
70.2% (366)
Marital status - American Indian / Alaska Native population 15 years and over
Males 89.5% Never married0.0% Now married0.0% Separated0.0% Widowed10.5% DivorcedFemales 11.3% Never married11.3% Now married0.0% Separated77.4% Widowed0.0% DivorcedWomen who gave birth in the past 12 months Now married:
0.0% (0)Unmarried:
100.0% (6)
Marital status - Asian population 15 years and over
Males 34.2% Never married47.0% Now married10.0% Separated0.0% Widowed8.8% DivorcedFemales 41.7% Never married36.4% Now married3.9% Separated2.6% Widowed15.4% DivorcedWomen who did not give birth in the past 12 months Now married:
39.0% (149)Unmarried:
61.0% (233)
Marital status - Other race population 15 years and over
Males 37.9% Never married45.2% Now married0.0% Separated0.0% Widowed16.9% DivorcedFemales 55.2% Never married35.2% Now married9.6% Separated0.0% Widowed0.0% DivorcedWomen who did not give birth in the past 12 months Now married:
39.2% (149)Unmarried:
60.8% (231)
Marital status - Two or more races population 15 years and over
Males 63.4% Never married29.2% Now married5.7% Separated0.0% Widowed1.8% DivorcedFemales 37.2% Never married34.6% Now married6.3% Separated2.1% Widowed19.8% DivorcedWomen who gave birth in the past 12 months Now married:
0.0% (0)Unmarried:
100.0% (57)
Women who did not give birth in the past 12 months Now married:
35.9% (414)Unmarried:
64.1% (739)
Marital status - White alone, not Hispanic / Latino population 15 years and over
Males 37.8% Never married44.9% Now married0.5% Separated4.0% Widowed12.8% DivorcedFemales 30.7% Never married45.8% Now married1.0% Separated8.0% Widowed14.5% DivorcedWomen who gave birth in the past 12 months Now married:
85.3% (824)Unmarried:
14.7% (142)
Women who did not give birth in the past 12 months Now married:
38.1% (4,589)Unmarried:
61.9% (7,460)
Marital status - Hispanic or Latino population 15 years and over
Males 51.5% Never married36.0% Now married2.2% Separated0.4% Widowed10.0% DivorcedFemales 31.7% Never married43.3% Now married7.2% Separated9.0% Widowed8.8% DivorcedWomen who gave birth in the past 12 months Now married:
100.0% (5)Unmarried:
0.0% (0)
Women who did not give birth in the past 12 months Now married:
47.4% (357)Unmarried:
52.6% (397)
Ancestries in Janesville
7,957 29.4% German2,436 9.0% Irish2,421 8.9% American2,405 8.9% Norwegian1,420 5.2% English657 2.4% Italian550 2.0% Polish451 1.7% European266 1.0% Swiss266 1.0% Swedish257 0.9% Scandinavian235 0.9% Russian208 0.8% Dutch204 0.8% French190 0.7% African171 0.6% Scottish150 0.6% Czech92 0.3% Scotch-Irish81 0.3% Albanian71 0.3% French Canadian70 0.3% Czechoslovakian56 0.2% Hungarian54 0.2% British51 0.2% Croatian38 0.1% Iranian28 0.1% Eastern European28 0.1% Jamaican24 0.09% Danish23 0.08% Belgian23 0.08% Portuguese22 0.08% Slavic21 0.08% Pennsylvania German16 0.06% Welsh13 0.05% Northern European12 0.04% Greek12 0.04% Finnish10 0.04% Lithuanian8 0.03% Austrian7 0.03% Ukrainian5 0.02% Bulgarian5 0.02% Slovene3 0.01% Haitian2 0.01% Icelander
Geographical mobility in Janesville Same house 1 year ago 50,911 91.0% White (Caucasian)1,660 79.3% Black or African American62 81.6% American Indian / Alaska Native709 97.8% Asian1,139 88.1% Other race4,614 86.2% Two or more races50,911 91.1% White alone, not Hispanic / Latino3,247 91.2% Hispanic or LatinoMoved within same county 3,730 6.7% White / Caucasian232 11.1% Black or African American3 0.4% Asian78 6.0% Other race451 8.4% Two or more races3,655 6.5% White alone, not Hispanic / Latino239 6.7% Hispanic or LatinoMoved within same state 831 1.5% White / Caucasian139 6.6% Black or African American6 7.3% American Indian / Alaska Native13 1.8% Asian68 1.3% Two or more races831 1.5% White alone, not Hispanic / Latino32 0.9% Hispanic or LatinoMoved from different state 495 0.9% White / Caucasian68 3.2% Black or African American6 7.3% American Indian / Alaska Native46 3.5% Other race201 3.8% Two or more races495 0.9% White alone, not Hispanic / Latino43 1.2% Hispanic or Latino
Children Nativity (place of birth) in Janesville
Children under 6 years - Living with two parents Both parents native 2,544 100.0% NativeBoth parents foreign-born 127 94.3% Native8 5.7% Foreign-bornOne native, one foreign-born parent 103 100.0% NativeChildren under 6 years - Living with one parent Native parent 1,169 100.0% NativeForeign-born parent 3 100.0% Foreign-bornChildren 6 to 17 years - Living with two parents Both parents native 5,576 100.0% NativeBoth parents foreign-born 287 93.9% Native19 6.1% Foreign-bornOne native, one foreign-born parent 178 100.0% NativeChildren 6 to 17 years - Living with one parent Native parent 3,269 100.0% NativeForeign-born parent 95 48.4% Native101 51.6% Foreign-born
Grandparents responsible for own grandchildren in Janesville
Grandparents (30 to 59 years) White / Caucasian 49 22.6% Responsible for grandchildren169 77.4% Not responsible for grandchildrenTwo or more races 32 100.0% Responsible for grandchildrenWhite alone, not Hispanic / Latino 51 22.4% Responsible for grandchildren176 77.6% Not responsible for grandchildrenHispanic or Latino 6 100.0% Not responsible for grandchildrenGrandparents (60 years and over) White / Caucasian 186 48.7% Responsible for grandchildren196 51.3% Not responsible for grandchildrenWhite alone, not Hispanic / Latino 181 51.6% Responsible for grandchildren170 48.4% Not responsible for grandchildrenHispanic or Latino 3 10.4% Responsible for grandchildren30 89.6% Not responsible for grandchildren