Races in Huntington, West Virginia (WV) Detailed Stats
Data:
Races - White alone (%)
Races - White alone (% change since 2000)
Races - Black alone (%)
Races - Black alone (% change since 2000)
Races - American Indian alone (%)
Races - American Indian alone (% change since 2000)
Races - Asian alone (%)
Races - Asian alone (% change since 2000)
Races - Hispanic (%)
Races - Hispanic (% change since 2000)
Races - Native Hawaiian and Other Pacific Islander alone (%)
Races - Native Hawaiian and Other Pacific Islander alone (% change since 2000)
Races - Two or more races(%)
Races - Two or more races(% change since 2000)
Races - Other race alone (%)
Races - Other race alone (% change since 2000)
Racial diversity
Place of birth - Born in state of residence (%)
Place of birth - Born in state of residence (%) - White
Place of birth - Born in state of residence (%) - Black or African American
Place of birth - Born in state of residence (%) - Asian
Place of birth - Born in state of residence (%) - Hispanic or Latino
Place of birth - Born in state of residence (%) - American Indian and Alaska Native
Place of birth - Born in state of residence (%) - Multirace
Place of birth - Born in state of residence (%) - Other Race
Place of birth - Born in other state (%)
Place of birth - Born in other state (%) - White
Place of birth - Born in other state (%) - Black or African American
Place of birth - Born in other state (%) - Asian
Place of birth - Born in other state (%) - Hispanic or Latino
Place of birth - Born in other state (%) - American Indian and Alaska Native
Place of birth - Born in other state (%) - Multirace
Place of birth - Born in other state (%) - Other Race
Place of birth - Native, outside of US (%)
Place of birth - Native, outside of US (%) - White
Place of birth - Native, outside of US (%) - Black or African American
Place of birth - Native, outside of US (%) - Asian
Place of birth - Native, outside of US (%) - Hispanic or Latino
Place of birth - Native, outside of US (%) - American Indian and Alaska Native
Place of birth - Native, outside of US (%) - Multirace
Place of birth - Native, outside of US (%) - Other Race
Place of birth - Foreign born (%)
Place of birth - Foreign born (%) - White
Place of birth - Foreign born (%) - Black or African American
Place of birth - Foreign born (%) - Asian
Place of birth - Foreign born (%) - Hispanic or Latino
Place of birth - Foreign born (%) - American Indian and Alaska Native
Place of birth - Foreign born (%) - Multirace
Place of birth - Foreign born (%) - Other Race
Residents speaking English at home (%)
Residents speaking English at home - Born in the United States (%)
Residents speaking English at home - Native, born elsewhere (%)
Residents speaking English at home - Foreign born (%)
Residents speaking Spanish at home (%)
Residents speaking Spanish at home - Born in the United States (%)
Residents speaking Spanish at home - Native, born elsewhere (%)
Residents speaking Spanish at home - Foreign born (%)
Residents speaking other language at home (%)
Residents speaking other language at home - Born in the United States (%)
Residents speaking other language at home - Native, born elsewhere (%)
Residents speaking other language at home - Foreign born (%)
Marital status - Never married (%)
Marital status - Now married (%)
Marital status - Separated (%)
Marital status - Widowed (%)
Marital status - Divorced (%)
Ancestries Reported - Arab (%)
Ancestries Reported - Czech (%)
Ancestries Reported - Danish (%)
Ancestries Reported - Dutch (%)
Ancestries Reported - English (%)
Ancestries Reported - French (%)
Ancestries Reported - French Canadian (%)
Ancestries Reported - German (%)
Ancestries Reported - Greek (%)
Ancestries Reported - Hungarian (%)
Ancestries Reported - Irish (%)
Ancestries Reported - Italian (%)
Ancestries Reported - Lithuanian (%)
Ancestries Reported - Norwegian (%)
Ancestries Reported - Polish (%)
Ancestries Reported - Portuguese (%)
Ancestries Reported - Russian (%)
Ancestries Reported - Scotch-Irish (%)
Ancestries Reported - Scottish (%)
Ancestries Reported - Slovak (%)
Ancestries Reported - Subsaharan African (%)
Ancestries Reported - Swedish (%)
Ancestries Reported - Swiss (%)
Ancestries Reported - Ukrainian (%)
Ancestries Reported - United States (%)
Ancestries Reported - Welsh (%)
Ancestries Reported - West Indian (%)
Ancestries Reported - Other (%)
Geographical mobility - Same house 1 year ago (%)
Geographical mobility - Same house 1 year ago (%) - White
Geographical mobility - Same house 1 year ago (%) - Black or African American
Geographical mobility - Same house 1 year ago (%) - Asian
Geographical mobility - Same house 1 year ago (%) - Hispanic or Latino
Geographical mobility - Same house 1 year ago (%) - American Indian and Alaska Native
Geographical mobility - Same house 1 year ago (%) - Multirace
Geographical mobility - Same house 1 year ago (%) - Other Race
Geographical mobility - Moved within same county (%)
Geographical mobility - Moved within same county (%) - White
Geographical mobility - Moved within same county (%) - Black or African American
Geographical mobility - Moved within same county (%) - Asian
Geographical mobility - Moved within same county (%) - Hispanic or Latino
Geographical mobility - Moved within same county (%) - American Indian and Alaska Native
Geographical mobility - Moved within same county (%) - Multirace
Geographical mobility - Moved within same county (%) - Other Race
Geographical mobility - Moved from different county within same state (%)
Geographical mobility - Moved from different county within same state (%) - White
Geographical mobility - Moved from different county within same state (%) - Black or African American
Geographical mobility - Moved from different county within same state (%) - Asian
Geographical mobility - Moved from different county within same state (%) - Hispanic or Latino
Geographical mobility - Moved from different county within same state (%) - American Indian and Alaska Native
Geographical mobility - Moved from different county within same state (%) - Multirace
Geographical mobility - Moved from different county within same state (%) - Other Race
Geographical mobility - Moved from different state (%)
Geographical mobility - Moved from different state (%) - White
Geographical mobility - Moved from different state (%) - Black or African American
Geographical mobility - Moved from different state (%) - Asian
Geographical mobility - Moved from different state (%) - Hispanic or Latino
Geographical mobility - Moved from different state (%) - American Indian and Alaska Native
Geographical mobility - Moved from different state (%) - Multirace
Geographical mobility - Moved from different state (%) - Other Race
Geographical mobility - Moved from abroad (%)
Geographical mobility - Moved from abroad (%) - White
Geographical mobility - Moved from abroad (%) - Black or African American
Geographical mobility - Moved from abroad (%) - Asian
Geographical mobility - Moved from abroad (%) - Hispanic or Latino
Geographical mobility - Moved from abroad (%) - American Indian and Alaska Native
Geographical mobility - Moved from abroad (%) - Multirace
Geographical mobility - Moved from abroad (%) - Other Race
Place of birth for the foreign-born population - Ireland (%)
Place of birth for the foreign-born population - Denmark (%)
Place of birth for the foreign-born population - Norway (%)
Place of birth for the foreign-born population - Sweden (%)
Place of birth for the foreign-born population - United Kingdom (%)
Place of birth for the foreign-born population - England (%)
Place of birth for the foreign-born population - Scotland (%)
Place of birth for the foreign-born population - Other Northern Europe (%)
Place of birth for the foreign-born population - Austria (%)
Place of birth for the foreign-born population - Belgium (%)
Place of birth for the foreign-born population - France (%)
Place of birth for the foreign-born population - Germany (%)
Place of birth for the foreign-born population - Netherlands (%)
Place of birth for the foreign-born population - Switzerland (%)
Place of birth for the foreign-born population - Other Western Europe (%)
Place of birth for the foreign-born population - Greece (%)
Place of birth for the foreign-born population - Italy (%)
Place of birth for the foreign-born population - Portugal (%)
Place of birth for the foreign-born population - Spain (%)
Place of birth for the foreign-born population - Other Southern Europe (%)
Place of birth for the foreign-born population - Albania (%)
Place of birth for the foreign-born population - Belarus (%)
Place of birth for the foreign-born population - Bosnia and Herzegovina (%)
Place of birth for the foreign-born population - Bulgaria (%)
Place of birth for the foreign-born population - Croatia (%)
Place of birth for the foreign-born population - Czechoslovakia (%)
Place of birth for the foreign-born population - Hungary (%)
Place of birth for the foreign-born population - Latvia (%)
Place of birth for the foreign-born population - Lithuania (%)
Place of birth for the foreign-born population - North Macedonia (Macedonia) (%)
Place of birth for the foreign-born population - Moldova (%)
Place of birth for the foreign-born population - Poland (%)
Place of birth for the foreign-born population - Romania (%)
Place of birth for the foreign-born population - Russia (%)
Place of birth for the foreign-born population - Serbia (%)
Place of birth for the foreign-born population - Ukraine (%)
Place of birth for the foreign-born population - Other Eastern Europe (%)
Place of birth for the foreign-born population - China (%)
Place of birth for the foreign-born population - Hong Kong (%)
Place of birth for the foreign-born population - Taiwan (%)
Place of birth for the foreign-born population - Japan (%)
Place of birth for the foreign-born population - Korea (%)
Place of birth for the foreign-born population - Other Eastern Asia (%)
Place of birth for the foreign-born population - Afghanistan (%)
Place of birth for the foreign-born population - Bangladesh (%)
Place of birth for the foreign-born population - India (%)
Place of birth for the foreign-born population - Iran (%)
Place of birth for the foreign-born population - Kazakhstan (%)
Place of birth for the foreign-born population - Nepal (%)
Place of birth for the foreign-born population - Pakistan (%)
Place of birth for the foreign-born population - Sri Lanka (%)
Place of birth for the foreign-born population - Uzbekistan (%)
Place of birth for the foreign-born population - Other South Central Asia (%)
Place of birth for the foreign-born population - Burma (%)
Place of birth for the foreign-born population - Cambodia (%)
Place of birth for the foreign-born population - Indonesia (%)
Place of birth for the foreign-born population - Laos (%)
Place of birth for the foreign-born population - Malaysia (%)
Place of birth for the foreign-born population - Philippines (%)
Place of birth for the foreign-born population - Singapore (%)
Place of birth for the foreign-born population - Thailand (%)
Place of birth for the foreign-born population - Vietnam (%)
Place of birth for the foreign-born population - Other South Eastern Asia (%)
Place of birth for the foreign-born population - Armenia (%)
Place of birth for the foreign-born population - Iraq (%)
Place of birth for the foreign-born population - Israel (%)
Place of birth for the foreign-born population - Jordan (%)
Place of birth for the foreign-born population - Kuwait (%)
Place of birth for the foreign-born population - Lebanon (%)
Place of birth for the foreign-born population - Saudi Arabia (%)
Place of birth for the foreign-born population - Syria (%)
Place of birth for the foreign-born population - Turkey (%)
Place of birth for the foreign-born population - Yemen (%)
Place of birth for the foreign-born population - Other Western Asia (%)
Place of birth for the foreign-born population - Eritrea (%)
Place of birth for the foreign-born population - Ethiopia (%)
Place of birth for the foreign-born population - Kenya (%)
Place of birth for the foreign-born population - Somalia (%)
Place of birth for the foreign-born population - Uganda (%)
Place of birth for the foreign-born population - Zimbabwe (%)
Place of birth for the foreign-born population - Other Eastern Africa (%)
Place of birth for the foreign-born population - Cameroon (%)
Place of birth for the foreign-born population - Congo (%)
Place of birth for the foreign-born population - Democratic Republic of Congo (Zaire) (%)
Place of birth for the foreign-born population - Other Middle Africa (%)
Place of birth for the foreign-born population - Egypt (%)
Place of birth for the foreign-born population - Morocco (%)
Place of birth for the foreign-born population - Sudan (%)
Place of birth for the foreign-born population - Other Northern Africa (%)
Place of birth for the foreign-born population - South Africa (%)
Place of birth for the foreign-born population - Other Southern Africa (%)
Place of birth for the foreign-born population - Cabo Verde (%)
Place of birth for the foreign-born population - Ghana (%)
Place of birth for the foreign-born population - Liberia (%)
Place of birth for the foreign-born population - Nigeria (%)
Place of birth for the foreign-born population - Senegal (%)
Place of birth for the foreign-born population - Sierra Leone (%)
Place of birth for the foreign-born population - Other Western Africa (%)
Place of birth for the foreign-born population - Australia (%)
Place of birth for the foreign-born population - New Zealand (%)
Place of birth for the foreign-born population - Fiji (%)
Place of birth for the foreign-born population - Micronesia (%)
Place of birth for the foreign-born population - Bahamas (%)
Place of birth for the foreign-born population - Barbados (%)
Place of birth for the foreign-born population - Cuba (%)
Place of birth for the foreign-born population - Dominica (%)
Place of birth for the foreign-born population - Dominican Republic (%)
Place of birth for the foreign-born population - Grenada (%)
Place of birth for the foreign-born population - Haiti (%)
Place of birth for the foreign-born population - Jamaica (%)
Place of birth for the foreign-born population - St. Vincent and the Grenadines (%)
Place of birth for the foreign-born population - Trinidad and Tobago (%)
Place of birth for the foreign-born population - West Indies (%)
Place of birth for the foreign-born population - Other Caribbean (%)
Place of birth for the foreign-born population - Belize (%)
Place of birth for the foreign-born population - Costa Rica (%)
Place of birth for the foreign-born population - El Salvador (%)
Place of birth for the foreign-born population - Guatemala (%)
Place of birth for the foreign-born population - Honduras (%)
Place of birth for the foreign-born population - Mexico (%)
Place of birth for the foreign-born population - Nicaragua (%)
Place of birth for the foreign-born population - Panama (%)
Place of birth for the foreign-born population - Other Central America (%)
Place of birth for the foreign-born population - Argentina (%)
Place of birth for the foreign-born population - Bolivia (%)
Place of birth for the foreign-born population - Brazil (%)
Place of birth for the foreign-born population - Chile (%)
Place of birth for the foreign-born population - Colombia (%)
Place of birth for the foreign-born population - Ecuador (%)
Place of birth for the foreign-born population - Guyana (%)
Place of birth for the foreign-born population - Peru (%)
Place of birth for the foreign-born population - Uruguay (%)
Place of birth for the foreign-born population - Venezuela (%)
Place of birth for the foreign-born population - Other South America (%)
Place of birth for the foreign-born population - Canada (%)
Place of birth for the foreign-born population - Other Northern America (%)
Place of birth for the foreign-born population - Other (%)
Latest news about races in Huntington, WV collected exclusively by city-data.com from local newspapers, TV, and radio stations
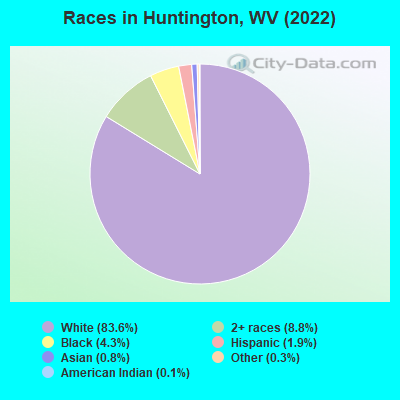
According to 2022 data, the most numerous races in Huntington, WV are White alone (38,490 residents), Two or more races (4,069 residents), and Black alone (1,966 residents). 96.5% of Huntington residents speak English at home. 2.3% of Huntington, WV residents are foreign-born (1.2% born in Asia, 0.6% born in Latin America, 0.3% born in Europe), which is 56.3% greater than the foreign-born rate of 1.0% across the entire state of West Virginia.
Race distribution in Huntington
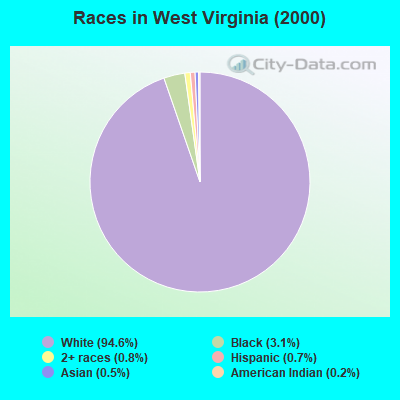
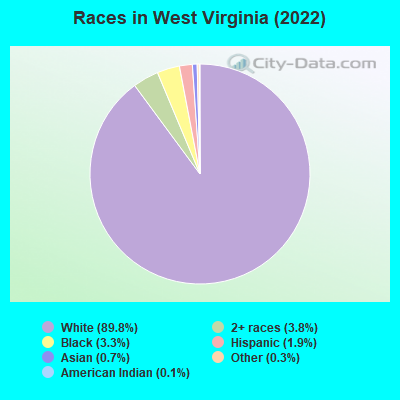
2000 2022
1,709,966 94.6% White alone 56,825 3.1% Black alone 14,983 0.8% Two or more races 12,279 0.7% Hispanic 9,356 0.5% Asian alone 3,456 0.2% American Indian alone 1,144 0.06% Other race alone 335 0.02% Native Hawaiian and Other
1,594,128 89.8% White alone 66,932 3.8% Two or more races 59,390 3.3% Black alone 34,343 1.9% Hispanic 13,134 0.7% Asian alone 5,238 0.3% Other race alone 1,880 0.1% American Indian alone 111 0.01% Native Hawaiian and Other
Income and house value in Huntington Median household income in 2022 $46,584 White non-Hispanic householders$24,215 Black householders$74,942 Asian householders$38,626 Some other race householders$26,140 Two or more races householders$40,512 Hispanic or Latino race householdersMedian 2022 house value $126,103 White Non-Hispanic householders$96,533 Black or African American householders$71,541 American Indian or Alaska Native householders $170,172 Asian householders$120,189 Some other race householders$75,547 Two or more races householders$124,004 Hispanic or Latino householders
Median age by race in Huntington
37.7 Median age for White residents36.6 37.7 28.1 Median age for Black or African American residents31.1 27.5 54.6 Median age for American Indian / Alaska Native residents-666,666,666.0 55.9 30.3 Median age for Asian residents31.8 31.8 -666,666,666.0 Median age for Native Hawaiian / Pacific Islander residents-666,666,666.0 -666,666,666.0 31.1 Median age for Other race residents35.9 35.3 23.0 Median age for Two or more races residents21.4 23.3 37.8 Median age for White alone residents36.6 37.8 27.9 Median age for Hispanic or Latino residents25.5 29.4
Owner/renter occupied households by race in Huntington
House owners and renters - White residents 9,789 59.3% Owner occupied6,725 40.7% Renter occupiedHouse owners and renters - Black or African American residents 266 17.8% Owner occupied1,230 82.2% Renter occupiedHouse owners and renters - American Indian / Alaska Native residents 10 68.6% Owner occupied5 31.4% Renter occupiedHouse owners and renters - Asian residents 182 49.6% Owner occupied185 50.4% Renter occupiedHouse owners and renters - Native Hawaiian / Pacific Islander residents 5 100.0% Owner occupiedHouse owners and renters - Other race residents 45 36.0% Owner occupied80 64.0% Renter occupiedHouse owners and renters - Two or more races residents 785 47.3% Owner occupied876 52.7% Renter occupiedHouse owners and renters - White alone residents 9,787 59.6% Owner occupied6,632 40.4% Renter occupiedHouse owners and renters - Hispanic or Latino residents 110 37.6% Owner occupied183 62.4% Renter occupied
Language usage in Huntington
English speakers - Total 96.5% of residents of Huntington speak English at home.
1.8% of residents speak Spanish at home 496 61.6% Speak English very well309 38.4% Speak English less than very well1.7% of residents speak other language at home 527 69.3% Speak English very well233 30.7% Speak English less than very well
English speakers - Born in the United States 97.3% of residents of Huntington speak English at home.
2.2% of residents speak Spanish at home 228 83.5% Speak English very well45 16.5% Speak English less than very well0.6% of residents speak other language at home 72 100.0% Speak English very well
English speakers - Native, born elsewhere 88.3% of residents of Huntington speak English at home.
6.0% of residents speak other language at home 8 53.3% Speak English very well7 46.7% Speak English less than very well
English speakers - Foreign-born 29.4% of residents of Huntington speak English at home.
20.3% of residents speak Spanish at home 86 36.6% Speak English very well149 63.4% Speak English less than very well50.0% of residents speak other language at home 394 68.3% Speak English very well183 31.7% Speak English less than very well
White (Caucasian) - Speak only English Native:
99.0% (36,583)Foreign-born:
76.3% (143)
White (Caucasian) - Speak another language Native:
1.0% (354)Foreign-born:
32.1% (60)
Black or African American - Speak only English Native:
99.8% (2,829)Foreign-born:
65.4% (83)
Black or African American - Speak another language Native:
0.4% (13)Foreign-born:
28.6% (36)
Asian - Speak only English Native:
27.4% (37)Foreign-born:
15.0% (81)
Asian - Speak another language Native:
63.1% (86)Foreign-born:
84.3% (453)
Other race - Speak only English Native:
55.1% (105)Foreign-born:
5.5% (4)
Other race - Speak another language Native:
52.0% (99)Foreign-born:
92.2% (74)
Two or more races - Speak only English Native:
92.8% (2,659)Foreign-born:
7.2% (21)
Two or more races - Speak another language Native:
7.4% (212)Foreign-born:
97.9% (281)
White alone - Speak only English Native:
99.0% (36,520)Foreign-born:
76.6% (148)
White alone - Speak another language Native:
0.9% (347)Foreign-born:
29.3% (57)
Hispanic or Latino - Speak only English Native:
52.0% (258)Foreign-born:
8.5% (21)
Hispanic or Latino - Speak another language Native:
55.5% (275)Foreign-born:
92.8% (226)
Foreign-born residents in Huntington 1,052 residents are foreign born (1.2% Asia , 0.6% Latin America , 0.3% Europe ).
This city:
2.3%West Virginia:
1.6%
Marital status for residents in Huntington Marital status - White (Caucasian) population 15 years and over
Males 45.0% Never married37.7% Now married1.0% Separated3.5% Widowed12.7% DivorcedFemales 38.1% Never married34.2% Now married1.3% Separated10.3% Widowed16.1% DivorcedWomen who gave birth in the past 12 months Now married:
67.6% (177)Unmarried:
32.4% (84)
Women who did not give birth in the past 12 months Now married:
29.4% (2,894)Unmarried:
70.6% (6,935)
Marital status - Black or African American population 15 years and over
Males 45.3% Never married32.3% Now married1.0% Separated0.0% Widowed21.3% DivorcedFemales 65.1% Never married19.4% Now married3.3% Separated1.9% Widowed10.2% DivorcedWomen who gave birth in the past 12 months Now married:
56.2% (19)Unmarried:
43.8% (15)
Women who did not give birth in the past 12 months Now married:
8.1% (74)Unmarried:
91.9% (837)
Marital status - American Indian / Alaska Native population 15 years and over
Males 25.0% Never married0.0% Now married0.0% Separated0.0% Widowed75.0% DivorcedFemales 18.2% Never married0.0% Now married0.0% Separated30.3% Widowed51.5% DivorcedWomen who did not give birth in the past 12 months Now married:
0.0% (0)Unmarried:
100.0% (14)
Marital status - Asian population 15 years and over
Males 40.4% Never married59.6% Now married0.0% Separated0.0% Widowed0.0% DivorcedFemales 43.0% Never married48.2% Now married0.0% Separated0.0% Widowed8.8% DivorcedWomen who did not give birth in the past 12 months Now married:
41.8% (92)Unmarried:
58.2% (128)
Marital status - Other race population 15 years and over
Males 62.4% Never married37.6% Now married0.0% Separated0.0% Widowed0.0% DivorcedFemales 44.6% Never married24.3% Now married0.0% Separated6.8% Widowed24.3% DivorcedWomen who did not give birth in the past 12 months Now married:
28.6% (26)Unmarried:
71.4% (64)
Marital status - Two or more races population 15 years and over
Males 60.4% Never married21.8% Now married0.3% Separated1.0% Widowed16.6% DivorcedFemales 51.1% Never married29.7% Now married6.0% Separated3.2% Widowed9.9% DivorcedWomen who gave birth in the past 12 months Now married:
100.0% (52)Unmarried:
0.0% (0)
Women who did not give birth in the past 12 months Now married:
22.6% (152)Unmarried:
77.4% (521)
Marital status - White alone, not Hispanic / Latino population 15 years and over
Males 45.0% Never married37.7% Now married1.0% Separated3.6% Widowed12.7% DivorcedFemales 38.2% Never married34.3% Now married1.3% Separated10.2% Widowed16.0% DivorcedWomen who gave birth in the past 12 months Now married:
70.0% (177)Unmarried:
30.0% (76)
Women who did not give birth in the past 12 months Now married:
29.4% (2,873)Unmarried:
70.6% (6,903)
Marital status - Hispanic or Latino population 15 years and over
Males 65.1% Never married32.7% Now married0.0% Separated1.9% Widowed0.4% DivorcedFemales 46.1% Never married24.8% Now married3.0% Separated8.4% Widowed17.7% DivorcedWomen who gave birth in the past 12 months Now married:
73.5% (25)Unmarried:
26.5% (9)
Women who did not give birth in the past 12 months Now married:
16.9% (40)Unmarried:
83.1% (195)
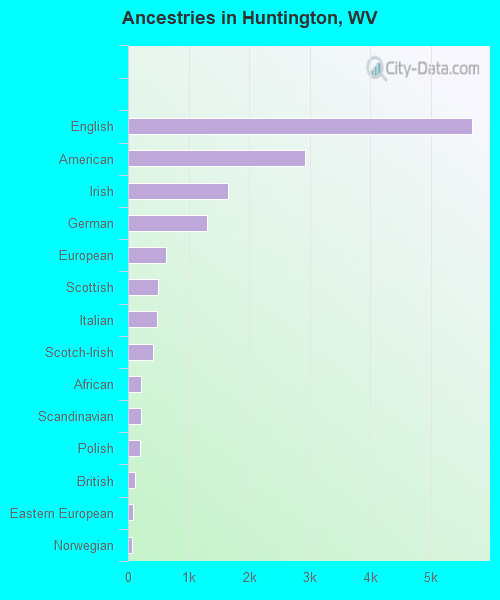
Ancestries in Huntington
5,678 30.0% English2,924 15.5% American1,648 8.7% Irish1,303 6.9% German626 3.3% European493 2.6% Scottish485 2.6% Italian418 2.2% Scotch-Irish222 1.2% African208 1.1% Scandinavian192 1.0% Polish115 0.6% British80 0.4% Eastern European71 0.4% Norwegian46 0.2% French34 0.2% Northern European25 0.1% Ghanaian22 0.1% Swiss21 0.1% Belgian21 0.1% Czech17 0.09% Slovak17 0.09% Iranian16 0.08% Trinidadian and Tobagonian15 0.08% Lebanese13 0.07% Brazilian13 0.07% Greek12 0.06% Canadian11 0.06% Dutch11 0.06% Nigerian11 0.06% West Indian10 0.05% Lithuanian10 0.05% Czechoslovakian9 0.05% Croatian8 0.04% Hungarian7 0.04% Portuguese7 0.04% Russian7 0.04% Welsh3 0.02% Syrian2 0.01% German Russian
Geographical mobility in Huntington Same house 1 year ago 31,172 81.5% White (Caucasian)1,740 81.1% Black or African American59 97.4% American Indian / Alaska Native533 80.6% Asian4 100.0% Native Hawaiian / Pacific Islander223 72.7% Other race2,708 80.1% Two or more races31,271 81.7% White alone, not Hispanic / Latino459 55.2% Hispanic or LatinoMoved within same county 4,242 11.1% White / Caucasian188 8.8% Black or African American54 8.2% Asian33 10.9% Other race289 8.6% Two or more races4,225 11.0% White alone, not Hispanic / Latino32 3.8% Hispanic or LatinoMoved within same state 1,742 4.6% White / Caucasian111 5.2% Black or African American22 3.3% Asian38 12.5% Other race309 9.2% Two or more races1,716 4.5% White alone, not Hispanic / Latino229 27.6% Hispanic or LatinoMoved from different state 943 2.5% White / Caucasian76 3.5% Black or African American25 3.7% Asian41 1.2% Two or more races925 2.4% White alone, not Hispanic / Latino55 6.6% Hispanic or LatinoMoved from abroad 55 0.1% White44 6.7% Asian7 2.2% Other race55 0.1% White alone, not Hispanic / Latino41 4.9% Hispanic or Latino
Children Nativity (place of birth) in Huntington
Children under 6 years - Living with two parents Both parents native 1,357 100.0% NativeBoth parents foreign-born 29 100.0% NativeOne native, one foreign-born parent 43 100.0% NativeChildren under 6 years - Living with one parent Native parent 1,169 100.0% Native
Children 6 to 17 years - Living with two parents Both parents native 2,396 100.0% NativeBoth parents foreign-born 43 100.0% NativeOne native, one foreign-born parent 101 100.0% NativeChildren 6 to 17 years - Living with one parent Native parent 2,243 100.0% Native
Grandparents responsible for own grandchildren in Huntington
Grandparents (30 to 59 years) White / Caucasian 385 78.8% Responsible for grandchildren104 21.2% Not responsible for grandchildrenBlack or African American 50 100.0% Not responsible for grandchildrenTwo or more races 13 100.0% Responsible for grandchildrenWhite alone, not Hispanic / Latino 385 78.8% Responsible for grandchildren104 21.2% Not responsible for grandchildrenGrandparents (60 years and over) White / Caucasian 304 85.5% Responsible for grandchildren51 14.5% Not responsible for grandchildrenBlack or African American 24 100.0% Not responsible for grandchildrenWhite alone, not Hispanic / Latino 304 85.5% Responsible for grandchildren51 14.5% Not responsible for grandchildren