Races in Hialeah Gardens, Florida (FL) Detailed Stats
Data:
Races - White alone (%)
Races - White alone (% change since 2000)
Races - Black alone (%)
Races - Black alone (% change since 2000)
Races - American Indian alone (%)
Races - American Indian alone (% change since 2000)
Races - Asian alone (%)
Races - Asian alone (% change since 2000)
Races - Hispanic (%)
Races - Hispanic (% change since 2000)
Races - Native Hawaiian and Other Pacific Islander alone (%)
Races - Native Hawaiian and Other Pacific Islander alone (% change since 2000)
Races - Two or more races(%)
Races - Two or more races(% change since 2000)
Races - Other race alone (%)
Races - Other race alone (% change since 2000)
Racial diversity
Place of birth - Born in state of residence (%)
Place of birth - Born in state of residence (%) - White
Place of birth - Born in state of residence (%) - Black or African American
Place of birth - Born in state of residence (%) - Asian
Place of birth - Born in state of residence (%) - Hispanic or Latino
Place of birth - Born in state of residence (%) - American Indian and Alaska Native
Place of birth - Born in state of residence (%) - Multirace
Place of birth - Born in state of residence (%) - Other Race
Place of birth - Born in other state (%)
Place of birth - Born in other state (%) - White
Place of birth - Born in other state (%) - Black or African American
Place of birth - Born in other state (%) - Asian
Place of birth - Born in other state (%) - Hispanic or Latino
Place of birth - Born in other state (%) - American Indian and Alaska Native
Place of birth - Born in other state (%) - Multirace
Place of birth - Born in other state (%) - Other Race
Place of birth - Native, outside of US (%)
Place of birth - Native, outside of US (%) - White
Place of birth - Native, outside of US (%) - Black or African American
Place of birth - Native, outside of US (%) - Asian
Place of birth - Native, outside of US (%) - Hispanic or Latino
Place of birth - Native, outside of US (%) - American Indian and Alaska Native
Place of birth - Native, outside of US (%) - Multirace
Place of birth - Native, outside of US (%) - Other Race
Place of birth - Foreign born (%)
Place of birth - Foreign born (%) - White
Place of birth - Foreign born (%) - Black or African American
Place of birth - Foreign born (%) - Asian
Place of birth - Foreign born (%) - Hispanic or Latino
Place of birth - Foreign born (%) - American Indian and Alaska Native
Place of birth - Foreign born (%) - Multirace
Place of birth - Foreign born (%) - Other Race
Residents speaking English at home (%)
Residents speaking English at home - Born in the United States (%)
Residents speaking English at home - Native, born elsewhere (%)
Residents speaking English at home - Foreign born (%)
Residents speaking Spanish at home (%)
Residents speaking Spanish at home - Born in the United States (%)
Residents speaking Spanish at home - Native, born elsewhere (%)
Residents speaking Spanish at home - Foreign born (%)
Residents speaking other language at home (%)
Residents speaking other language at home - Born in the United States (%)
Residents speaking other language at home - Native, born elsewhere (%)
Residents speaking other language at home - Foreign born (%)
Marital status - Never married (%)
Marital status - Now married (%)
Marital status - Separated (%)
Marital status - Widowed (%)
Marital status - Divorced (%)
Ancestries Reported - Arab (%)
Ancestries Reported - Czech (%)
Ancestries Reported - Danish (%)
Ancestries Reported - Dutch (%)
Ancestries Reported - English (%)
Ancestries Reported - French (%)
Ancestries Reported - French Canadian (%)
Ancestries Reported - German (%)
Ancestries Reported - Greek (%)
Ancestries Reported - Hungarian (%)
Ancestries Reported - Irish (%)
Ancestries Reported - Italian (%)
Ancestries Reported - Lithuanian (%)
Ancestries Reported - Norwegian (%)
Ancestries Reported - Polish (%)
Ancestries Reported - Portuguese (%)
Ancestries Reported - Russian (%)
Ancestries Reported - Scotch-Irish (%)
Ancestries Reported - Scottish (%)
Ancestries Reported - Slovak (%)
Ancestries Reported - Subsaharan African (%)
Ancestries Reported - Swedish (%)
Ancestries Reported - Swiss (%)
Ancestries Reported - Ukrainian (%)
Ancestries Reported - United States (%)
Ancestries Reported - Welsh (%)
Ancestries Reported - West Indian (%)
Ancestries Reported - Other (%)
Geographical mobility - Same house 1 year ago (%)
Geographical mobility - Same house 1 year ago (%) - White
Geographical mobility - Same house 1 year ago (%) - Black or African American
Geographical mobility - Same house 1 year ago (%) - Asian
Geographical mobility - Same house 1 year ago (%) - Hispanic or Latino
Geographical mobility - Same house 1 year ago (%) - American Indian and Alaska Native
Geographical mobility - Same house 1 year ago (%) - Multirace
Geographical mobility - Same house 1 year ago (%) - Other Race
Geographical mobility - Moved within same county (%)
Geographical mobility - Moved within same county (%) - White
Geographical mobility - Moved within same county (%) - Black or African American
Geographical mobility - Moved within same county (%) - Asian
Geographical mobility - Moved within same county (%) - Hispanic or Latino
Geographical mobility - Moved within same county (%) - American Indian and Alaska Native
Geographical mobility - Moved within same county (%) - Multirace
Geographical mobility - Moved within same county (%) - Other Race
Geographical mobility - Moved from different county within same state (%)
Geographical mobility - Moved from different county within same state (%) - White
Geographical mobility - Moved from different county within same state (%) - Black or African American
Geographical mobility - Moved from different county within same state (%) - Asian
Geographical mobility - Moved from different county within same state (%) - Hispanic or Latino
Geographical mobility - Moved from different county within same state (%) - American Indian and Alaska Native
Geographical mobility - Moved from different county within same state (%) - Multirace
Geographical mobility - Moved from different county within same state (%) - Other Race
Geographical mobility - Moved from different state (%)
Geographical mobility - Moved from different state (%) - White
Geographical mobility - Moved from different state (%) - Black or African American
Geographical mobility - Moved from different state (%) - Asian
Geographical mobility - Moved from different state (%) - Hispanic or Latino
Geographical mobility - Moved from different state (%) - American Indian and Alaska Native
Geographical mobility - Moved from different state (%) - Multirace
Geographical mobility - Moved from different state (%) - Other Race
Geographical mobility - Moved from abroad (%)
Geographical mobility - Moved from abroad (%) - White
Geographical mobility - Moved from abroad (%) - Black or African American
Geographical mobility - Moved from abroad (%) - Asian
Geographical mobility - Moved from abroad (%) - Hispanic or Latino
Geographical mobility - Moved from abroad (%) - American Indian and Alaska Native
Geographical mobility - Moved from abroad (%) - Multirace
Geographical mobility - Moved from abroad (%) - Other Race
Place of birth for the foreign-born population - Ireland (%)
Place of birth for the foreign-born population - Denmark (%)
Place of birth for the foreign-born population - Norway (%)
Place of birth for the foreign-born population - Sweden (%)
Place of birth for the foreign-born population - United Kingdom (%)
Place of birth for the foreign-born population - England (%)
Place of birth for the foreign-born population - Scotland (%)
Place of birth for the foreign-born population - Other Northern Europe (%)
Place of birth for the foreign-born population - Austria (%)
Place of birth for the foreign-born population - Belgium (%)
Place of birth for the foreign-born population - France (%)
Place of birth for the foreign-born population - Germany (%)
Place of birth for the foreign-born population - Netherlands (%)
Place of birth for the foreign-born population - Switzerland (%)
Place of birth for the foreign-born population - Other Western Europe (%)
Place of birth for the foreign-born population - Greece (%)
Place of birth for the foreign-born population - Italy (%)
Place of birth for the foreign-born population - Portugal (%)
Place of birth for the foreign-born population - Spain (%)
Place of birth for the foreign-born population - Other Southern Europe (%)
Place of birth for the foreign-born population - Albania (%)
Place of birth for the foreign-born population - Belarus (%)
Place of birth for the foreign-born population - Bosnia and Herzegovina (%)
Place of birth for the foreign-born population - Bulgaria (%)
Place of birth for the foreign-born population - Croatia (%)
Place of birth for the foreign-born population - Czechoslovakia (%)
Place of birth for the foreign-born population - Hungary (%)
Place of birth for the foreign-born population - Latvia (%)
Place of birth for the foreign-born population - Lithuania (%)
Place of birth for the foreign-born population - North Macedonia (Macedonia) (%)
Place of birth for the foreign-born population - Moldova (%)
Place of birth for the foreign-born population - Poland (%)
Place of birth for the foreign-born population - Romania (%)
Place of birth for the foreign-born population - Russia (%)
Place of birth for the foreign-born population - Serbia (%)
Place of birth for the foreign-born population - Ukraine (%)
Place of birth for the foreign-born population - Other Eastern Europe (%)
Place of birth for the foreign-born population - China (%)
Place of birth for the foreign-born population - Hong Kong (%)
Place of birth for the foreign-born population - Taiwan (%)
Place of birth for the foreign-born population - Japan (%)
Place of birth for the foreign-born population - Korea (%)
Place of birth for the foreign-born population - Other Eastern Asia (%)
Place of birth for the foreign-born population - Afghanistan (%)
Place of birth for the foreign-born population - Bangladesh (%)
Place of birth for the foreign-born population - India (%)
Place of birth for the foreign-born population - Iran (%)
Place of birth for the foreign-born population - Kazakhstan (%)
Place of birth for the foreign-born population - Nepal (%)
Place of birth for the foreign-born population - Pakistan (%)
Place of birth for the foreign-born population - Sri Lanka (%)
Place of birth for the foreign-born population - Uzbekistan (%)
Place of birth for the foreign-born population - Other South Central Asia (%)
Place of birth for the foreign-born population - Burma (%)
Place of birth for the foreign-born population - Cambodia (%)
Place of birth for the foreign-born population - Indonesia (%)
Place of birth for the foreign-born population - Laos (%)
Place of birth for the foreign-born population - Malaysia (%)
Place of birth for the foreign-born population - Philippines (%)
Place of birth for the foreign-born population - Singapore (%)
Place of birth for the foreign-born population - Thailand (%)
Place of birth for the foreign-born population - Vietnam (%)
Place of birth for the foreign-born population - Other South Eastern Asia (%)
Place of birth for the foreign-born population - Armenia (%)
Place of birth for the foreign-born population - Iraq (%)
Place of birth for the foreign-born population - Israel (%)
Place of birth for the foreign-born population - Jordan (%)
Place of birth for the foreign-born population - Kuwait (%)
Place of birth for the foreign-born population - Lebanon (%)
Place of birth for the foreign-born population - Saudi Arabia (%)
Place of birth for the foreign-born population - Syria (%)
Place of birth for the foreign-born population - Turkey (%)
Place of birth for the foreign-born population - Yemen (%)
Place of birth for the foreign-born population - Other Western Asia (%)
Place of birth for the foreign-born population - Eritrea (%)
Place of birth for the foreign-born population - Ethiopia (%)
Place of birth for the foreign-born population - Kenya (%)
Place of birth for the foreign-born population - Somalia (%)
Place of birth for the foreign-born population - Uganda (%)
Place of birth for the foreign-born population - Zimbabwe (%)
Place of birth for the foreign-born population - Other Eastern Africa (%)
Place of birth for the foreign-born population - Cameroon (%)
Place of birth for the foreign-born population - Congo (%)
Place of birth for the foreign-born population - Democratic Republic of Congo (Zaire) (%)
Place of birth for the foreign-born population - Other Middle Africa (%)
Place of birth for the foreign-born population - Egypt (%)
Place of birth for the foreign-born population - Morocco (%)
Place of birth for the foreign-born population - Sudan (%)
Place of birth for the foreign-born population - Other Northern Africa (%)
Place of birth for the foreign-born population - South Africa (%)
Place of birth for the foreign-born population - Other Southern Africa (%)
Place of birth for the foreign-born population - Cabo Verde (%)
Place of birth for the foreign-born population - Ghana (%)
Place of birth for the foreign-born population - Liberia (%)
Place of birth for the foreign-born population - Nigeria (%)
Place of birth for the foreign-born population - Senegal (%)
Place of birth for the foreign-born population - Sierra Leone (%)
Place of birth for the foreign-born population - Other Western Africa (%)
Place of birth for the foreign-born population - Australia (%)
Place of birth for the foreign-born population - New Zealand (%)
Place of birth for the foreign-born population - Fiji (%)
Place of birth for the foreign-born population - Micronesia (%)
Place of birth for the foreign-born population - Bahamas (%)
Place of birth for the foreign-born population - Barbados (%)
Place of birth for the foreign-born population - Cuba (%)
Place of birth for the foreign-born population - Dominica (%)
Place of birth for the foreign-born population - Dominican Republic (%)
Place of birth for the foreign-born population - Grenada (%)
Place of birth for the foreign-born population - Haiti (%)
Place of birth for the foreign-born population - Jamaica (%)
Place of birth for the foreign-born population - St. Vincent and the Grenadines (%)
Place of birth for the foreign-born population - Trinidad and Tobago (%)
Place of birth for the foreign-born population - West Indies (%)
Place of birth for the foreign-born population - Other Caribbean (%)
Place of birth for the foreign-born population - Belize (%)
Place of birth for the foreign-born population - Costa Rica (%)
Place of birth for the foreign-born population - El Salvador (%)
Place of birth for the foreign-born population - Guatemala (%)
Place of birth for the foreign-born population - Honduras (%)
Place of birth for the foreign-born population - Mexico (%)
Place of birth for the foreign-born population - Nicaragua (%)
Place of birth for the foreign-born population - Panama (%)
Place of birth for the foreign-born population - Other Central America (%)
Place of birth for the foreign-born population - Argentina (%)
Place of birth for the foreign-born population - Bolivia (%)
Place of birth for the foreign-born population - Brazil (%)
Place of birth for the foreign-born population - Chile (%)
Place of birth for the foreign-born population - Colombia (%)
Place of birth for the foreign-born population - Ecuador (%)
Place of birth for the foreign-born population - Guyana (%)
Place of birth for the foreign-born population - Peru (%)
Place of birth for the foreign-born population - Uruguay (%)
Place of birth for the foreign-born population - Venezuela (%)
Place of birth for the foreign-born population - Other South America (%)
Place of birth for the foreign-born population - Canada (%)
Place of birth for the foreign-born population - Other Northern America (%)
Place of birth for the foreign-born population - Other (%)
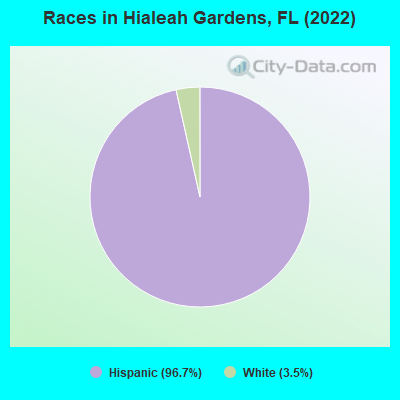
According to 2022 data, the most numerous races in Hialeah Gardens, FL are White alone (790 residents), Hispanic (21,949 residents), and Black alone (22 residents). 6.7% of Hialeah Gardens residents speak English at home. 71.2% of Hialeah Gardens, FL residents are foreign-born (70.6% born in Latin America), which is 70.5% greater than the foreign-born rate of 21.0% across the entire state of Florida.
Race distribution in Hialeah Gardens
2000 2022
10,458,509 65.4% White alone 2,682,715 16.8% Hispanic 2,264,268 14.2% Black alone 261,693 1.6% Asian alone 236,954 1.5% Two or more races 42,358 0.3% American Indian alone 28,994 0.2% Other race alone 6,887 0.04% Native Hawaiian and Other
11,309,403 50.8% White alone 6,025,039 27.1% Hispanic 3,241,015 14.6% Black alone 861,630 3.9% Two or more races 623,692 2.8% Asian alone 152,054 0.7% Other race alone 22,504 0.1% American Indian alone 9,486 0.04% Native Hawaiian and Other
Income and house value in Hialeah Gardens Median household income in 2022 $75,307 White non-Hispanic householders$36,718 Black householders$66,210 Some other race householders$61,756 Two or more races householders$60,005 Hispanic or Latino race householdersMedian 2022 house value $352,439 White Non-Hispanic householders$361,435 Black or African American householders$348,905 Some other race householders$360,792 Two or more races householders$364,005 Hispanic or Latino householders
Median age by race in Hialeah Gardens
39.8 Median age for White residents36.6 42.4 49.5 Median age for Black or African American residents49.4 52.5 -653,446,647.1 Median age for American Indian / Alaska Native residents-543,352,600.6 -762,696,213.5 -673,333,332.7 Median age for Asian residents-697,674,417.9 -653,626,731.2 -679,849,340.2 Median age for Native Hawaiian / Pacific Islander residents-858,307,848.3 -443,298,968.6 47.6 Median age for Other race residents43.6 50.9 43.8 Median age for Two or more races residents42.3 46.6 21.2 Median age for White alone residents27.4 16.9 44.7 Median age for Hispanic or Latino residents41.3 48.0
Owner/renter occupied households by race in Hialeah Gardens
House owners and renters - White residents 1,270 66.0% Owner occupied654 34.0% Renter occupiedHouse owners and renters - Black or African American residents 35 53.3% Owner occupied31 46.7% Renter occupiedHouse owners and renters - Asian residents 8 100.0% Owner occupiedHouse owners and renters - Other race residents 601 63.3% Owner occupied348 36.7% Renter occupiedHouse owners and renters - Two or more races residents 3,535 61.2% Owner occupied2,244 38.8% Renter occupiedHouse owners and renters - White alone residents 86 71.3% Owner occupied35 28.7% Renter occupiedHouse owners and renters - Hispanic or Latino residents 4,703 62.7% Owner occupied2,801 37.3% Renter occupied
Language usage in Hialeah Gardens
English speakers - Total 6.7% of residents of Hialeah Gardens speak English at home.
93.4% of residents speak Spanish at home 8,599 42.4% Speak English very well11,697 57.6% Speak English less than very well
English speakers - Born in the United States 27.3% of residents of Hialeah Gardens speak English at home.
71.4% of residents speak Spanish at home 508 84.1% Speak English very well96 15.9% Speak English less than very well
English speakers - Native, born elsewhere 8.6% of residents of Hialeah Gardens speak English at home.
87.5% of residents speak Spanish at home 147 72.4% Speak English very well56 27.6% Speak English less than very well
English speakers - Foreign-born 3.9% of residents of Hialeah Gardens speak English at home.
96.4% of residents speak Spanish at home 4,284 27.6% Speak English very well11,233 72.4% Speak English less than very well
White (Caucasian) - Speak only English Native:
22.4% (541)Foreign-born:
7.4% (222)
White (Caucasian) - Speak another language Native:
66.2% (1,597)Foreign-born:
91.8% (2,744)
Black or African American - Speak only English Native:
41.4% (27)Foreign-born:
13.2% (17)
Black or African American - Speak another language Native:
58.5% (38)Foreign-born:
85.2% (110)
Other race - Speak only English Native:
8.6% (38)Foreign-born:
1.6% (32)
Other race - Speak another language Native:
91.3% (401)Foreign-born:
98.5% (1,946)
Two or more races - Speak only English Native:
9.9% (319)Foreign-born:
3.2% (393)
Two or more races - Speak another language Native:
90.3% (2,895)Foreign-born:
96.6% (11,840)
White alone - Speak only English Native:
53.8% (364)Foreign-born:
57.0% (20)
White alone - Speak another language Native:
44.8% (303)Foreign-born:
50.6% (18)
Hispanic or Latino - Speak only English Native:
9.7% (485)Foreign-born:
3.8% (612)
Hispanic or Latino - Speak another language Native:
90.0% (4,493)Foreign-born:
96.2% (15,444)
Foreign-born residents in Hialeah Gardens 16,156 residents are foreign born (70.6% Latin America ).
This city:
71.2%Florida:
21.1%
Marital status for residents in Hialeah Gardens Marital status - White (Caucasian) population 15 years and over
Males 40.5% Never married47.8% Now married1.2% Separated3.0% Widowed7.4% DivorcedFemales 30.6% Never married41.4% Now married3.5% Separated9.4% Widowed15.2% DivorcedWomen who gave birth in the past 12 months Now married:
39.8% (27)Unmarried:
60.2% (40)
Women who did not give birth in the past 12 months Now married:
40.5% (506)Unmarried:
59.5% (744)
Marital status - Black or African American population 15 years and over
Males 31.8% Never married63.6% Now married0.0% Separated0.0% Widowed4.5% DivorcedFemales 38.1% Never married30.1% Now married0.0% Separated6.2% Widowed25.7% DivorcedWomen who did not give birth in the past 12 months Now married:
0.0% (0)Unmarried:
100.0% (38)
Marital status - Other race population 15 years and over
Males 29.2% Never married34.0% Now married1.9% Separated0.5% Widowed34.5% DivorcedFemales 24.7% Never married44.1% Now married4.0% Separated16.9% Widowed10.3% DivorcedWomen who gave birth in the past 12 months Now married:
0.0% (0)Unmarried:
100.0% (63)
Women who did not give birth in the past 12 months Now married:
36.2% (134)Unmarried:
63.8% (236)
Marital status - Two or more races population 15 years and over
Males 41.3% Never married44.9% Now married3.7% Separated1.3% Widowed8.8% DivorcedFemales 29.9% Never married39.6% Now married4.1% Separated7.9% Widowed18.5% DivorcedWomen who gave birth in the past 12 months Now married:
100.0% (40)Unmarried:
0.0% (0)
Women who did not give birth in the past 12 months Now married:
37.4% (1,312)Unmarried:
62.6% (2,196)
Marital status - White alone, not Hispanic / Latino population 15 years and over
Males 13.0% Never married65.9% Now married7.2% Separated4.9% Widowed9.0% DivorcedFemales 36.6% Never married43.4% Now married0.0% Separated11.7% Widowed8.3% DivorcedWomen who gave birth in the past 12 months Now married:
100.0% (30)Unmarried:
0.0% (0)
Women who did not give birth in the past 12 months Now married:
37.2% (62)Unmarried:
62.8% (104)
Marital status - Hispanic or Latino population 15 years and over
Males 40.5% Never married45.0% Now married2.2% Separated2.0% Widowed10.2% DivorcedFemales 29.7% Never married40.6% Now married3.8% Separated9.2% Widowed16.7% DivorcedWomen who gave birth in the past 12 months Now married:
26.5% (42)Unmarried:
73.5% (116)
Women who did not give birth in the past 12 months Now married:
38.6% (1,733)Unmarried:
61.4% (2,759)
Ancestries in Hialeah Gardens
95 0.6% Irish76 0.5% French60 0.4% American36 0.2% African34 0.2% Lebanese32 0.2% Italian16 0.10% European15 0.09% German12 0.07% Israeli6 0.04% Haitian
Children Nativity (place of birth) in Hialeah Gardens
Children under 6 years - Living with two parents Both parents native 38 100.0% NativeBoth parents foreign-born 204 92.6% Native16 7.4% Foreign-bornOne native, one foreign-born parent 114 100.0% NativeChildren under 6 years - Living with one parent Native parent 185 98.6% Native3 1.4% Foreign-bornForeign-born parent 619 91.8% Native55 8.2% Foreign-bornChildren 6 to 17 years - Living with two parents Both parents native 259 99.5% Native1 0.5% Foreign-bornBoth parents foreign-born 733 65.3% Native390 34.7% Foreign-bornOne native, one foreign-born parent 131 85.7% Native22 14.3% Foreign-bornChildren 6 to 17 years - Living with one parent Foreign-born parent 945 56.6% Native725 43.4% Foreign-born
Grandparents responsible for own grandchildren in Hialeah Gardens
Grandparents (30 to 59 years) White / Caucasian 69 100.0% Not responsible for grandchildrenOther race 11 100.0% Not responsible for grandchildrenTwo or more races 336 64.1% Responsible for grandchildren189 35.9% Not responsible for grandchildrenHispanic or Latino 178 45.3% Responsible for grandchildren215 54.7% Not responsible for grandchildrenGrandparents (60 years and over) White / Caucasian 143 100.0% Not responsible for grandchildrenOther race 69 100.0% Not responsible for grandchildrenTwo or more races 36 13.0% Responsible for grandchildren244 87.0% Not responsible for grandchildrenHispanic or Latino 28 6.2% Responsible for grandchildren421 93.8% Not responsible for grandchildren