Races in Hardeeville, South Carolina (SC) Detailed Stats
Data:
Races - White alone (%)
Races - White alone (% change since 2000)
Races - Black alone (%)
Races - Black alone (% change since 2000)
Races - American Indian alone (%)
Races - American Indian alone (% change since 2000)
Races - Asian alone (%)
Races - Asian alone (% change since 2000)
Races - Hispanic (%)
Races - Hispanic (% change since 2000)
Races - Native Hawaiian and Other Pacific Islander alone (%)
Races - Native Hawaiian and Other Pacific Islander alone (% change since 2000)
Races - Two or more races(%)
Races - Two or more races(% change since 2000)
Races - Other race alone (%)
Races - Other race alone (% change since 2000)
Racial diversity
Place of birth - Born in state of residence (%)
Place of birth - Born in state of residence (%) - White
Place of birth - Born in state of residence (%) - Black or African American
Place of birth - Born in state of residence (%) - Asian
Place of birth - Born in state of residence (%) - Hispanic or Latino
Place of birth - Born in state of residence (%) - American Indian and Alaska Native
Place of birth - Born in state of residence (%) - Multirace
Place of birth - Born in state of residence (%) - Other Race
Place of birth - Born in other state (%)
Place of birth - Born in other state (%) - White
Place of birth - Born in other state (%) - Black or African American
Place of birth - Born in other state (%) - Asian
Place of birth - Born in other state (%) - Hispanic or Latino
Place of birth - Born in other state (%) - American Indian and Alaska Native
Place of birth - Born in other state (%) - Multirace
Place of birth - Born in other state (%) - Other Race
Place of birth - Native, outside of US (%)
Place of birth - Native, outside of US (%) - White
Place of birth - Native, outside of US (%) - Black or African American
Place of birth - Native, outside of US (%) - Asian
Place of birth - Native, outside of US (%) - Hispanic or Latino
Place of birth - Native, outside of US (%) - American Indian and Alaska Native
Place of birth - Native, outside of US (%) - Multirace
Place of birth - Native, outside of US (%) - Other Race
Place of birth - Foreign born (%)
Place of birth - Foreign born (%) - White
Place of birth - Foreign born (%) - Black or African American
Place of birth - Foreign born (%) - Asian
Place of birth - Foreign born (%) - Hispanic or Latino
Place of birth - Foreign born (%) - American Indian and Alaska Native
Place of birth - Foreign born (%) - Multirace
Place of birth - Foreign born (%) - Other Race
Residents speaking English at home (%)
Residents speaking English at home - Born in the United States (%)
Residents speaking English at home - Native, born elsewhere (%)
Residents speaking English at home - Foreign born (%)
Residents speaking Spanish at home (%)
Residents speaking Spanish at home - Born in the United States (%)
Residents speaking Spanish at home - Native, born elsewhere (%)
Residents speaking Spanish at home - Foreign born (%)
Residents speaking other language at home (%)
Residents speaking other language at home - Born in the United States (%)
Residents speaking other language at home - Native, born elsewhere (%)
Residents speaking other language at home - Foreign born (%)
Marital status - Never married (%)
Marital status - Now married (%)
Marital status - Separated (%)
Marital status - Widowed (%)
Marital status - Divorced (%)
Ancestries Reported - Arab (%)
Ancestries Reported - Czech (%)
Ancestries Reported - Danish (%)
Ancestries Reported - Dutch (%)
Ancestries Reported - English (%)
Ancestries Reported - French (%)
Ancestries Reported - French Canadian (%)
Ancestries Reported - German (%)
Ancestries Reported - Greek (%)
Ancestries Reported - Hungarian (%)
Ancestries Reported - Irish (%)
Ancestries Reported - Italian (%)
Ancestries Reported - Lithuanian (%)
Ancestries Reported - Norwegian (%)
Ancestries Reported - Polish (%)
Ancestries Reported - Portuguese (%)
Ancestries Reported - Russian (%)
Ancestries Reported - Scotch-Irish (%)
Ancestries Reported - Scottish (%)
Ancestries Reported - Slovak (%)
Ancestries Reported - Subsaharan African (%)
Ancestries Reported - Swedish (%)
Ancestries Reported - Swiss (%)
Ancestries Reported - Ukrainian (%)
Ancestries Reported - United States (%)
Ancestries Reported - Welsh (%)
Ancestries Reported - West Indian (%)
Ancestries Reported - Other (%)
Geographical mobility - Same house 1 year ago (%)
Geographical mobility - Same house 1 year ago (%) - White
Geographical mobility - Same house 1 year ago (%) - Black or African American
Geographical mobility - Same house 1 year ago (%) - Asian
Geographical mobility - Same house 1 year ago (%) - Hispanic or Latino
Geographical mobility - Same house 1 year ago (%) - American Indian and Alaska Native
Geographical mobility - Same house 1 year ago (%) - Multirace
Geographical mobility - Same house 1 year ago (%) - Other Race
Geographical mobility - Moved within same county (%)
Geographical mobility - Moved within same county (%) - White
Geographical mobility - Moved within same county (%) - Black or African American
Geographical mobility - Moved within same county (%) - Asian
Geographical mobility - Moved within same county (%) - Hispanic or Latino
Geographical mobility - Moved within same county (%) - American Indian and Alaska Native
Geographical mobility - Moved within same county (%) - Multirace
Geographical mobility - Moved within same county (%) - Other Race
Geographical mobility - Moved from different county within same state (%)
Geographical mobility - Moved from different county within same state (%) - White
Geographical mobility - Moved from different county within same state (%) - Black or African American
Geographical mobility - Moved from different county within same state (%) - Asian
Geographical mobility - Moved from different county within same state (%) - Hispanic or Latino
Geographical mobility - Moved from different county within same state (%) - American Indian and Alaska Native
Geographical mobility - Moved from different county within same state (%) - Multirace
Geographical mobility - Moved from different county within same state (%) - Other Race
Geographical mobility - Moved from different state (%)
Geographical mobility - Moved from different state (%) - White
Geographical mobility - Moved from different state (%) - Black or African American
Geographical mobility - Moved from different state (%) - Asian
Geographical mobility - Moved from different state (%) - Hispanic or Latino
Geographical mobility - Moved from different state (%) - American Indian and Alaska Native
Geographical mobility - Moved from different state (%) - Multirace
Geographical mobility - Moved from different state (%) - Other Race
Geographical mobility - Moved from abroad (%)
Geographical mobility - Moved from abroad (%) - White
Geographical mobility - Moved from abroad (%) - Black or African American
Geographical mobility - Moved from abroad (%) - Asian
Geographical mobility - Moved from abroad (%) - Hispanic or Latino
Geographical mobility - Moved from abroad (%) - American Indian and Alaska Native
Geographical mobility - Moved from abroad (%) - Multirace
Geographical mobility - Moved from abroad (%) - Other Race
Place of birth for the foreign-born population - Ireland (%)
Place of birth for the foreign-born population - Denmark (%)
Place of birth for the foreign-born population - Norway (%)
Place of birth for the foreign-born population - Sweden (%)
Place of birth for the foreign-born population - United Kingdom (%)
Place of birth for the foreign-born population - England (%)
Place of birth for the foreign-born population - Scotland (%)
Place of birth for the foreign-born population - Other Northern Europe (%)
Place of birth for the foreign-born population - Austria (%)
Place of birth for the foreign-born population - Belgium (%)
Place of birth for the foreign-born population - France (%)
Place of birth for the foreign-born population - Germany (%)
Place of birth for the foreign-born population - Netherlands (%)
Place of birth for the foreign-born population - Switzerland (%)
Place of birth for the foreign-born population - Other Western Europe (%)
Place of birth for the foreign-born population - Greece (%)
Place of birth for the foreign-born population - Italy (%)
Place of birth for the foreign-born population - Portugal (%)
Place of birth for the foreign-born population - Spain (%)
Place of birth for the foreign-born population - Other Southern Europe (%)
Place of birth for the foreign-born population - Albania (%)
Place of birth for the foreign-born population - Belarus (%)
Place of birth for the foreign-born population - Bosnia and Herzegovina (%)
Place of birth for the foreign-born population - Bulgaria (%)
Place of birth for the foreign-born population - Croatia (%)
Place of birth for the foreign-born population - Czechoslovakia (%)
Place of birth for the foreign-born population - Hungary (%)
Place of birth for the foreign-born population - Latvia (%)
Place of birth for the foreign-born population - Lithuania (%)
Place of birth for the foreign-born population - North Macedonia (Macedonia) (%)
Place of birth for the foreign-born population - Moldova (%)
Place of birth for the foreign-born population - Poland (%)
Place of birth for the foreign-born population - Romania (%)
Place of birth for the foreign-born population - Russia (%)
Place of birth for the foreign-born population - Serbia (%)
Place of birth for the foreign-born population - Ukraine (%)
Place of birth for the foreign-born population - Other Eastern Europe (%)
Place of birth for the foreign-born population - China (%)
Place of birth for the foreign-born population - Hong Kong (%)
Place of birth for the foreign-born population - Taiwan (%)
Place of birth for the foreign-born population - Japan (%)
Place of birth for the foreign-born population - Korea (%)
Place of birth for the foreign-born population - Other Eastern Asia (%)
Place of birth for the foreign-born population - Afghanistan (%)
Place of birth for the foreign-born population - Bangladesh (%)
Place of birth for the foreign-born population - India (%)
Place of birth for the foreign-born population - Iran (%)
Place of birth for the foreign-born population - Kazakhstan (%)
Place of birth for the foreign-born population - Nepal (%)
Place of birth for the foreign-born population - Pakistan (%)
Place of birth for the foreign-born population - Sri Lanka (%)
Place of birth for the foreign-born population - Uzbekistan (%)
Place of birth for the foreign-born population - Other South Central Asia (%)
Place of birth for the foreign-born population - Burma (%)
Place of birth for the foreign-born population - Cambodia (%)
Place of birth for the foreign-born population - Indonesia (%)
Place of birth for the foreign-born population - Laos (%)
Place of birth for the foreign-born population - Malaysia (%)
Place of birth for the foreign-born population - Philippines (%)
Place of birth for the foreign-born population - Singapore (%)
Place of birth for the foreign-born population - Thailand (%)
Place of birth for the foreign-born population - Vietnam (%)
Place of birth for the foreign-born population - Other South Eastern Asia (%)
Place of birth for the foreign-born population - Armenia (%)
Place of birth for the foreign-born population - Iraq (%)
Place of birth for the foreign-born population - Israel (%)
Place of birth for the foreign-born population - Jordan (%)
Place of birth for the foreign-born population - Kuwait (%)
Place of birth for the foreign-born population - Lebanon (%)
Place of birth for the foreign-born population - Saudi Arabia (%)
Place of birth for the foreign-born population - Syria (%)
Place of birth for the foreign-born population - Turkey (%)
Place of birth for the foreign-born population - Yemen (%)
Place of birth for the foreign-born population - Other Western Asia (%)
Place of birth for the foreign-born population - Eritrea (%)
Place of birth for the foreign-born population - Ethiopia (%)
Place of birth for the foreign-born population - Kenya (%)
Place of birth for the foreign-born population - Somalia (%)
Place of birth for the foreign-born population - Uganda (%)
Place of birth for the foreign-born population - Zimbabwe (%)
Place of birth for the foreign-born population - Other Eastern Africa (%)
Place of birth for the foreign-born population - Cameroon (%)
Place of birth for the foreign-born population - Congo (%)
Place of birth for the foreign-born population - Democratic Republic of Congo (Zaire) (%)
Place of birth for the foreign-born population - Other Middle Africa (%)
Place of birth for the foreign-born population - Egypt (%)
Place of birth for the foreign-born population - Morocco (%)
Place of birth for the foreign-born population - Sudan (%)
Place of birth for the foreign-born population - Other Northern Africa (%)
Place of birth for the foreign-born population - South Africa (%)
Place of birth for the foreign-born population - Other Southern Africa (%)
Place of birth for the foreign-born population - Cabo Verde (%)
Place of birth for the foreign-born population - Ghana (%)
Place of birth for the foreign-born population - Liberia (%)
Place of birth for the foreign-born population - Nigeria (%)
Place of birth for the foreign-born population - Senegal (%)
Place of birth for the foreign-born population - Sierra Leone (%)
Place of birth for the foreign-born population - Other Western Africa (%)
Place of birth for the foreign-born population - Australia (%)
Place of birth for the foreign-born population - New Zealand (%)
Place of birth for the foreign-born population - Fiji (%)
Place of birth for the foreign-born population - Micronesia (%)
Place of birth for the foreign-born population - Bahamas (%)
Place of birth for the foreign-born population - Barbados (%)
Place of birth for the foreign-born population - Cuba (%)
Place of birth for the foreign-born population - Dominica (%)
Place of birth for the foreign-born population - Dominican Republic (%)
Place of birth for the foreign-born population - Grenada (%)
Place of birth for the foreign-born population - Haiti (%)
Place of birth for the foreign-born population - Jamaica (%)
Place of birth for the foreign-born population - St. Vincent and the Grenadines (%)
Place of birth for the foreign-born population - Trinidad and Tobago (%)
Place of birth for the foreign-born population - West Indies (%)
Place of birth for the foreign-born population - Other Caribbean (%)
Place of birth for the foreign-born population - Belize (%)
Place of birth for the foreign-born population - Costa Rica (%)
Place of birth for the foreign-born population - El Salvador (%)
Place of birth for the foreign-born population - Guatemala (%)
Place of birth for the foreign-born population - Honduras (%)
Place of birth for the foreign-born population - Mexico (%)
Place of birth for the foreign-born population - Nicaragua (%)
Place of birth for the foreign-born population - Panama (%)
Place of birth for the foreign-born population - Other Central America (%)
Place of birth for the foreign-born population - Argentina (%)
Place of birth for the foreign-born population - Bolivia (%)
Place of birth for the foreign-born population - Brazil (%)
Place of birth for the foreign-born population - Chile (%)
Place of birth for the foreign-born population - Colombia (%)
Place of birth for the foreign-born population - Ecuador (%)
Place of birth for the foreign-born population - Guyana (%)
Place of birth for the foreign-born population - Peru (%)
Place of birth for the foreign-born population - Uruguay (%)
Place of birth for the foreign-born population - Venezuela (%)
Place of birth for the foreign-born population - Other South America (%)
Place of birth for the foreign-born population - Canada (%)
Place of birth for the foreign-born population - Other Northern America (%)
Place of birth for the foreign-born population - Other (%)
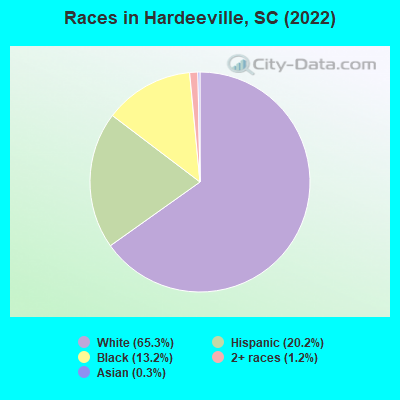
According to 2022 data, the most numerous races in Hardeeville, SC are White alone (5,397 residents), Black alone (1,089 residents), and Hispanic (1,669 residents). 80.5% of Hardeeville residents speak English at home. 14.3% of Hardeeville, SC residents are foreign-born (10.6% born in Latin America, 3.0% born in Europe), which is 65.0% greater than the foreign-born rate of 5.0% across the entire state of South Carolina.
Race distribution in Hardeeville
2000 2022
2,652,291 66.1% White alone 1,178,486 29.4% Black alone 95,076 2.4% Hispanic 35,568 0.9% Asian alone 33,290 0.8% Two or more races 12,765 0.3% American Indian alone 3,266 0.08% Other race alone 1,270 0.03% Native Hawaiian and Other
3,301,739 62.5% White alone 1,313,290 24.9% Black alone 343,783 6.5% Hispanic 190,508 3.6% Two or more races 89,888 1.7% Asian alone 29,390 0.6% Other race alone 12,112 0.2% American Indian alone 1,924 0.04% Native Hawaiian and Other
Income and house value in Hardeeville Median household income in 2022 $88,634 White non-Hispanic householders$47,873 Black householders$95,793 Two or more races householders$101,905 Hispanic or Latino race householdersMedian 2022 house value $608,849 White Non-Hispanic householders$457,368 Black or African American householders$622,021 American Indian or Alaska Native householders $475,663 Asian householders$499,812 Some other race householders$463,223 Hispanic or Latino householders
Median age by race in Hardeeville
65.3 Median age for White residents64.8 65.6 59.9 Median age for Black or African American residents56.5 61.2 -626,702,996.6 Median age for American Indian / Alaska Native residents-583,333,332.8 -659,400,544.3 -704,301,074.6 Median age for Asian residents-720,616,569.6 -688,832,053.9 -698,412,697.7 Median age for Native Hawaiian / Pacific Islander residents-551,574,375.1 -1,016,109,044.8 26.4 Median age for Other race residents20.8 28.7 41.0 Median age for Two or more races residents40.2 35.5 65.5 Median age for White alone residents65.3 65.8 31.2 Median age for Hispanic or Latino residents34.7 30.4
Owner/renter occupied households by race in Hardeeville
House owners and renters - White residents 2,680 82.4% Owner occupied571 17.6% Renter occupiedHouse owners and renters - Black or African American residents 410 65.5% Owner occupied216 34.5% Renter occupiedHouse owners and renters - Other race residents 26 30.9% Owner occupied59 69.1% Renter occupiedHouse owners and renters - Two or more races residents 145 30.3% Owner occupied332 69.7% Renter occupiedHouse owners and renters - White alone residents 2,643 83.2% Owner occupied534 16.8% Renter occupiedHouse owners and renters - Hispanic or Latino residents 172 34.6% Owner occupied324 65.4% Renter occupied
Language usage in Hardeeville
English speakers - Total 80.5% of residents of Hardeeville speak English at home.
15.9% of residents speak Spanish at home 743 58.6% Speak English very well525 41.4% Speak English less than very well3.7% of residents speak other language at home 265 90.1% Speak English very well29 9.9% Speak English less than very well
English speakers - Born in the United States 95.6% of residents of Hardeeville speak English at home.
1.3% of residents speak Spanish at home 67 100.0% Speak English very well3.1% of residents speak other language at home 157 100.0% Speak English very well
English speakers - Native, born elsewhere 38.4% of residents of Hardeeville speak English at home.
69.0% of residents speak Spanish at home 178 100.0% Speak English very well
English speakers - Foreign-born 21.4% of residents of Hardeeville speak English at home.
66.3% of residents speak Spanish at home 238 32.3% Speak English very well499 67.7% Speak English less than very well9.3% of residents speak other language at home 74 71.8% Speak English very well29 28.2% Speak English less than very well
White (Caucasian) - Speak only English Native:
95.2% (4,919)Foreign-born:
45.0% (158)
White (Caucasian) - Speak another language Native:
4.3% (221)Foreign-born:
55.7% (195)
Black or African American - Speak only English Native:
99.8% (999)Foreign-born:
68.5% (62)
Other race - Speak another language Native:
91.7% (182)Foreign-born:
98.6% (79)
Two or more races - Speak another language Native:
60.0% (341)Foreign-born:
100.0% (693)
White alone - Speak only English Native:
95.8% (4,927)Foreign-born:
57.7% (108)
White alone - Speak another language Native:
4.2% (216)Foreign-born:
42.8% (80)
Hispanic or Latino - Speak only English Native:
21.1% (129)Foreign-born:
6.2% (48)
Hispanic or Latino - Speak another language Native:
74.8% (458)Foreign-born:
93.9% (734)
Foreign-born residents in Hardeeville 1,181 residents are foreign born (10.6% Latin America , 3.0% Europe ).
This city:
14.3%South Carolina:
5.3%
Marital status for residents in Hardeeville Marital status - White (Caucasian) population 15 years and over
Males 10.7% Never married70.9% Now married0.0% Separated2.9% Widowed15.5% DivorcedFemales 6.1% Never married67.6% Now married0.0% Separated15.6% Widowed10.7% DivorcedWomen who gave birth in the past 12 months Now married:
100.0% (53)Unmarried:
0.0% (0)
Women who did not give birth in the past 12 months Now married:
58.3% (278)Unmarried:
41.7% (198)
Marital status - Black or African American population 15 years and over
Males 14.2% Never married45.2% Now married35.1% Separated0.0% Widowed5.5% DivorcedFemales 20.7% Never married46.7% Now married0.0% Separated2.7% Widowed29.9% DivorcedWomen who did not give birth in the past 12 months Now married:
0.0% (0)Unmarried:
100.0% (68)
Marital status - Other race population 15 years and over
Males 37.4% Never married62.6% Now married0.0% Separated0.0% Widowed0.0% DivorcedFemales 14.1% Never married85.9% Now married0.0% Separated0.0% Widowed0.0% DivorcedWomen who gave birth in the past 12 months Now married:
100.0% (34)Unmarried:
0.0% (0)
Women who did not give birth in the past 12 months Now married:
71.7% (45)Unmarried:
28.3% (18)
Marital status - Two or more races population 15 years and over
Males 74.8% Never married25.2% Now married0.0% Separated0.0% Widowed0.0% DivorcedFemales 47.5% Never married43.1% Now married0.0% Separated7.7% Widowed1.7% DivorcedWomen who gave birth in the past 12 months Now married:
100.0% (34)Unmarried:
0.0% (0)
Women who did not give birth in the past 12 months Now married:
10.4% (27)Unmarried:
89.6% (231)
Marital status - White alone, not Hispanic / Latino population 15 years and over
Males 10.6% Never married72.4% Now married0.0% Separated3.1% Widowed13.9% DivorcedFemales 6.4% Never married69.0% Now married0.0% Separated15.4% Widowed9.2% DivorcedWomen who gave birth in the past 12 months Now married:
100.0% (53)Unmarried:
0.0% (0)
Women who did not give birth in the past 12 months Now married:
61.9% (251)Unmarried:
38.1% (154)
Marital status - Hispanic or Latino population 15 years and over
Males 52.5% Never married37.4% Now married0.0% Separated0.0% Widowed10.1% DivorcedFemales 29.6% Never married56.2% Now married0.0% Separated4.2% Widowed9.9% DivorcedWomen who gave birth in the past 12 months Now married:
100.0% (56)Unmarried:
0.0% (0)
Women who did not give birth in the past 12 months Now married:
31.0% (94)Unmarried:
69.0% (209)
Ancestries in Hardeeville
567 11.4% German521 10.5% Irish404 8.1% American383 7.7% Italian363 7.3% English137 2.8% French Canadian114 2.3% Polish100 2.0% French96 1.9% Ukrainian45 0.9% Canadian43 0.9% Lebanese36 0.7% Hungarian34 0.7% Scotch-Irish33 0.7% Norwegian32 0.6% Eastern European32 0.6% Romanian32 0.6% Swiss27 0.5% Dutch19 0.4% British17 0.3% Swedish15 0.3% Armenian15 0.3% Austrian14 0.3% Celtic13 0.3% European12 0.2% Russian11 0.2% Scandinavian10 0.2% Scottish
Children Nativity (place of birth) in Hardeeville
Children under 6 years - Living with two parents Both parents native 75 100.0% NativeBoth parents foreign-born 23 100.0% NativeOne native, one foreign-born parent 35 100.0% NativeChildren under 6 years - Living with one parent Native parent 13 100.0% NativeForeign-born parent 23 100.0% NativeChildren 6 to 17 years - Living with two parents Both parents native 85 100.0% NativeBoth parents foreign-born 47 100.0% NativeChildren 6 to 17 years - Living with one parent Native parent 99 100.0% NativeForeign-born parent 33 49.6% Native34 50.4% Foreign-born
Grandparents responsible for own grandchildren in Hardeeville
Grandparents (30 to 59 years) White / Caucasian 19 100.0% Responsible for grandchildrenOther race 20 100.0% Not responsible for grandchildrenTwo or more races 90 100.0% Responsible for grandchildrenWhite alone, not Hispanic / Latino 19 100.0% Responsible for grandchildrenHispanic or Latino 79 76.2% Responsible for grandchildren25 23.8% Not responsible for grandchildren
Grandparents (60 years and over) White / Caucasian 25 100.0% Responsible for grandchildrenWhite alone, not Hispanic / Latino 25 100.0% Responsible for grandchildren