Races in Grafton, New Hampshire (NH) Detailed Stats
Ancestries, Foreign-born residents, place of birth

Recent posts about races in Grafton, New Hampshire on our local forum with over 2,400,000 registered users:
 | Tiny house living possible in NH? (18 replies) |
| Why Isn't NH Population Booming? (110 replies) |
| Possible Relocation to New Hampshire (30 replies) |
| Current Political vibe in New Hampshire (8 replies) |
| Ranches, Raised Ranches and Split level homes in the Granite State? State? (26 replies) |
| Septic system cost Plymouth area? (2 replies) |
2.5% of Grafton, NH residents are foreign-born (1.1% born in Europe, 0.9% born in North America, 0.4% born in Oceania), which is 96.2% less than the foreign-born rate of 5.0% across the entire state of New Hampshire.
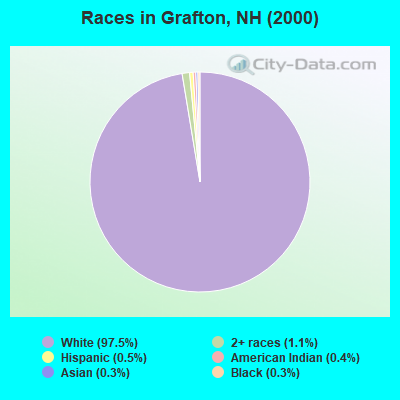
Race distribution in Grafton

- 1,11097.5%White alone
- 121.1%Two or more races
- 60.5%Hispanic
- 40.4%American Indian alone
- 30.3%Asian alone
- 30.3%Black alone
2000
2022
-
- 1,175,25295.1%White alone
- 20,4891.7%Hispanic
- 15,8031.3%Asian alone
- 11,6060.9%Two or more races
- 8,3540.7%Black alone
- 2,6980.2%American Indian alone
- 1,2540.1%Other race alone
- 3300.03%Native Hawaiian and Other
Pacific Islander alone

-
- 1,208,10186.6%White alone
- 63,4794.5%Hispanic
- 60,7244.4%Two or more races
- 36,5192.6%Asian alone
- 17,9311.3%Black alone
- 6,6150.5%Other race alone
- 1,0140.07%American Indian alone
- 8480.06%Native Hawaiian and Other
Pacific Islander alone

Income and house value in Grafton
- Median household income in 2022
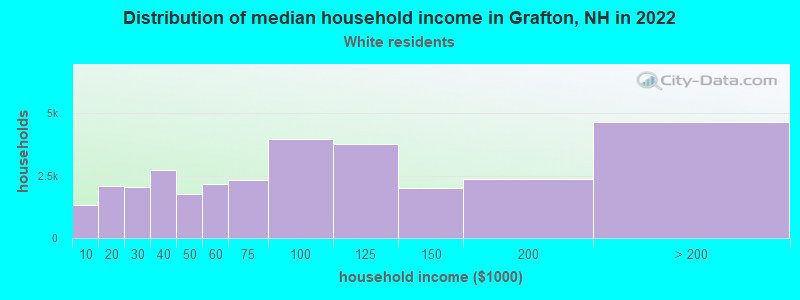
- $74,085White non-Hispanic householders
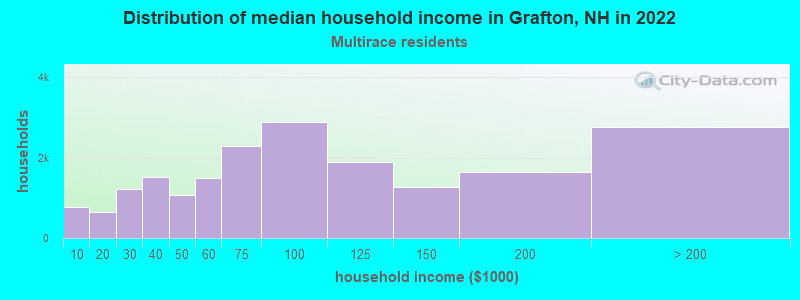
- $170,401Two or more races householders
- Median 2022 house value
- $259,853White Non-Hispanic householders
Household income for White non-Hispanic householders
Household income for Two or more races householders
Foreign-born residents in Grafton
29 residents are foreign born (1.1% Europe, 0.9% North America, 0.4% Oceania).
| This city: | 2.5% |
| New Hampshire: | 4.4% |
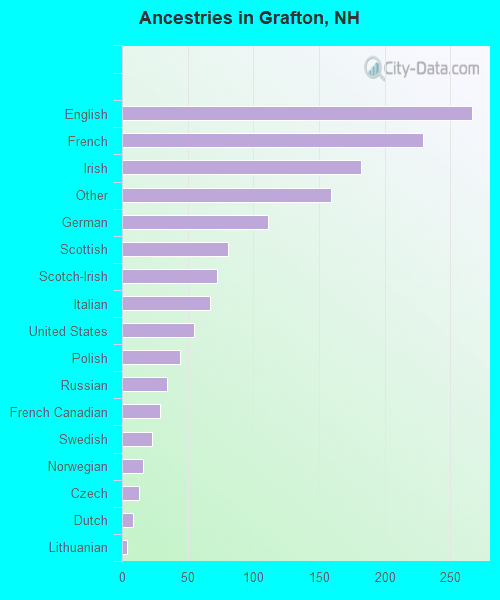
Ancestries in Grafton

- 26619.0%English
- 22916.3%French
- 18213.0%Irish
- 15911.3%Other
- 1117.9%German
- 815.8%Scottish
- 725.1%Scotch-Irish
- 674.8%Italian
- 553.9%United States
- 443.1%Polish
- 342.4%Russian
- 292.1%French Canadian
- 231.6%Swedish
- 161.1%Norwegian
- 130.9%Czech
- 80.6%Dutch
- 40.3%Lithuanian
- 20.1%Danish
- 20.1%Greek
- 20.1%Swiss
- 20.1%Welsh
- 10.07%Portuguese
Zip codes: 03240.