Races in Gilmanton, New Hampshire (NH) Detailed Stats
Ancestries, Foreign-born residents, place of birth

Recent posts about races in Gilmanton, New Hampshire on our local forum with over 2,400,000 registered users:
 | Plow Guy Suggestions - Canterbury/Gilmanton (4 replies) |
| Looking at Hinsdale, NH for retirement. (8 replies) |
| From Texan to New Hampshirite (is that right?) (40 replies) |
| My husband wants us to move to NH *now* with no jobs (64 replies) |
| Best Places to live around Belmont, NH (4 replies) |
| Looking for info on Bennington (6 replies) |
3.3% of Gilmanton, NH residents are foreign-born (1.1% born in Europe, 1.1% born in North America, 0.5% born in Asia, 0.4% born in Latin America), which is 53.0% less than the foreign-born rate of 5.0% across the entire state of New Hampshire.
Race distribution in Gilmanton

- 3,00898.3%White alone
- 301.0%Two or more races
- 90.3%Hispanic
- 60.2%American Indian alone
- 40.1%Asian alone
- 30.10%Black alone

2000
2022
-
- 1,175,25295.1%White alone
- 20,4891.7%Hispanic
- 15,8031.3%Asian alone
- 11,6060.9%Two or more races
- 8,3540.7%Black alone
- 2,6980.2%American Indian alone
- 1,2540.1%Other race alone
- 3300.03%Native Hawaiian and Other
Pacific Islander alone

-
- 1,208,10186.6%White alone
- 63,4794.5%Hispanic
- 60,7244.4%Two or more races
- 36,5192.6%Asian alone
- 17,9311.3%Black alone
- 6,6150.5%Other race alone
- 1,0140.07%American Indian alone
- 8480.06%Native Hawaiian and Other
Pacific Islander alone

Income and house value in Gilmanton
- Median household income in 2022
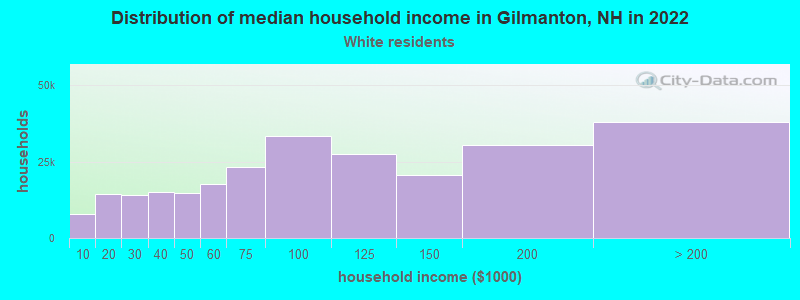
- $97,579White non-Hispanic householders
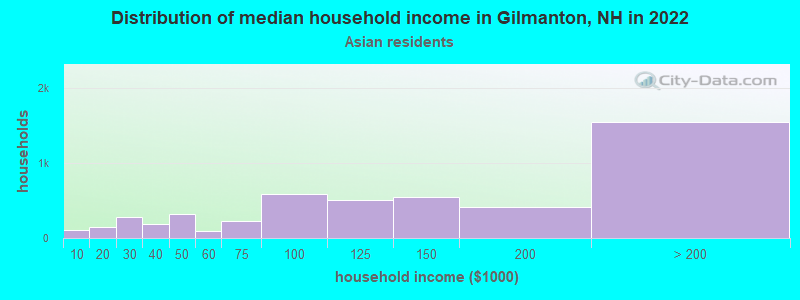
- $47,609Asian householders
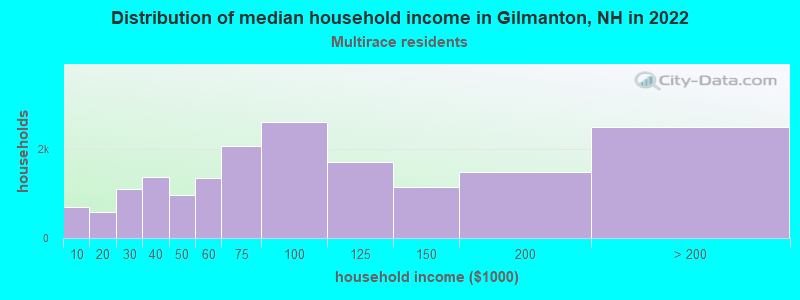
- $100,477Two or more races householders
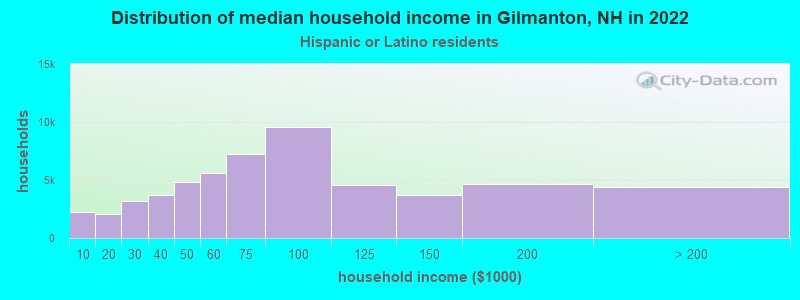
- $193,027Hispanic or Latino race householders
- Median 2022 house value
- $361,686White Non-Hispanic householders
- $243,287Asian householders
- $527,121Two or more races householders
Household income for White non-Hispanic householders
Household income for Asian householders
Household income for Two or more races householders
Household income for Hispanic or Latino race householders
Foreign-born residents in Gilmanton
100 residents are foreign born (1.1% Europe, 1.1% North America, 0.5% Asia, 0.4% Latin America).
| This city: | 3.3% |
| New Hampshire: | 4.4% |
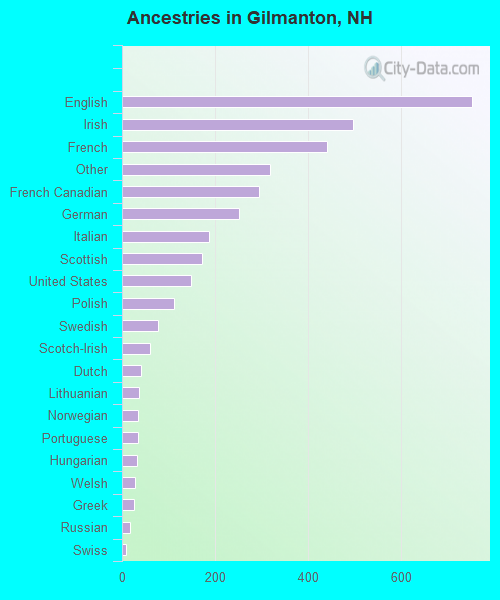
Ancestries in Gilmanton

- 75121.0%English
- 49613.9%Irish
- 44012.3%French
- 3178.9%Other
- 2948.2%French Canadian
- 2527.1%German
- 1875.2%Italian
- 1714.8%Scottish
- 1494.2%United States
- 1113.1%Polish
- 772.2%Swedish
- 601.7%Scotch-Irish
- 411.1%Dutch
- 361.0%Lithuanian
- 351.0%Norwegian
- 351.0%Portuguese
- 330.9%Hungarian
- 280.8%Welsh
- 260.7%Greek
- 170.5%Russian
- 90.3%Swiss
- 50.1%Danish
- 40.1%Slovak
Zip codes: 03237.