Races in Gerlach-Empire, Nevada (NV) Detailed Stats
Ancestries, Foreign-born residents, place of birth

Discuss Gerlach-Empire, Nevada races on our local forum with over 2,400,000 registered users
8.4% of Gerlach-Empire, NV residents are foreign-born (6.6% born in Latin America, 1.8% born in North America), which is 113.9% less than the foreign-born rate of 18.0% across the entire state of Nevada.
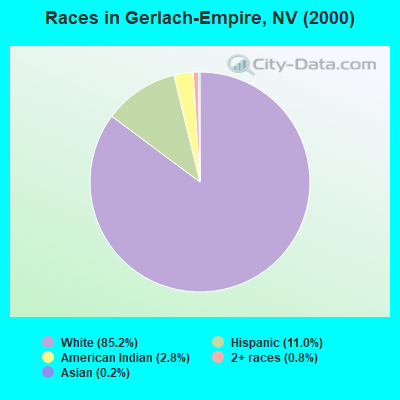
Race distribution in Gerlach-Empire

- 42585.2%White alone
- 5511.0%Hispanic
- 142.8%American Indian alone
- 40.8%Two or more races
- 10.2%Asian alone
2000
2022
-
- 1,303,00165.2%White alone
- 393,97019.7%Hispanic
- 131,5096.6%Black alone
- 88,5934.4%Asian alone
- 49,2312.5%Two or more races
- 21,3971.1%American Indian alone
- 7,7690.4%Native Hawaiian and Other
Pacific Islander alone - 2,7870.1%Other race alone

-
- 1,410,14544.4%White alone
- 961,35730.3%Hispanic
- 286,4719.0%Black alone
- 281,1498.8%Asian alone
- 182,1515.7%Two or more races
- 20,1020.6%Native Hawaiian and Other
Pacific Islander alone - 18,7810.6%Other race alone
- 17,6160.6%American Indian alone

Income and house value in Gerlach-Empire
- Median household income in 2022
- $63,567White non-Hispanic householders
- $63,806American Indian and Alaska Native householders
- $9,052Some other race householders
- $9,743Hispanic or Latino race householders
- Median 2022 house value
- $292,695White Non-Hispanic householders
Household income for White non-Hispanic householders

Household income for American Indian and Alaska Native householders

Household income for Hispanic or Latino race householders

Foreign-born residents in Gerlach-Empire
42 residents are foreign born (6.6% Latin America, 1.8% North America).
| This city: | 8.4% |
| Nevada: | 15.8% |
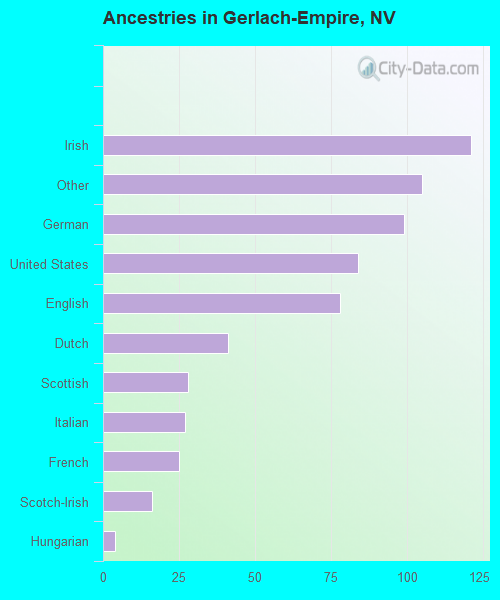
Ancestries in Gerlach-Empire

- 12119.3%Irish
- 10516.7%Other
- 9915.8%German
- 8413.4%United States
- 7812.4%English
- 416.5%Dutch
- 284.5%Scottish
- 274.3%Italian
- 254.0%French
- 162.5%Scotch-Irish
- 40.6%Hungarian
Zip codes: 89405.