Races in George Mason, Virginia (VA) Detailed Stats
Data:
Races - White alone (%)
Races - White alone (% change since 2000)
Races - Black alone (%)
Races - Black alone (% change since 2000)
Races - American Indian alone (%)
Races - American Indian alone (% change since 2000)
Races - Asian alone (%)
Races - Asian alone (% change since 2000)
Races - Hispanic (%)
Races - Hispanic (% change since 2000)
Races - Native Hawaiian and Other Pacific Islander alone (%)
Races - Native Hawaiian and Other Pacific Islander alone (% change since 2000)
Races - Two or more races(%)
Races - Two or more races(% change since 2000)
Races - Other race alone (%)
Races - Other race alone (% change since 2000)
Racial diversity
Place of birth - Born in state of residence (%)
Place of birth - Born in state of residence (%) - White
Place of birth - Born in state of residence (%) - Black or African American
Place of birth - Born in state of residence (%) - Asian
Place of birth - Born in state of residence (%) - Hispanic or Latino
Place of birth - Born in state of residence (%) - American Indian and Alaska Native
Place of birth - Born in state of residence (%) - Multirace
Place of birth - Born in state of residence (%) - Other Race
Place of birth - Born in other state (%)
Place of birth - Born in other state (%) - White
Place of birth - Born in other state (%) - Black or African American
Place of birth - Born in other state (%) - Asian
Place of birth - Born in other state (%) - Hispanic or Latino
Place of birth - Born in other state (%) - American Indian and Alaska Native
Place of birth - Born in other state (%) - Multirace
Place of birth - Born in other state (%) - Other Race
Place of birth - Native, outside of US (%)
Place of birth - Native, outside of US (%) - White
Place of birth - Native, outside of US (%) - Black or African American
Place of birth - Native, outside of US (%) - Asian
Place of birth - Native, outside of US (%) - Hispanic or Latino
Place of birth - Native, outside of US (%) - American Indian and Alaska Native
Place of birth - Native, outside of US (%) - Multirace
Place of birth - Native, outside of US (%) - Other Race
Place of birth - Foreign born (%)
Place of birth - Foreign born (%) - White
Place of birth - Foreign born (%) - Black or African American
Place of birth - Foreign born (%) - Asian
Place of birth - Foreign born (%) - Hispanic or Latino
Place of birth - Foreign born (%) - American Indian and Alaska Native
Place of birth - Foreign born (%) - Multirace
Place of birth - Foreign born (%) - Other Race
Residents speaking English at home (%)
Residents speaking English at home - Born in the United States (%)
Residents speaking English at home - Native, born elsewhere (%)
Residents speaking English at home - Foreign born (%)
Residents speaking Spanish at home (%)
Residents speaking Spanish at home - Born in the United States (%)
Residents speaking Spanish at home - Native, born elsewhere (%)
Residents speaking Spanish at home - Foreign born (%)
Residents speaking other language at home (%)
Residents speaking other language at home - Born in the United States (%)
Residents speaking other language at home - Native, born elsewhere (%)
Residents speaking other language at home - Foreign born (%)
Marital status - Never married (%)
Marital status - Now married (%)
Marital status - Separated (%)
Marital status - Widowed (%)
Marital status - Divorced (%)
Ancestries Reported - Arab (%)
Ancestries Reported - Czech (%)
Ancestries Reported - Danish (%)
Ancestries Reported - Dutch (%)
Ancestries Reported - English (%)
Ancestries Reported - French (%)
Ancestries Reported - French Canadian (%)
Ancestries Reported - German (%)
Ancestries Reported - Greek (%)
Ancestries Reported - Hungarian (%)
Ancestries Reported - Irish (%)
Ancestries Reported - Italian (%)
Ancestries Reported - Lithuanian (%)
Ancestries Reported - Norwegian (%)
Ancestries Reported - Polish (%)
Ancestries Reported - Portuguese (%)
Ancestries Reported - Russian (%)
Ancestries Reported - Scotch-Irish (%)
Ancestries Reported - Scottish (%)
Ancestries Reported - Slovak (%)
Ancestries Reported - Subsaharan African (%)
Ancestries Reported - Swedish (%)
Ancestries Reported - Swiss (%)
Ancestries Reported - Ukrainian (%)
Ancestries Reported - United States (%)
Ancestries Reported - Welsh (%)
Ancestries Reported - West Indian (%)
Ancestries Reported - Other (%)
Geographical mobility - Same house 1 year ago (%)
Geographical mobility - Same house 1 year ago (%) - White
Geographical mobility - Same house 1 year ago (%) - Black or African American
Geographical mobility - Same house 1 year ago (%) - Asian
Geographical mobility - Same house 1 year ago (%) - Hispanic or Latino
Geographical mobility - Same house 1 year ago (%) - American Indian and Alaska Native
Geographical mobility - Same house 1 year ago (%) - Multirace
Geographical mobility - Same house 1 year ago (%) - Other Race
Geographical mobility - Moved within same county (%)
Geographical mobility - Moved within same county (%) - White
Geographical mobility - Moved within same county (%) - Black or African American
Geographical mobility - Moved within same county (%) - Asian
Geographical mobility - Moved within same county (%) - Hispanic or Latino
Geographical mobility - Moved within same county (%) - American Indian and Alaska Native
Geographical mobility - Moved within same county (%) - Multirace
Geographical mobility - Moved within same county (%) - Other Race
Geographical mobility - Moved from different county within same state (%)
Geographical mobility - Moved from different county within same state (%) - White
Geographical mobility - Moved from different county within same state (%) - Black or African American
Geographical mobility - Moved from different county within same state (%) - Asian
Geographical mobility - Moved from different county within same state (%) - Hispanic or Latino
Geographical mobility - Moved from different county within same state (%) - American Indian and Alaska Native
Geographical mobility - Moved from different county within same state (%) - Multirace
Geographical mobility - Moved from different county within same state (%) - Other Race
Geographical mobility - Moved from different state (%)
Geographical mobility - Moved from different state (%) - White
Geographical mobility - Moved from different state (%) - Black or African American
Geographical mobility - Moved from different state (%) - Asian
Geographical mobility - Moved from different state (%) - Hispanic or Latino
Geographical mobility - Moved from different state (%) - American Indian and Alaska Native
Geographical mobility - Moved from different state (%) - Multirace
Geographical mobility - Moved from different state (%) - Other Race
Geographical mobility - Moved from abroad (%)
Geographical mobility - Moved from abroad (%) - White
Geographical mobility - Moved from abroad (%) - Black or African American
Geographical mobility - Moved from abroad (%) - Asian
Geographical mobility - Moved from abroad (%) - Hispanic or Latino
Geographical mobility - Moved from abroad (%) - American Indian and Alaska Native
Geographical mobility - Moved from abroad (%) - Multirace
Geographical mobility - Moved from abroad (%) - Other Race
Place of birth for the foreign-born population - Ireland (%)
Place of birth for the foreign-born population - Denmark (%)
Place of birth for the foreign-born population - Norway (%)
Place of birth for the foreign-born population - Sweden (%)
Place of birth for the foreign-born population - United Kingdom (%)
Place of birth for the foreign-born population - England (%)
Place of birth for the foreign-born population - Scotland (%)
Place of birth for the foreign-born population - Other Northern Europe (%)
Place of birth for the foreign-born population - Austria (%)
Place of birth for the foreign-born population - Belgium (%)
Place of birth for the foreign-born population - France (%)
Place of birth for the foreign-born population - Germany (%)
Place of birth for the foreign-born population - Netherlands (%)
Place of birth for the foreign-born population - Switzerland (%)
Place of birth for the foreign-born population - Other Western Europe (%)
Place of birth for the foreign-born population - Greece (%)
Place of birth for the foreign-born population - Italy (%)
Place of birth for the foreign-born population - Portugal (%)
Place of birth for the foreign-born population - Spain (%)
Place of birth for the foreign-born population - Other Southern Europe (%)
Place of birth for the foreign-born population - Albania (%)
Place of birth for the foreign-born population - Belarus (%)
Place of birth for the foreign-born population - Bosnia and Herzegovina (%)
Place of birth for the foreign-born population - Bulgaria (%)
Place of birth for the foreign-born population - Croatia (%)
Place of birth for the foreign-born population - Czechoslovakia (%)
Place of birth for the foreign-born population - Hungary (%)
Place of birth for the foreign-born population - Latvia (%)
Place of birth for the foreign-born population - Lithuania (%)
Place of birth for the foreign-born population - North Macedonia (Macedonia) (%)
Place of birth for the foreign-born population - Moldova (%)
Place of birth for the foreign-born population - Poland (%)
Place of birth for the foreign-born population - Romania (%)
Place of birth for the foreign-born population - Russia (%)
Place of birth for the foreign-born population - Serbia (%)
Place of birth for the foreign-born population - Ukraine (%)
Place of birth for the foreign-born population - Other Eastern Europe (%)
Place of birth for the foreign-born population - China (%)
Place of birth for the foreign-born population - Hong Kong (%)
Place of birth for the foreign-born population - Taiwan (%)
Place of birth for the foreign-born population - Japan (%)
Place of birth for the foreign-born population - Korea (%)
Place of birth for the foreign-born population - Other Eastern Asia (%)
Place of birth for the foreign-born population - Afghanistan (%)
Place of birth for the foreign-born population - Bangladesh (%)
Place of birth for the foreign-born population - India (%)
Place of birth for the foreign-born population - Iran (%)
Place of birth for the foreign-born population - Kazakhstan (%)
Place of birth for the foreign-born population - Nepal (%)
Place of birth for the foreign-born population - Pakistan (%)
Place of birth for the foreign-born population - Sri Lanka (%)
Place of birth for the foreign-born population - Uzbekistan (%)
Place of birth for the foreign-born population - Other South Central Asia (%)
Place of birth for the foreign-born population - Burma (%)
Place of birth for the foreign-born population - Cambodia (%)
Place of birth for the foreign-born population - Indonesia (%)
Place of birth for the foreign-born population - Laos (%)
Place of birth for the foreign-born population - Malaysia (%)
Place of birth for the foreign-born population - Philippines (%)
Place of birth for the foreign-born population - Singapore (%)
Place of birth for the foreign-born population - Thailand (%)
Place of birth for the foreign-born population - Vietnam (%)
Place of birth for the foreign-born population - Other South Eastern Asia (%)
Place of birth for the foreign-born population - Armenia (%)
Place of birth for the foreign-born population - Iraq (%)
Place of birth for the foreign-born population - Israel (%)
Place of birth for the foreign-born population - Jordan (%)
Place of birth for the foreign-born population - Kuwait (%)
Place of birth for the foreign-born population - Lebanon (%)
Place of birth for the foreign-born population - Saudi Arabia (%)
Place of birth for the foreign-born population - Syria (%)
Place of birth for the foreign-born population - Turkey (%)
Place of birth for the foreign-born population - Yemen (%)
Place of birth for the foreign-born population - Other Western Asia (%)
Place of birth for the foreign-born population - Eritrea (%)
Place of birth for the foreign-born population - Ethiopia (%)
Place of birth for the foreign-born population - Kenya (%)
Place of birth for the foreign-born population - Somalia (%)
Place of birth for the foreign-born population - Uganda (%)
Place of birth for the foreign-born population - Zimbabwe (%)
Place of birth for the foreign-born population - Other Eastern Africa (%)
Place of birth for the foreign-born population - Cameroon (%)
Place of birth for the foreign-born population - Congo (%)
Place of birth for the foreign-born population - Democratic Republic of Congo (Zaire) (%)
Place of birth for the foreign-born population - Other Middle Africa (%)
Place of birth for the foreign-born population - Egypt (%)
Place of birth for the foreign-born population - Morocco (%)
Place of birth for the foreign-born population - Sudan (%)
Place of birth for the foreign-born population - Other Northern Africa (%)
Place of birth for the foreign-born population - South Africa (%)
Place of birth for the foreign-born population - Other Southern Africa (%)
Place of birth for the foreign-born population - Cabo Verde (%)
Place of birth for the foreign-born population - Ghana (%)
Place of birth for the foreign-born population - Liberia (%)
Place of birth for the foreign-born population - Nigeria (%)
Place of birth for the foreign-born population - Senegal (%)
Place of birth for the foreign-born population - Sierra Leone (%)
Place of birth for the foreign-born population - Other Western Africa (%)
Place of birth for the foreign-born population - Australia (%)
Place of birth for the foreign-born population - New Zealand (%)
Place of birth for the foreign-born population - Fiji (%)
Place of birth for the foreign-born population - Micronesia (%)
Place of birth for the foreign-born population - Bahamas (%)
Place of birth for the foreign-born population - Barbados (%)
Place of birth for the foreign-born population - Cuba (%)
Place of birth for the foreign-born population - Dominica (%)
Place of birth for the foreign-born population - Dominican Republic (%)
Place of birth for the foreign-born population - Grenada (%)
Place of birth for the foreign-born population - Haiti (%)
Place of birth for the foreign-born population - Jamaica (%)
Place of birth for the foreign-born population - St. Vincent and the Grenadines (%)
Place of birth for the foreign-born population - Trinidad and Tobago (%)
Place of birth for the foreign-born population - West Indies (%)
Place of birth for the foreign-born population - Other Caribbean (%)
Place of birth for the foreign-born population - Belize (%)
Place of birth for the foreign-born population - Costa Rica (%)
Place of birth for the foreign-born population - El Salvador (%)
Place of birth for the foreign-born population - Guatemala (%)
Place of birth for the foreign-born population - Honduras (%)
Place of birth for the foreign-born population - Mexico (%)
Place of birth for the foreign-born population - Nicaragua (%)
Place of birth for the foreign-born population - Panama (%)
Place of birth for the foreign-born population - Other Central America (%)
Place of birth for the foreign-born population - Argentina (%)
Place of birth for the foreign-born population - Bolivia (%)
Place of birth for the foreign-born population - Brazil (%)
Place of birth for the foreign-born population - Chile (%)
Place of birth for the foreign-born population - Colombia (%)
Place of birth for the foreign-born population - Ecuador (%)
Place of birth for the foreign-born population - Guyana (%)
Place of birth for the foreign-born population - Peru (%)
Place of birth for the foreign-born population - Uruguay (%)
Place of birth for the foreign-born population - Venezuela (%)
Place of birth for the foreign-born population - Other South America (%)
Place of birth for the foreign-born population - Canada (%)
Place of birth for the foreign-born population - Other Northern America (%)
Place of birth for the foreign-born population - Other (%)
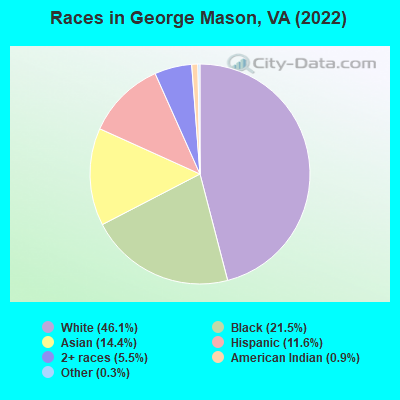
According to 2022 data, the most numerous races in George Mason, VA are White alone (4,590 residents), Black alone (2,141 residents), and Hispanic (1,151 residents). 77.8% of George Mason residents speak English at home.
Race distribution in George Mason 4,590 46.1% White alone 2,141 21.5% Black alone 1,433 14.4% Asian alone 1,151 11.6% Hispanic 547 5.5% Two or more races 89 0.9% American Indian alone 31 0.3% Other race alone 1 0.01% Native Hawaiian and Other
2000 2022
4,965,637 70.2% White alone 1,376,378 19.4% Black alone 329,540 4.7% Hispanic 259,277 3.7% Asian alone 114,022 1.6% Two or more races 18,596 0.3% American Indian alone 11,685 0.2% Other race alone 3,380 0.05% Native Hawaiian and Other
5,095,130 58.7% White alone 1,594,785 18.4% Black alone 905,750 10.4% Hispanic 602,881 6.9% Asian alone 406,047 4.7% Two or more races 60,419 0.7% Other race alone 11,738 0.1% American Indian alone 6,869 0.08% Native Hawaiian and Other
Income and house value in George Mason Median household income in 2022 $167,238 White non-Hispanic householders$65,358 Black householders$153,516 Asian householders$147,152 Two or more races householders$138,050 Hispanic or Latino race householders
Median age by race in George Mason
21.9 Median age for White residents22.1 21.6 20.4 Median age for Black or African American residents19.9 20.8 23.2 Median age for American Indian / Alaska Native residents-964,539,006.1 -669,005,847.3 34.7 Median age for Asian residents28.6 36.4 -666,666,666.0 Median age for Native Hawaiian / Pacific Islander residents-558,791,801.0 -584,518,166.9 24.5 Median age for Other race residents31.4 21.1 22.4 Median age for Two or more races residents24.1 21.6 21.6 Median age for White alone residents21.9 21.1 28.5 Median age for Hispanic or Latino residents31.0 27.5
Owner/renter occupied households by race in George Mason
House owners and renters - White residents 811 81.1% Owner occupied189 18.9% Renter occupiedHouse owners and renters - Black or African American residents 40 55.6% Owner occupied32 44.4% Renter occupiedHouse owners and renters - Asian residents 313 71.8% Owner occupied123 28.2% Renter occupiedHouse owners and renters - Other race residents 35 64.0% Owner occupied19 36.0% Renter occupiedHouse owners and renters - Two or more races residents 226 100.0% Owner occupiedHouse owners and renters - White alone residents 798 81.4% Owner occupied183 18.6% Renter occupiedHouse owners and renters - Hispanic or Latino residents 228 85.4% Owner occupied39 14.6% Renter occupied
Language usage in George Mason
English speakers - Total 77.8% of residents of George Mason speak English at home.
8.6% of residents speak Spanish at home 653 78.3% Speak English very well181 21.7% Speak English less than very well13.9% of residents speak other language at home 792 58.6% Speak English very well560 41.4% Speak English less than very well
English speakers - Born in the United States 94.0% of residents of George Mason speak English at home.
4.3% of residents speak Spanish at home 215 100.0% Speak English very well1.6% of residents speak other language at home 55 70.5% Speak English very well23 29.5% Speak English less than very well
English speakers - Native, born elsewhere 79.8% of residents of George Mason speak English at home.
10.7% of residents speak Spanish at home 20 74.1% Speak English very well7 25.9% Speak English less than very well7.1% of residents speak other language at home 18 100.0% Speak English very well
English speakers - Foreign-born 21.0% of residents of George Mason speak English at home.
24.5% of residents speak Spanish at home 334 71.7% Speak English very well132 28.3% Speak English less than very well54.9% of residents speak other language at home 516 49.4% Speak English very well529 50.6% Speak English less than very well
White (Caucasian) - Speak only English Native:
97.0% (4,117)Foreign-born:
61.0% (169)
White (Caucasian) - Speak another language Native:
4.0% (169)Foreign-born:
51.8% (144)
Black or African American - Speak only English Native:
97.5% (1,979)Foreign-born:
32.2% (21)
Black or African American - Speak another language Native:
0.6% (12)Foreign-born:
69.6% (45)
Asian - Speak only English Native:
49.9% (216)Foreign-born:
18.7% (178)
Asian - Speak another language Native:
50.1% (217)Foreign-born:
82.1% (782)
Other race - Speak another language Native:
52.1% (83)Foreign-born:
98.2% (113)
Two or more races - Speak another language Native:
28.9% (244)Foreign-born:
100.0% (596)
White alone - Speak only English Native:
97.9% (4,072)Foreign-born:
53.2% (177)
White alone - Speak another language Native:
2.5% (102)Foreign-born:
50.5% (168)
Hispanic or Latino - Speak only English Native:
44.7% (293)Foreign-born:
1.5% (7)
Hispanic or Latino - Speak another language Native:
54.9% (360)Foreign-born:
98.4% (464)
Foreign-born residents in George Mason
Marital status for residents in George Mason Marital status - White (Caucasian) population 15 years and over
Males 63.2% Never married34.5% Now married0.0% Separated1.1% Widowed1.1% DivorcedFemales 60.0% Never married31.0% Now married0.3% Separated2.8% Widowed5.9% DivorcedWomen who gave birth in the past 12 months Now married:
100.0% (17)Unmarried:
0.0% (0)
Women who did not give birth in the past 12 months Now married:
19.2% (298)Unmarried:
80.8% (1,256)
Marital status - Black or African American population 15 years and over
Males 94.9% Never married4.0% Now married0.0% Separated1.1% Widowed0.0% DivorcedFemales 96.4% Never married1.8% Now married0.0% Separated0.7% Widowed1.1% DivorcedWomen who did not give birth in the past 12 months Now married:
0.5% (5)Unmarried:
99.5% (1,018)
Marital status - American Indian / Alaska Native population 15 years and over
Males 100.0% Never married0.0% Now married0.0% Separated0.0% Widowed0.0% DivorcedFemales 100.0% Never married0.0% Now married0.0% Separated0.0% Widowed0.0% DivorcedWomen who did not give birth in the past 12 months Now married:
0.0% (0)Unmarried:
100.0% (2)
Marital status - Asian population 15 years and over
Males 46.8% Never married48.9% Now married0.0% Separated0.8% Widowed3.4% DivorcedFemales 28.5% Never married62.1% Now married1.4% Separated6.1% Widowed1.9% DivorcedWomen who gave birth in the past 12 months Now married:
100.0% (22)Unmarried:
0.0% (0)
Women who did not give birth in the past 12 months Now married:
59.1% (253)Unmarried:
40.9% (175)
Marital status - Other race population 15 years and over
Males 45.2% Never married38.9% Now married3.2% Separated7.1% Widowed5.6% DivorcedFemales 64.4% Never married35.6% Now married0.0% Separated0.0% Widowed0.0% DivorcedWomen who did not give birth in the past 12 months Now married:
37.8% (38)Unmarried:
62.2% (63)
Marital status - Two or more races population 15 years and over
Males 60.2% Never married39.6% Now married0.3% Separated0.0% Widowed0.0% DivorcedFemales 60.4% Never married38.4% Now married0.0% Separated0.0% Widowed1.2% DivorcedWomen who did not give birth in the past 12 months Now married:
30.4% (178)Unmarried:
69.6% (408)
Marital status - White alone, not Hispanic / Latino population 15 years and over
Males 63.9% Never married33.8% Now married0.0% Separated1.2% Widowed1.1% DivorcedFemales 61.1% Never married30.4% Now married0.0% Separated2.9% Widowed5.7% DivorcedWomen who gave birth in the past 12 months Now married:
100.0% (18)Unmarried:
0.0% (0)
Women who did not give birth in the past 12 months Now married:
17.7% (287)Unmarried:
82.3% (1,331)
Marital status - Hispanic or Latino population 15 years and over
Males 45.1% Never married50.2% Now married1.1% Separated2.0% Widowed1.6% DivorcedFemales 47.2% Never married47.8% Now married1.4% Separated0.0% Widowed3.5% DivorcedWomen who did not give birth in the past 12 months Now married:
45.4% (191)Unmarried:
54.6% (230)
Ancestries in George Mason
228 6.5% European226 6.5% American159 4.6% Irish152 4.4% English133 3.8% Afghan123 3.5% German49 1.4% Greek49 1.4% African47 1.3% Italian42 1.2% Polish41 1.2% Egyptian38 1.1% Ethiopian25 0.7% British22 0.6% Eastern European21 0.6% Swedish17 0.5% Czechoslovakian16 0.5% Russian16 0.5% Scottish15 0.4% Dutch14 0.4% West Indian13 0.4% Iranian12 0.3% Liberian9 0.3% Northern European6 0.2% Senegalese5 0.1% Canadian5 0.1% Croatian5 0.1% Finnish4 0.1% Lebanese4 0.1% Ukrainian3 0.09% Cape Verdean2 0.06% Scotch-Irish
Children Nativity (place of birth) in George Mason
Children under 6 years - Living with two parents Both parents native 93 100.0% NativeBoth parents foreign-born 55 81.4% Native13 18.6% Foreign-bornOne native, one foreign-born parent 115 100.0% NativeChildren under 6 years - Living with one parent Native parent 18 100.0% NativeForeign-born parent 18 85.0% Native3 15.0% Foreign-bornChildren 6 to 17 years - Living with two parents Both parents native 322 97.2% Native9 2.8% Foreign-bornBoth parents foreign-born 215 86.4% Native34 13.6% Foreign-bornOne native, one foreign-born parent 180 100.0% NativeChildren 6 to 17 years - Living with one parent Native parent 131 100.0% NativeForeign-born parent 17 58.9% Native12 41.1% Foreign-born
Grandparents responsible for own grandchildren in George Mason
Grandparents (30 to 59 years) White / Caucasian 4 100.0% Not responsible for grandchildrenOther race 12 100.0% Not responsible for grandchildrenHispanic or Latino 14 100.0% Not responsible for grandchildrenGrandparents (60 years and over) White / Caucasian 3 18.3% Responsible for grandchildren14 81.7% Not responsible for grandchildrenHispanic or Latino 58 100.0% Not responsible for grandchildren