Races in Fort Hood, Texas (TX) Detailed Stats
Data:
Races - White alone (%)
Races - White alone (% change since 2000)
Races - Black alone (%)
Races - Black alone (% change since 2000)
Races - American Indian alone (%)
Races - American Indian alone (% change since 2000)
Races - Asian alone (%)
Races - Asian alone (% change since 2000)
Races - Hispanic (%)
Races - Hispanic (% change since 2000)
Races - Native Hawaiian and Other Pacific Islander alone (%)
Races - Native Hawaiian and Other Pacific Islander alone (% change since 2000)
Races - Two or more races(%)
Races - Two or more races(% change since 2000)
Races - Other race alone (%)
Races - Other race alone (% change since 2000)
Racial diversity
Place of birth - Born in state of residence (%)
Place of birth - Born in state of residence (%) - White
Place of birth - Born in state of residence (%) - Black or African American
Place of birth - Born in state of residence (%) - Asian
Place of birth - Born in state of residence (%) - Hispanic or Latino
Place of birth - Born in state of residence (%) - American Indian and Alaska Native
Place of birth - Born in state of residence (%) - Multirace
Place of birth - Born in state of residence (%) - Other Race
Place of birth - Born in other state (%)
Place of birth - Born in other state (%) - White
Place of birth - Born in other state (%) - Black or African American
Place of birth - Born in other state (%) - Asian
Place of birth - Born in other state (%) - Hispanic or Latino
Place of birth - Born in other state (%) - American Indian and Alaska Native
Place of birth - Born in other state (%) - Multirace
Place of birth - Born in other state (%) - Other Race
Place of birth - Native, outside of US (%)
Place of birth - Native, outside of US (%) - White
Place of birth - Native, outside of US (%) - Black or African American
Place of birth - Native, outside of US (%) - Asian
Place of birth - Native, outside of US (%) - Hispanic or Latino
Place of birth - Native, outside of US (%) - American Indian and Alaska Native
Place of birth - Native, outside of US (%) - Multirace
Place of birth - Native, outside of US (%) - Other Race
Place of birth - Foreign born (%)
Place of birth - Foreign born (%) - White
Place of birth - Foreign born (%) - Black or African American
Place of birth - Foreign born (%) - Asian
Place of birth - Foreign born (%) - Hispanic or Latino
Place of birth - Foreign born (%) - American Indian and Alaska Native
Place of birth - Foreign born (%) - Multirace
Place of birth - Foreign born (%) - Other Race
Residents speaking English at home (%)
Residents speaking English at home - Born in the United States (%)
Residents speaking English at home - Native, born elsewhere (%)
Residents speaking English at home - Foreign born (%)
Residents speaking Spanish at home (%)
Residents speaking Spanish at home - Born in the United States (%)
Residents speaking Spanish at home - Native, born elsewhere (%)
Residents speaking Spanish at home - Foreign born (%)
Residents speaking other language at home (%)
Residents speaking other language at home - Born in the United States (%)
Residents speaking other language at home - Native, born elsewhere (%)
Residents speaking other language at home - Foreign born (%)
Marital status - Never married (%)
Marital status - Now married (%)
Marital status - Separated (%)
Marital status - Widowed (%)
Marital status - Divorced (%)
Ancestries Reported - Arab (%)
Ancestries Reported - Czech (%)
Ancestries Reported - Danish (%)
Ancestries Reported - Dutch (%)
Ancestries Reported - English (%)
Ancestries Reported - French (%)
Ancestries Reported - French Canadian (%)
Ancestries Reported - German (%)
Ancestries Reported - Greek (%)
Ancestries Reported - Hungarian (%)
Ancestries Reported - Irish (%)
Ancestries Reported - Italian (%)
Ancestries Reported - Lithuanian (%)
Ancestries Reported - Norwegian (%)
Ancestries Reported - Polish (%)
Ancestries Reported - Portuguese (%)
Ancestries Reported - Russian (%)
Ancestries Reported - Scotch-Irish (%)
Ancestries Reported - Scottish (%)
Ancestries Reported - Slovak (%)
Ancestries Reported - Subsaharan African (%)
Ancestries Reported - Swedish (%)
Ancestries Reported - Swiss (%)
Ancestries Reported - Ukrainian (%)
Ancestries Reported - United States (%)
Ancestries Reported - Welsh (%)
Ancestries Reported - West Indian (%)
Ancestries Reported - Other (%)
Geographical mobility - Same house 1 year ago (%)
Geographical mobility - Same house 1 year ago (%) - White
Geographical mobility - Same house 1 year ago (%) - Black or African American
Geographical mobility - Same house 1 year ago (%) - Asian
Geographical mobility - Same house 1 year ago (%) - Hispanic or Latino
Geographical mobility - Same house 1 year ago (%) - American Indian and Alaska Native
Geographical mobility - Same house 1 year ago (%) - Multirace
Geographical mobility - Same house 1 year ago (%) - Other Race
Geographical mobility - Moved within same county (%)
Geographical mobility - Moved within same county (%) - White
Geographical mobility - Moved within same county (%) - Black or African American
Geographical mobility - Moved within same county (%) - Asian
Geographical mobility - Moved within same county (%) - Hispanic or Latino
Geographical mobility - Moved within same county (%) - American Indian and Alaska Native
Geographical mobility - Moved within same county (%) - Multirace
Geographical mobility - Moved within same county (%) - Other Race
Geographical mobility - Moved from different county within same state (%)
Geographical mobility - Moved from different county within same state (%) - White
Geographical mobility - Moved from different county within same state (%) - Black or African American
Geographical mobility - Moved from different county within same state (%) - Asian
Geographical mobility - Moved from different county within same state (%) - Hispanic or Latino
Geographical mobility - Moved from different county within same state (%) - American Indian and Alaska Native
Geographical mobility - Moved from different county within same state (%) - Multirace
Geographical mobility - Moved from different county within same state (%) - Other Race
Geographical mobility - Moved from different state (%)
Geographical mobility - Moved from different state (%) - White
Geographical mobility - Moved from different state (%) - Black or African American
Geographical mobility - Moved from different state (%) - Asian
Geographical mobility - Moved from different state (%) - Hispanic or Latino
Geographical mobility - Moved from different state (%) - American Indian and Alaska Native
Geographical mobility - Moved from different state (%) - Multirace
Geographical mobility - Moved from different state (%) - Other Race
Geographical mobility - Moved from abroad (%)
Geographical mobility - Moved from abroad (%) - White
Geographical mobility - Moved from abroad (%) - Black or African American
Geographical mobility - Moved from abroad (%) - Asian
Geographical mobility - Moved from abroad (%) - Hispanic or Latino
Geographical mobility - Moved from abroad (%) - American Indian and Alaska Native
Geographical mobility - Moved from abroad (%) - Multirace
Geographical mobility - Moved from abroad (%) - Other Race
Place of birth for the foreign-born population - Ireland (%)
Place of birth for the foreign-born population - Denmark (%)
Place of birth for the foreign-born population - Norway (%)
Place of birth for the foreign-born population - Sweden (%)
Place of birth for the foreign-born population - United Kingdom (%)
Place of birth for the foreign-born population - England (%)
Place of birth for the foreign-born population - Scotland (%)
Place of birth for the foreign-born population - Other Northern Europe (%)
Place of birth for the foreign-born population - Austria (%)
Place of birth for the foreign-born population - Belgium (%)
Place of birth for the foreign-born population - France (%)
Place of birth for the foreign-born population - Germany (%)
Place of birth for the foreign-born population - Netherlands (%)
Place of birth for the foreign-born population - Switzerland (%)
Place of birth for the foreign-born population - Other Western Europe (%)
Place of birth for the foreign-born population - Greece (%)
Place of birth for the foreign-born population - Italy (%)
Place of birth for the foreign-born population - Portugal (%)
Place of birth for the foreign-born population - Spain (%)
Place of birth for the foreign-born population - Other Southern Europe (%)
Place of birth for the foreign-born population - Albania (%)
Place of birth for the foreign-born population - Belarus (%)
Place of birth for the foreign-born population - Bosnia and Herzegovina (%)
Place of birth for the foreign-born population - Bulgaria (%)
Place of birth for the foreign-born population - Croatia (%)
Place of birth for the foreign-born population - Czechoslovakia (%)
Place of birth for the foreign-born population - Hungary (%)
Place of birth for the foreign-born population - Latvia (%)
Place of birth for the foreign-born population - Lithuania (%)
Place of birth for the foreign-born population - North Macedonia (Macedonia) (%)
Place of birth for the foreign-born population - Moldova (%)
Place of birth for the foreign-born population - Poland (%)
Place of birth for the foreign-born population - Romania (%)
Place of birth for the foreign-born population - Russia (%)
Place of birth for the foreign-born population - Serbia (%)
Place of birth for the foreign-born population - Ukraine (%)
Place of birth for the foreign-born population - Other Eastern Europe (%)
Place of birth for the foreign-born population - China (%)
Place of birth for the foreign-born population - Hong Kong (%)
Place of birth for the foreign-born population - Taiwan (%)
Place of birth for the foreign-born population - Japan (%)
Place of birth for the foreign-born population - Korea (%)
Place of birth for the foreign-born population - Other Eastern Asia (%)
Place of birth for the foreign-born population - Afghanistan (%)
Place of birth for the foreign-born population - Bangladesh (%)
Place of birth for the foreign-born population - India (%)
Place of birth for the foreign-born population - Iran (%)
Place of birth for the foreign-born population - Kazakhstan (%)
Place of birth for the foreign-born population - Nepal (%)
Place of birth for the foreign-born population - Pakistan (%)
Place of birth for the foreign-born population - Sri Lanka (%)
Place of birth for the foreign-born population - Uzbekistan (%)
Place of birth for the foreign-born population - Other South Central Asia (%)
Place of birth for the foreign-born population - Burma (%)
Place of birth for the foreign-born population - Cambodia (%)
Place of birth for the foreign-born population - Indonesia (%)
Place of birth for the foreign-born population - Laos (%)
Place of birth for the foreign-born population - Malaysia (%)
Place of birth for the foreign-born population - Philippines (%)
Place of birth for the foreign-born population - Singapore (%)
Place of birth for the foreign-born population - Thailand (%)
Place of birth for the foreign-born population - Vietnam (%)
Place of birth for the foreign-born population - Other South Eastern Asia (%)
Place of birth for the foreign-born population - Armenia (%)
Place of birth for the foreign-born population - Iraq (%)
Place of birth for the foreign-born population - Israel (%)
Place of birth for the foreign-born population - Jordan (%)
Place of birth for the foreign-born population - Kuwait (%)
Place of birth for the foreign-born population - Lebanon (%)
Place of birth for the foreign-born population - Saudi Arabia (%)
Place of birth for the foreign-born population - Syria (%)
Place of birth for the foreign-born population - Turkey (%)
Place of birth for the foreign-born population - Yemen (%)
Place of birth for the foreign-born population - Other Western Asia (%)
Place of birth for the foreign-born population - Eritrea (%)
Place of birth for the foreign-born population - Ethiopia (%)
Place of birth for the foreign-born population - Kenya (%)
Place of birth for the foreign-born population - Somalia (%)
Place of birth for the foreign-born population - Uganda (%)
Place of birth for the foreign-born population - Zimbabwe (%)
Place of birth for the foreign-born population - Other Eastern Africa (%)
Place of birth for the foreign-born population - Cameroon (%)
Place of birth for the foreign-born population - Congo (%)
Place of birth for the foreign-born population - Democratic Republic of Congo (Zaire) (%)
Place of birth for the foreign-born population - Other Middle Africa (%)
Place of birth for the foreign-born population - Egypt (%)
Place of birth for the foreign-born population - Morocco (%)
Place of birth for the foreign-born population - Sudan (%)
Place of birth for the foreign-born population - Other Northern Africa (%)
Place of birth for the foreign-born population - South Africa (%)
Place of birth for the foreign-born population - Other Southern Africa (%)
Place of birth for the foreign-born population - Cabo Verde (%)
Place of birth for the foreign-born population - Ghana (%)
Place of birth for the foreign-born population - Liberia (%)
Place of birth for the foreign-born population - Nigeria (%)
Place of birth for the foreign-born population - Senegal (%)
Place of birth for the foreign-born population - Sierra Leone (%)
Place of birth for the foreign-born population - Other Western Africa (%)
Place of birth for the foreign-born population - Australia (%)
Place of birth for the foreign-born population - New Zealand (%)
Place of birth for the foreign-born population - Fiji (%)
Place of birth for the foreign-born population - Micronesia (%)
Place of birth for the foreign-born population - Bahamas (%)
Place of birth for the foreign-born population - Barbados (%)
Place of birth for the foreign-born population - Cuba (%)
Place of birth for the foreign-born population - Dominica (%)
Place of birth for the foreign-born population - Dominican Republic (%)
Place of birth for the foreign-born population - Grenada (%)
Place of birth for the foreign-born population - Haiti (%)
Place of birth for the foreign-born population - Jamaica (%)
Place of birth for the foreign-born population - St. Vincent and the Grenadines (%)
Place of birth for the foreign-born population - Trinidad and Tobago (%)
Place of birth for the foreign-born population - West Indies (%)
Place of birth for the foreign-born population - Other Caribbean (%)
Place of birth for the foreign-born population - Belize (%)
Place of birth for the foreign-born population - Costa Rica (%)
Place of birth for the foreign-born population - El Salvador (%)
Place of birth for the foreign-born population - Guatemala (%)
Place of birth for the foreign-born population - Honduras (%)
Place of birth for the foreign-born population - Mexico (%)
Place of birth for the foreign-born population - Nicaragua (%)
Place of birth for the foreign-born population - Panama (%)
Place of birth for the foreign-born population - Other Central America (%)
Place of birth for the foreign-born population - Argentina (%)
Place of birth for the foreign-born population - Bolivia (%)
Place of birth for the foreign-born population - Brazil (%)
Place of birth for the foreign-born population - Chile (%)
Place of birth for the foreign-born population - Colombia (%)
Place of birth for the foreign-born population - Ecuador (%)
Place of birth for the foreign-born population - Guyana (%)
Place of birth for the foreign-born population - Peru (%)
Place of birth for the foreign-born population - Uruguay (%)
Place of birth for the foreign-born population - Venezuela (%)
Place of birth for the foreign-born population - Other South America (%)
Place of birth for the foreign-born population - Canada (%)
Place of birth for the foreign-born population - Other Northern America (%)
Place of birth for the foreign-born population - Other (%)
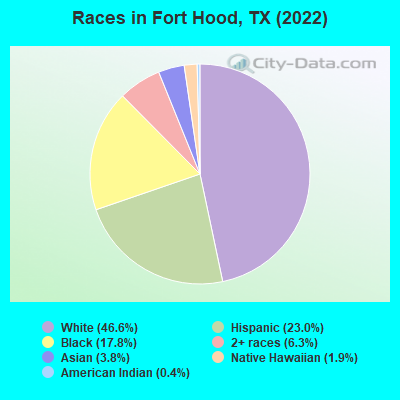
According to 2022 data, the most numerous races in Fort Hood, TX are Hispanic (6,114 residents), White alone (12,362 residents), and Black alone (4,717 residents). 78.2% of Fort Hood residents speak English at home. 5.6% of Fort Hood, TX residents are foreign-born (2.4% born in Latin America, 1.8% born in Asia, 0.7% born in Europe, 0.6% born in Africa), which is 202.6% less than the foreign-born rate of 17.0% across the entire state of Texas.
Race distribution in Fort Hood
2000 2022
10,933,313 52.4% White alone 6,669,666 32.0% Hispanic 2,364,255 11.3% Black alone 554,445 2.7% Asian alone 230,567 1.1% Two or more races 68,859 0.3% American Indian alone 19,958 0.10% Other race alone 10,757 0.05% Native Hawaiian and Other
12,070,642 40.2% Hispanic 11,683,430 38.9% White alone 3,508,706 11.7% Black alone 1,608,173 5.4% Asian alone 956,560 3.2% Two or more races 125,763 0.4% Other race alone 47,023 0.2% American Indian alone 29,275 0.10% Native Hawaiian and Other
Income and house value in Fort Hood Median household income in 2022 $52,287 White non-Hispanic householders$66,158 Black householders$49,835 American Indian and Alaska Native householders$48,772 Asian householders$55,735 Native Hawaiian and other Pacific Islander householders$42,513 Some other race householders$63,267 Two or more races householders$53,064 Hispanic or Latino race householdersMedian 2022 house value $-492,373,369 White Non-Hispanic householders$-820,622,282 Black or African American householders$-930,038,587 Two or more races householders$-930,038,587 Hispanic or Latino householders
Median age by race in Fort Hood
22.5 Median age for White residents22.5 23.4 22.1 Median age for Black or African American residents21.0 23.9 25.5 Median age for American Indian / Alaska Native residents19.9 32.3 27.1 Median age for Asian residents26.7 26.2 21.3 Median age for Native Hawaiian / Pacific Islander residents20.5 37.9 21.8 Median age for Other race residents21.8 23.2 20.8 Median age for Two or more races residents22.3 16.4 22.3 Median age for White alone residents21.9 23.6 22.4 Median age for Hispanic or Latino residents22.8 21.6
Owner/renter occupied households by race in Fort Hood
House owners and renters - White residents 11 0.5% Owner occupied2,229 99.5% Renter occupiedHouse owners and renters - Black or African American residents 15 1.7% Owner occupied855 98.3% Renter occupiedHouse owners and renters - American Indian / Alaska Native residents 82 100.0% Renter occupiedHouse owners and renters - Asian residents 378 100.0% Renter occupiedHouse owners and renters - Native Hawaiian / Pacific Islander residents 75 100.0% Renter occupiedHouse owners and renters - Other race residents 305 100.0% Renter occupiedHouse owners and renters - Two or more races residents 4 1.0% Owner occupied445 99.0% Renter occupiedHouse owners and renters - White alone residents 11 0.6% Owner occupied2,046 99.4% Renter occupiedHouse owners and renters - Hispanic or Latino residents 980 100.0% Renter occupied
Language usage in Fort Hood
English speakers - Total 78.2% of residents of Fort Hood speak English at home.
13.9% of residents speak Spanish at home 2,287 69.6% Speak English very well999 30.4% Speak English less than very well7.5% of residents speak other language at home 1,430 81.0% Speak English very well335 19.0% Speak English less than very well
English speakers - Born in the United States 86.7% of residents of Fort Hood speak English at home.
10.1% of residents speak Spanish at home 1,429 79.5% Speak English very well369 20.5% Speak English less than very well2.9% of residents speak other language at home 486 94.2% Speak English very well30 5.8% Speak English less than very well
English speakers - Native, born elsewhere 25.5% of residents of Fort Hood speak English at home.
55.7% of residents speak Spanish at home 367 52.6% Speak English very well331 47.4% Speak English less than very well16.0% of residents speak other language at home 175 87.5% Speak English very well25 12.5% Speak English less than very well
English speakers - Foreign-born 18.7% of residents of Fort Hood speak English at home.
25.0% of residents speak Spanish at home 339 79.4% Speak English very well88 20.6% Speak English less than very well57.3% of residents speak other language at home 745 76.0% Speak English very well235 24.0% Speak English less than very well
White (Caucasian) - Speak only English Native:
91.9% (11,275)Foreign-born:
41.3% (96)
White (Caucasian) - Speak another language Native:
7.4% (913)Foreign-born:
63.2% (147)
Black or African American - Speak only English Native:
93.8% (4,105)Foreign-born:
24.0% (100)
Black or African American - Speak another language Native:
6.1% (265)Foreign-born:
80.1% (335)
Asian - Speak only English Native:
63.4% (396)Foreign-born:
9.7% (46)
Asian - Speak another language Native:
30.5% (191)Foreign-born:
91.4% (435)
Native Hawaiian / Pacific Islander - Speak only English Native:
60.1% (224)Foreign-born:
19.4% (12)
Native Hawaiian / Pacific Islander - Speak another language Native:
40.6% (152)Foreign-born:
73.1% (46)
Other race - Speak only English Native:
32.4% (395)Foreign-born:
18.3% (41)
Other race - Speak another language Native:
64.3% (783)Foreign-born:
71.0% (160)
Two or more races - Speak another language Native:
32.8% (790)Foreign-born:
97.7% (268)
White alone - Speak only English Native:
97.2% (10,627)Foreign-born:
39.3% (104)
White alone - Speak another language Native:
2.7% (296)Foreign-born:
60.7% (160)
Hispanic or Latino - Speak only English Native:
42.4% (2,021)Foreign-born:
7.6% (32)
Hispanic or Latino - Speak another language Native:
59.1% (2,820)Foreign-born:
92.4% (391)
Foreign-born residents in Fort Hood 1,491 residents are foreign born (2.4% Latin America , 1.8% Asia , 0.7% Europe , 0.6% Africa ).
This city:
5.6%Texas:
17.1%
Marital status for residents in Fort Hood Marital status - White (Caucasian) population 15 years and over
Males 68.6% Never married28.3% Now married0.2% Separated0.0% Widowed2.8% DivorcedFemales 22.6% Never married73.2% Now married0.6% Separated2.8% Widowed0.9% DivorcedWomen who gave birth in the past 12 months Now married:
98.2% (409)Unmarried:
1.8% (8)
Women who did not give birth in the past 12 months Now married:
69.8% (1,711)Unmarried:
30.2% (739)
Marital status - Black or African American population 15 years and over
Males 71.1% Never married28.7% Now married0.0% Separated0.0% Widowed0.2% DivorcedFemales 38.5% Never married51.3% Now married1.2% Separated0.0% Widowed8.9% DivorcedWomen who gave birth in the past 12 months Now married:
89.2% (97)Unmarried:
10.8% (12)
Women who did not give birth in the past 12 months Now married:
48.8% (504)Unmarried:
51.2% (529)
Marital status - American Indian / Alaska Native population 15 years and over
Males 68.1% Never married31.9% Now married0.0% Separated0.0% Widowed0.0% DivorcedFemales 38.7% Never married37.8% Now married0.0% Separated0.0% Widowed23.5% DivorcedWomen who gave birth in the past 12 months Now married:
100.0% (13)Unmarried:
0.0% (0)
Women who did not give birth in the past 12 months Now married:
35.6% (52)Unmarried:
64.4% (93)
Marital status - Asian population 15 years and over
Males 60.2% Never married38.3% Now married1.4% Separated0.0% Widowed0.0% DivorcedFemales 18.4% Never married76.0% Now married0.0% Separated0.0% Widowed5.6% DivorcedWomen who gave birth in the past 12 months Now married:
100.0% (40)Unmarried:
0.0% (0)
Women who did not give birth in the past 12 months Now married:
69.6% (201)Unmarried:
30.4% (88)
Marital status - Native Hawaiian / Pacific Islander population 15 years and over
Males 65.0% Never married35.0% Now married0.0% Separated0.0% Widowed0.0% DivorcedFemales 0.0% Never married97.2% Now married0.0% Separated0.0% Widowed2.8% DivorcedWomen who gave birth in the past 12 months Now married:
100.0% (16)Unmarried:
0.0% (0)
Women who did not give birth in the past 12 months Now married:
96.6% (69)Unmarried:
3.4% (2)
Marital status - Other race population 15 years and over
Males 65.3% Never married33.3% Now married1.4% Separated0.0% Widowed0.0% DivorcedFemales 30.9% Never married64.6% Now married0.0% Separated0.0% Widowed4.5% DivorcedWomen who gave birth in the past 12 months Now married:
100.0% (46)Unmarried:
0.0% (0)
Women who did not give birth in the past 12 months Now married:
61.3% (298)Unmarried:
38.7% (188)
Marital status - Two or more races population 15 years and over
Males 60.8% Never married36.6% Now married0.2% Separated0.0% Widowed2.4% DivorcedFemales 20.1% Never married78.9% Now married0.0% Separated1.0% Widowed0.0% DivorcedWomen who gave birth in the past 12 months Now married:
100.0% (116)Unmarried:
0.0% (0)
Women who did not give birth in the past 12 months Now married:
73.9% (363)Unmarried:
26.1% (128)
Marital status - White alone, not Hispanic / Latino population 15 years and over
Males 68.2% Never married28.2% Now married0.1% Separated0.0% Widowed3.5% DivorcedFemales 21.6% Never married74.3% Now married0.7% Separated2.7% Widowed0.7% DivorcedWomen who gave birth in the past 12 months Now married:
97.8% (372)Unmarried:
2.2% (8)
Women who did not give birth in the past 12 months Now married:
70.8% (1,542)Unmarried:
29.2% (635)
Marital status - Hispanic or Latino population 15 years and over
Males 67.4% Never married31.8% Now married0.5% Separated0.0% Widowed0.3% DivorcedFemales 26.2% Never married67.2% Now married0.0% Separated1.8% Widowed4.8% DivorcedWomen who gave birth in the past 12 months Now married:
96.0% (129)Unmarried:
4.0% (5)
Women who did not give birth in the past 12 months Now married:
65.8% (805)Unmarried:
34.2% (418)
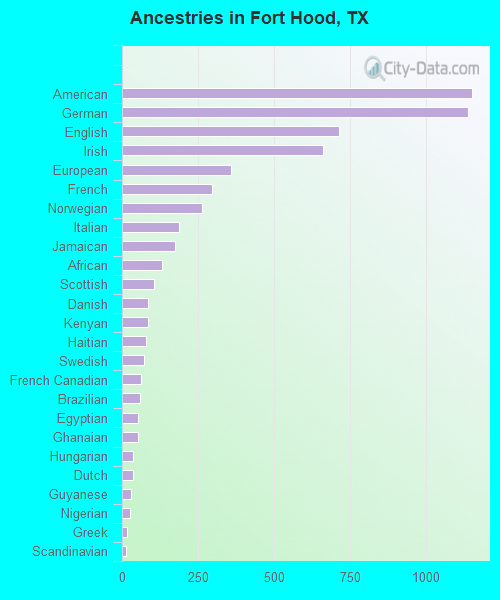
Ancestries in Fort Hood
1,150 7.7% American1,139 7.6% German714 4.8% English662 4.4% Irish360 2.4% European295 2.0% French263 1.8% Norwegian188 1.3% Italian176 1.2% Jamaican130 0.9% African104 0.7% Scottish87 0.6% Danish85 0.6% Kenyan79 0.5% Haitian72 0.5% Swedish64 0.4% French Canadian59 0.4% Brazilian54 0.4% Egyptian53 0.4% Ghanaian37 0.2% Hungarian35 0.2% Dutch28 0.2% Guyanese27 0.2% Nigerian15 0.1% Greek14 0.09% Scandinavian12 0.08% Czechoslovakian12 0.08% Polish12 0.08% Soviet Union11 0.07% Ukrainian10 0.07% Czech10 0.07% Finnish8 0.05% Arab8 0.05% Romanian7 0.05% Northern European6 0.04% Serbian5 0.03% British5 0.03% Scotch-Irish2 0.01% Portuguese
Geographical mobility in Fort Hood Same house 1 year ago 7,267 53.3% White (Caucasian)3,465 67.7% Black or African American378 86.8% American Indian / Alaska Native625 61.4% Asian211 42.3% Native Hawaiian / Pacific Islander832 53.7% Other race2,223 70.3% Two or more races6,676 55.1% White alone, not Hispanic / Latino3,361 56.8% Hispanic or LatinoMoved within same county 896 6.6% White / Caucasian194 3.8% Black or African American8 1.9% American Indian / Alaska Native25 2.4% Asian206 13.3% Other race208 6.6% Two or more races581 4.8% White alone, not Hispanic / Latino833 14.1% Hispanic or LatinoMoved within same state 925 6.8% White / Caucasian347 6.8% Black or African American6 1.5% American Indian / Alaska Native15 1.5% Asian84 16.9% Native Hawaiian / Pacific Islander50 3.2% Other race82 2.6% Two or more races819 6.8% White alone, not Hispanic / Latino311 5.2% Hispanic or LatinoMoved from different state 3,809 27.9% White / Caucasian913 17.8% Black or African American54 12.4% American Indian / Alaska Native254 25.0% Asian224 44.9% Native Hawaiian / Pacific Islander220 14.2% Other race642 20.3% Two or more races2,998 24.7% White alone, not Hispanic / Latino1,235 20.9% Hispanic or LatinoMoved from abroad 1,902 13.9% White53 1.0% Black or African American92 9.1% Asian62 12.5% Native Hawaiian / Pacific Islander52 3.4% Other race132 4.2% Two or more races823 6.8% White alone, not Hispanic / Latino223 3.8% Hispanic or Latino
Children Nativity (place of birth) in Fort Hood
Children under 6 years - Living with two parents Both parents native 2,745 100.0% NativeBoth parents foreign-born 146 100.0% NativeOne native, one foreign-born parent 311 100.0% NativeChildren under 6 years - Living with one parent Native parent 290 100.0% NativeForeign-born parent 12 100.0% NativeChildren 6 to 17 years - Living with two parents Both parents native 1,667 98.8% Native21 1.2% Foreign-bornBoth parents foreign-born 218 88.9% Native27 11.1% Foreign-bornOne native, one foreign-born parent 259 89.6% Native30 10.4% Foreign-bornChildren 6 to 17 years - Living with one parent Native parent 391 100.0% NativeForeign-born parent 21 56.5% Native16 43.5% Foreign-born
Grandparents responsible for own grandchildren in Fort Hood
Grandparents (30 to 59 years) White / Caucasian 11 49.5% Responsible for grandchildren11 50.5% Not responsible for grandchildrenBlack or African American 28 100.0% Not responsible for grandchildrenWhite alone, not Hispanic / Latino 4 100.0% Not responsible for grandchildrenHispanic or Latino 11 23.2% Responsible for grandchildren38 76.8% Not responsible for grandchildren
Grandparents (60 years and over) White / Caucasian 5 100.0% Not responsible for grandchildrenBlack or African American 42 100.0% Not responsible for grandchildrenHispanic or Latino 19 100.0% Not responsible for grandchildren