Races in Farmers Branch, Texas (TX) Detailed Stats
Data:
Races - White alone (%)
Races - White alone (% change since 2000)
Races - Black alone (%)
Races - Black alone (% change since 2000)
Races - American Indian alone (%)
Races - American Indian alone (% change since 2000)
Races - Asian alone (%)
Races - Asian alone (% change since 2000)
Races - Hispanic (%)
Races - Hispanic (% change since 2000)
Races - Native Hawaiian and Other Pacific Islander alone (%)
Races - Native Hawaiian and Other Pacific Islander alone (% change since 2000)
Races - Two or more races(%)
Races - Two or more races(% change since 2000)
Races - Other race alone (%)
Races - Other race alone (% change since 2000)
Racial diversity
Place of birth - Born in state of residence (%)
Place of birth - Born in state of residence (%) - White
Place of birth - Born in state of residence (%) - Black or African American
Place of birth - Born in state of residence (%) - Asian
Place of birth - Born in state of residence (%) - Hispanic or Latino
Place of birth - Born in state of residence (%) - American Indian and Alaska Native
Place of birth - Born in state of residence (%) - Multirace
Place of birth - Born in state of residence (%) - Other Race
Place of birth - Born in other state (%)
Place of birth - Born in other state (%) - White
Place of birth - Born in other state (%) - Black or African American
Place of birth - Born in other state (%) - Asian
Place of birth - Born in other state (%) - Hispanic or Latino
Place of birth - Born in other state (%) - American Indian and Alaska Native
Place of birth - Born in other state (%) - Multirace
Place of birth - Born in other state (%) - Other Race
Place of birth - Native, outside of US (%)
Place of birth - Native, outside of US (%) - White
Place of birth - Native, outside of US (%) - Black or African American
Place of birth - Native, outside of US (%) - Asian
Place of birth - Native, outside of US (%) - Hispanic or Latino
Place of birth - Native, outside of US (%) - American Indian and Alaska Native
Place of birth - Native, outside of US (%) - Multirace
Place of birth - Native, outside of US (%) - Other Race
Place of birth - Foreign born (%)
Place of birth - Foreign born (%) - White
Place of birth - Foreign born (%) - Black or African American
Place of birth - Foreign born (%) - Asian
Place of birth - Foreign born (%) - Hispanic or Latino
Place of birth - Foreign born (%) - American Indian and Alaska Native
Place of birth - Foreign born (%) - Multirace
Place of birth - Foreign born (%) - Other Race
Residents speaking English at home (%)
Residents speaking English at home - Born in the United States (%)
Residents speaking English at home - Native, born elsewhere (%)
Residents speaking English at home - Foreign born (%)
Residents speaking Spanish at home (%)
Residents speaking Spanish at home - Born in the United States (%)
Residents speaking Spanish at home - Native, born elsewhere (%)
Residents speaking Spanish at home - Foreign born (%)
Residents speaking other language at home (%)
Residents speaking other language at home - Born in the United States (%)
Residents speaking other language at home - Native, born elsewhere (%)
Residents speaking other language at home - Foreign born (%)
Marital status - Never married (%)
Marital status - Now married (%)
Marital status - Separated (%)
Marital status - Widowed (%)
Marital status - Divorced (%)
Ancestries Reported - Arab (%)
Ancestries Reported - Czech (%)
Ancestries Reported - Danish (%)
Ancestries Reported - Dutch (%)
Ancestries Reported - English (%)
Ancestries Reported - French (%)
Ancestries Reported - French Canadian (%)
Ancestries Reported - German (%)
Ancestries Reported - Greek (%)
Ancestries Reported - Hungarian (%)
Ancestries Reported - Irish (%)
Ancestries Reported - Italian (%)
Ancestries Reported - Lithuanian (%)
Ancestries Reported - Norwegian (%)
Ancestries Reported - Polish (%)
Ancestries Reported - Portuguese (%)
Ancestries Reported - Russian (%)
Ancestries Reported - Scotch-Irish (%)
Ancestries Reported - Scottish (%)
Ancestries Reported - Slovak (%)
Ancestries Reported - Subsaharan African (%)
Ancestries Reported - Swedish (%)
Ancestries Reported - Swiss (%)
Ancestries Reported - Ukrainian (%)
Ancestries Reported - United States (%)
Ancestries Reported - Welsh (%)
Ancestries Reported - West Indian (%)
Ancestries Reported - Other (%)
Geographical mobility - Same house 1 year ago (%)
Geographical mobility - Same house 1 year ago (%) - White
Geographical mobility - Same house 1 year ago (%) - Black or African American
Geographical mobility - Same house 1 year ago (%) - Asian
Geographical mobility - Same house 1 year ago (%) - Hispanic or Latino
Geographical mobility - Same house 1 year ago (%) - American Indian and Alaska Native
Geographical mobility - Same house 1 year ago (%) - Multirace
Geographical mobility - Same house 1 year ago (%) - Other Race
Geographical mobility - Moved within same county (%)
Geographical mobility - Moved within same county (%) - White
Geographical mobility - Moved within same county (%) - Black or African American
Geographical mobility - Moved within same county (%) - Asian
Geographical mobility - Moved within same county (%) - Hispanic or Latino
Geographical mobility - Moved within same county (%) - American Indian and Alaska Native
Geographical mobility - Moved within same county (%) - Multirace
Geographical mobility - Moved within same county (%) - Other Race
Geographical mobility - Moved from different county within same state (%)
Geographical mobility - Moved from different county within same state (%) - White
Geographical mobility - Moved from different county within same state (%) - Black or African American
Geographical mobility - Moved from different county within same state (%) - Asian
Geographical mobility - Moved from different county within same state (%) - Hispanic or Latino
Geographical mobility - Moved from different county within same state (%) - American Indian and Alaska Native
Geographical mobility - Moved from different county within same state (%) - Multirace
Geographical mobility - Moved from different county within same state (%) - Other Race
Geographical mobility - Moved from different state (%)
Geographical mobility - Moved from different state (%) - White
Geographical mobility - Moved from different state (%) - Black or African American
Geographical mobility - Moved from different state (%) - Asian
Geographical mobility - Moved from different state (%) - Hispanic or Latino
Geographical mobility - Moved from different state (%) - American Indian and Alaska Native
Geographical mobility - Moved from different state (%) - Multirace
Geographical mobility - Moved from different state (%) - Other Race
Geographical mobility - Moved from abroad (%)
Geographical mobility - Moved from abroad (%) - White
Geographical mobility - Moved from abroad (%) - Black or African American
Geographical mobility - Moved from abroad (%) - Asian
Geographical mobility - Moved from abroad (%) - Hispanic or Latino
Geographical mobility - Moved from abroad (%) - American Indian and Alaska Native
Geographical mobility - Moved from abroad (%) - Multirace
Geographical mobility - Moved from abroad (%) - Other Race
Place of birth for the foreign-born population - Ireland (%)
Place of birth for the foreign-born population - Denmark (%)
Place of birth for the foreign-born population - Norway (%)
Place of birth for the foreign-born population - Sweden (%)
Place of birth for the foreign-born population - United Kingdom (%)
Place of birth for the foreign-born population - England (%)
Place of birth for the foreign-born population - Scotland (%)
Place of birth for the foreign-born population - Other Northern Europe (%)
Place of birth for the foreign-born population - Austria (%)
Place of birth for the foreign-born population - Belgium (%)
Place of birth for the foreign-born population - France (%)
Place of birth for the foreign-born population - Germany (%)
Place of birth for the foreign-born population - Netherlands (%)
Place of birth for the foreign-born population - Switzerland (%)
Place of birth for the foreign-born population - Other Western Europe (%)
Place of birth for the foreign-born population - Greece (%)
Place of birth for the foreign-born population - Italy (%)
Place of birth for the foreign-born population - Portugal (%)
Place of birth for the foreign-born population - Spain (%)
Place of birth for the foreign-born population - Other Southern Europe (%)
Place of birth for the foreign-born population - Albania (%)
Place of birth for the foreign-born population - Belarus (%)
Place of birth for the foreign-born population - Bosnia and Herzegovina (%)
Place of birth for the foreign-born population - Bulgaria (%)
Place of birth for the foreign-born population - Croatia (%)
Place of birth for the foreign-born population - Czechoslovakia (%)
Place of birth for the foreign-born population - Hungary (%)
Place of birth for the foreign-born population - Latvia (%)
Place of birth for the foreign-born population - Lithuania (%)
Place of birth for the foreign-born population - North Macedonia (Macedonia) (%)
Place of birth for the foreign-born population - Moldova (%)
Place of birth for the foreign-born population - Poland (%)
Place of birth for the foreign-born population - Romania (%)
Place of birth for the foreign-born population - Russia (%)
Place of birth for the foreign-born population - Serbia (%)
Place of birth for the foreign-born population - Ukraine (%)
Place of birth for the foreign-born population - Other Eastern Europe (%)
Place of birth for the foreign-born population - China (%)
Place of birth for the foreign-born population - Hong Kong (%)
Place of birth for the foreign-born population - Taiwan (%)
Place of birth for the foreign-born population - Japan (%)
Place of birth for the foreign-born population - Korea (%)
Place of birth for the foreign-born population - Other Eastern Asia (%)
Place of birth for the foreign-born population - Afghanistan (%)
Place of birth for the foreign-born population - Bangladesh (%)
Place of birth for the foreign-born population - India (%)
Place of birth for the foreign-born population - Iran (%)
Place of birth for the foreign-born population - Kazakhstan (%)
Place of birth for the foreign-born population - Nepal (%)
Place of birth for the foreign-born population - Pakistan (%)
Place of birth for the foreign-born population - Sri Lanka (%)
Place of birth for the foreign-born population - Uzbekistan (%)
Place of birth for the foreign-born population - Other South Central Asia (%)
Place of birth for the foreign-born population - Burma (%)
Place of birth for the foreign-born population - Cambodia (%)
Place of birth for the foreign-born population - Indonesia (%)
Place of birth for the foreign-born population - Laos (%)
Place of birth for the foreign-born population - Malaysia (%)
Place of birth for the foreign-born population - Philippines (%)
Place of birth for the foreign-born population - Singapore (%)
Place of birth for the foreign-born population - Thailand (%)
Place of birth for the foreign-born population - Vietnam (%)
Place of birth for the foreign-born population - Other South Eastern Asia (%)
Place of birth for the foreign-born population - Armenia (%)
Place of birth for the foreign-born population - Iraq (%)
Place of birth for the foreign-born population - Israel (%)
Place of birth for the foreign-born population - Jordan (%)
Place of birth for the foreign-born population - Kuwait (%)
Place of birth for the foreign-born population - Lebanon (%)
Place of birth for the foreign-born population - Saudi Arabia (%)
Place of birth for the foreign-born population - Syria (%)
Place of birth for the foreign-born population - Turkey (%)
Place of birth for the foreign-born population - Yemen (%)
Place of birth for the foreign-born population - Other Western Asia (%)
Place of birth for the foreign-born population - Eritrea (%)
Place of birth for the foreign-born population - Ethiopia (%)
Place of birth for the foreign-born population - Kenya (%)
Place of birth for the foreign-born population - Somalia (%)
Place of birth for the foreign-born population - Uganda (%)
Place of birth for the foreign-born population - Zimbabwe (%)
Place of birth for the foreign-born population - Other Eastern Africa (%)
Place of birth for the foreign-born population - Cameroon (%)
Place of birth for the foreign-born population - Congo (%)
Place of birth for the foreign-born population - Democratic Republic of Congo (Zaire) (%)
Place of birth for the foreign-born population - Other Middle Africa (%)
Place of birth for the foreign-born population - Egypt (%)
Place of birth for the foreign-born population - Morocco (%)
Place of birth for the foreign-born population - Sudan (%)
Place of birth for the foreign-born population - Other Northern Africa (%)
Place of birth for the foreign-born population - South Africa (%)
Place of birth for the foreign-born population - Other Southern Africa (%)
Place of birth for the foreign-born population - Cabo Verde (%)
Place of birth for the foreign-born population - Ghana (%)
Place of birth for the foreign-born population - Liberia (%)
Place of birth for the foreign-born population - Nigeria (%)
Place of birth for the foreign-born population - Senegal (%)
Place of birth for the foreign-born population - Sierra Leone (%)
Place of birth for the foreign-born population - Other Western Africa (%)
Place of birth for the foreign-born population - Australia (%)
Place of birth for the foreign-born population - New Zealand (%)
Place of birth for the foreign-born population - Fiji (%)
Place of birth for the foreign-born population - Micronesia (%)
Place of birth for the foreign-born population - Bahamas (%)
Place of birth for the foreign-born population - Barbados (%)
Place of birth for the foreign-born population - Cuba (%)
Place of birth for the foreign-born population - Dominica (%)
Place of birth for the foreign-born population - Dominican Republic (%)
Place of birth for the foreign-born population - Grenada (%)
Place of birth for the foreign-born population - Haiti (%)
Place of birth for the foreign-born population - Jamaica (%)
Place of birth for the foreign-born population - St. Vincent and the Grenadines (%)
Place of birth for the foreign-born population - Trinidad and Tobago (%)
Place of birth for the foreign-born population - West Indies (%)
Place of birth for the foreign-born population - Other Caribbean (%)
Place of birth for the foreign-born population - Belize (%)
Place of birth for the foreign-born population - Costa Rica (%)
Place of birth for the foreign-born population - El Salvador (%)
Place of birth for the foreign-born population - Guatemala (%)
Place of birth for the foreign-born population - Honduras (%)
Place of birth for the foreign-born population - Mexico (%)
Place of birth for the foreign-born population - Nicaragua (%)
Place of birth for the foreign-born population - Panama (%)
Place of birth for the foreign-born population - Other Central America (%)
Place of birth for the foreign-born population - Argentina (%)
Place of birth for the foreign-born population - Bolivia (%)
Place of birth for the foreign-born population - Brazil (%)
Place of birth for the foreign-born population - Chile (%)
Place of birth for the foreign-born population - Colombia (%)
Place of birth for the foreign-born population - Ecuador (%)
Place of birth for the foreign-born population - Guyana (%)
Place of birth for the foreign-born population - Peru (%)
Place of birth for the foreign-born population - Uruguay (%)
Place of birth for the foreign-born population - Venezuela (%)
Place of birth for the foreign-born population - Other South America (%)
Place of birth for the foreign-born population - Canada (%)
Place of birth for the foreign-born population - Other Northern America (%)
Place of birth for the foreign-born population - Other (%)
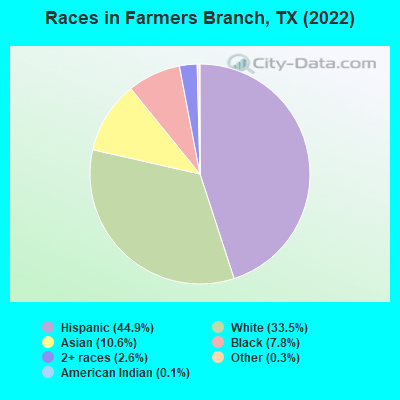
According to 2022 data, the most numerous races in Farmers Branch, TX are Hispanic (16,130 residents), White alone (12,055 residents), and Black alone (2,813 residents). 52.0% of Farmers Branch residents speak English at home. 31.6% of Farmers Branch, TX residents are foreign-born (20.2% born in Latin America, 7.8% born in Asia), which is 46.2% greater than the foreign-born rate of 17.0% across the entire state of Texas.
Race distribution in Farmers Branch
2000 2022
10,933,313 52.4% White alone 6,669,666 32.0% Hispanic 2,364,255 11.3% Black alone 554,445 2.7% Asian alone 230,567 1.1% Two or more races 68,859 0.3% American Indian alone 19,958 0.10% Other race alone 10,757 0.05% Native Hawaiian and Other
12,070,642 40.2% Hispanic 11,683,430 38.9% White alone 3,508,706 11.7% Black alone 1,608,173 5.4% Asian alone 956,560 3.2% Two or more races 125,763 0.4% Other race alone 47,023 0.2% American Indian alone 29,275 0.10% Native Hawaiian and Other
Income and house value in Farmers Branch Median household income in 2022 $97,772 White non-Hispanic householders$68,703 Black householders$77,602 American Indian and Alaska Native householders$131,137 Asian householders$59,155 Some other race householders$77,915 Two or more races householders$71,600 Hispanic or Latino race householdersMedian 2022 house value $381,178 White Non-Hispanic householders$276,459 Black or African American householders$282,044 American Indian or Alaska Native householders $368,961 Asian householders$290,770 Some other race householders$350,461 Two or more races householders$280,997 Hispanic or Latino householders
Median age by race in Farmers Branch
38.1 Median age for White residents35.6 41.2 33.8 Median age for Black or African American residents30.0 37.5 41.1 Median age for American Indian / Alaska Native residents38.3 40.4 34.3 Median age for Asian residents35.1 32.5 -711,469,533.3 Median age for Native Hawaiian / Pacific Islander residents-815,813,116.9 -464,594,127.3 31.3 Median age for Other race residents29.2 31.9 31.5 Median age for Two or more races residents30.0 32.3 43.3 Median age for White alone residents39.5 48.0 30.2 Median age for Hispanic or Latino residents27.4 32.3
Owner/renter occupied households by race in Farmers Branch
House owners and renters - White residents 4,528 60.7% Owner occupied2,938 39.3% Renter occupiedHouse owners and renters - Black or African American residents 169 9.5% Owner occupied1,614 90.5% Renter occupiedHouse owners and renters - American Indian / Alaska Native residents 134 81.9% Owner occupied30 18.1% Renter occupiedHouse owners and renters - Asian residents 684 37.1% Owner occupied1,161 62.9% Renter occupiedHouse owners and renters - Other race residents 332 38.2% Owner occupied537 61.8% Renter occupiedHouse owners and renters - Two or more races residents 753 35.9% Owner occupied1,346 64.1% Renter occupiedHouse owners and renters - White alone residents 3,900 62.7% Owner occupied2,318 37.3% Renter occupiedHouse owners and renters - Hispanic or Latino residents 2,258 48.1% Owner occupied2,433 51.9% Renter occupied
Language usage in Farmers Branch
English speakers - Total 52.0% of residents of Farmers Branch speak English at home.
37.7% of residents speak Spanish at home 7,414 57.9% Speak English very well5,394 42.1% Speak English less than very well10.3% of residents speak other language at home 2,644 75.9% Speak English very well839 24.1% Speak English less than very well
English speakers - Born in the United States 84.6% of residents of Farmers Branch speak English at home.
13.7% of residents speak Spanish at home 892 77.4% Speak English very well260 22.6% Speak English less than very well2.2% of residents speak other language at home 182 100.0% Speak English very well
English speakers - Native, born elsewhere 50.1% of residents of Farmers Branch speak English at home.
31.5% of residents speak Spanish at home 140 84.8% Speak English very well25 15.2% Speak English less than very well16.8% of residents speak other language at home 55 62.5% Speak English very well33 37.5% Speak English less than very well
English speakers - Foreign-born 9.0% of residents of Farmers Branch speak English at home.
64.0% of residents speak Spanish at home 2,132 31.1% Speak English very well4,730 68.9% Speak English less than very well27.5% of residents speak other language at home 2,180 73.9% Speak English very well770 26.1% Speak English less than very well
White (Caucasian) - Speak only English Native:
86.0% (11,750)Foreign-born:
10.1% (236)
White (Caucasian) - Speak another language Native:
13.3% (1,812)Foreign-born:
82.8% (1,931)
Black or African American - Speak only English Native:
97.5% (2,411)Foreign-born:
24.1% (107)
Black or African American - Speak another language Native:
2.5% (62)Foreign-born:
76.1% (340)
American Indian / Alaska Native - Speak another language Native:
62.8% (142)Foreign-born:
100.0% (150)
Asian - Speak only English Native:
41.1% (317)Foreign-born:
14.2% (399)
Asian - Speak another language Native:
59.4% (458)Foreign-born:
85.7% (2,415)
Other race - Speak only English Native:
17.0% (243)Foreign-born:
1.7% (30)
Other race - Speak another language Native:
82.9% (1,186)Foreign-born:
98.3% (1,715)
Two or more races - Speak only English Native:
50.2% (1,481)Foreign-born:
6.9% (137)
Two or more races - Speak another language Native:
48.2% (1,421)Foreign-born:
93.3% (1,863)
White alone - Speak only English Native:
96.6% (10,737)Foreign-born:
35.1% (142)
White alone - Speak another language Native:
3.5% (385)Foreign-born:
64.7% (261)
Hispanic or Latino - Speak only English Native:
30.7% (2,449)Foreign-born:
3.7% (261)
Hispanic or Latino - Speak another language Native:
69.4% (5,546)Foreign-born:
96.1% (6,821)
Foreign-born residents in Farmers Branch 11,351 residents are foreign born (20.2% Latin America , 7.8% Asia ).
This city:
31.6%Texas:
17.1%
Marital status for residents in Farmers Branch Marital status - White (Caucasian) population 15 years and over
Males 38.7% Never married49.5% Now married2.2% Separated2.1% Widowed7.5% DivorcedFemales 29.8% Never married44.8% Now married3.2% Separated6.1% Widowed16.0% DivorcedWomen who gave birth in the past 12 months Now married:
77.1% (203)Unmarried:
22.9% (60)
Women who did not give birth in the past 12 months Now married:
43.5% (1,584)Unmarried:
56.5% (2,060)
Marital status - Black or African American population 15 years and over
Males 69.3% Never married21.2% Now married0.0% Separated1.1% Widowed8.5% DivorcedFemales 46.0% Never married21.6% Now married2.0% Separated2.7% Widowed27.7% DivorcedWomen who gave birth in the past 12 months Now married:
100.0% (34)Unmarried:
0.0% (0)
Women who did not give birth in the past 12 months Now married:
17.7% (182)Unmarried:
82.3% (846)
Marital status - American Indian / Alaska Native population 15 years and over
Males 21.7% Never married70.8% Now married0.0% Separated0.0% Widowed7.5% DivorcedFemales 21.4% Never married75.0% Now married0.0% Separated0.0% Widowed3.6% DivorcedWomen who did not give birth in the past 12 months Now married:
77.8% (81)Unmarried:
22.2% (23)
Marital status - Asian population 15 years and over
Males 32.5% Never married61.0% Now married2.9% Separated0.1% Widowed3.5% DivorcedFemales 29.1% Never married60.4% Now married0.0% Separated3.6% Widowed6.9% DivorcedWomen who gave birth in the past 12 months Now married:
100.0% (128)Unmarried:
0.0% (0)
Women who did not give birth in the past 12 months Now married:
59.9% (645)Unmarried:
40.1% (432)
Marital status - Other race population 15 years and over
Males 37.1% Never married47.8% Now married1.7% Separated3.2% Widowed10.2% DivorcedFemales 30.5% Never married52.8% Now married2.1% Separated9.0% Widowed5.6% DivorcedWomen who gave birth in the past 12 months Now married:
0.0% (0)Unmarried:
100.0% (19)
Women who did not give birth in the past 12 months Now married:
61.1% (536)Unmarried:
38.9% (341)
Marital status - Two or more races population 15 years and over
Males 44.1% Never married47.7% Now married1.1% Separated0.5% Widowed6.6% DivorcedFemales 46.9% Never married38.2% Now married0.8% Separated4.5% Widowed9.6% DivorcedWomen who gave birth in the past 12 months Now married:
45.5% (17)Unmarried:
54.5% (20)
Women who did not give birth in the past 12 months Now married:
28.4% (470)Unmarried:
71.6% (1,182)
Marital status - White alone, not Hispanic / Latino population 15 years and over
Males 36.4% Never married49.2% Now married1.4% Separated2.5% Widowed10.5% DivorcedFemales 25.4% Never married47.5% Now married0.9% Separated8.5% Widowed17.7% DivorcedWomen who gave birth in the past 12 months Now married:
87.6% (95)Unmarried:
12.4% (13)
Women who did not give birth in the past 12 months Now married:
46.1% (1,135)Unmarried:
53.9% (1,328)
Marital status - Hispanic or Latino population 15 years and over
Males 39.6% Never married50.2% Now married3.5% Separated1.5% Widowed5.1% DivorcedFemales 37.1% Never married42.9% Now married4.8% Separated3.8% Widowed11.4% DivorcedWomen who gave birth in the past 12 months Now married:
67.6% (210)Unmarried:
32.4% (100)
Women who did not give birth in the past 12 months Now married:
42.2% (1,823)Unmarried:
57.8% (2,497)
Ancestries in Farmers Branch
1,403 6.2% English1,300 5.8% German542 2.4% American505 2.2% Irish372 1.7% Italian278 1.2% British217 1.0% Scottish195 0.9% African148 0.7% European136 0.6% Brazilian135 0.6% Nigerian98 0.4% Romanian79 0.4% Norwegian66 0.3% Egyptian65 0.3% French Canadian64 0.3% Dutch60 0.3% Swedish50 0.2% Scotch-Irish50 0.2% Scandinavian44 0.2% Polish42 0.2% Slavic40 0.2% Portuguese37 0.2% French36 0.2% Canadian35 0.2% Swiss31 0.1% Welsh29 0.1% Serbian29 0.1% Czechoslovakian23 0.1% Iraqi23 0.1% Iranian21 0.09% Czech17 0.08% Russian16 0.07% Celtic16 0.07% Greek13 0.06% Albanian13 0.06% Bulgarian13 0.06% Northern European13 0.06% Hungarian10 0.04% Maltese10 0.04% Finnish10 0.04% Eastern European7 0.03% Kenyan3 0.01% Danish
Geographical mobility in Farmers Branch Same house 1 year ago 14,129 85.7% White (Caucasian)2,223 75.0% Black or African American411 100.0% American Indian / Alaska Native2,599 69.0% Asian2,952 88.5% Other race4,113 81.3% Two or more races10,355 86.6% White alone, not Hispanic / Latino13,648 86.2% Hispanic or LatinoMoved within same county 1,459 8.8% White / Caucasian313 10.6% Black or African American238 6.3% Asian216 6.5% Other race640 12.6% Two or more races874 7.3% White alone, not Hispanic / Latino1,519 9.6% Hispanic or LatinoMoved within same state 548 3.3% White / Caucasian322 10.9% Black or African American2 0.5% American Indian / Alaska Native526 14.0% Asian73 2.2% Other race195 3.8% Two or more races438 3.7% White alone, not Hispanic / Latino364 2.3% Hispanic or LatinoMoved from different state 259 1.6% White / Caucasian135 4.6% Black or African American406 10.8% Asian26 0.8% Other race38 0.7% Two or more races273 2.3% White alone, not Hispanic / Latino42 0.3% Hispanic or LatinoMoved from abroad 31 0.2% White131 3.5% Asian66 2.0% Other race53 1.1% Two or more races167 1.1% Hispanic or Latino
Children Nativity (place of birth) in Farmers Branch
Children under 6 years - Living with two parents Both parents native 657 100.0% NativeBoth parents foreign-born 782 90.8% Native79 9.2% Foreign-bornOne native, one foreign-born parent 152 100.0% NativeChildren under 6 years - Living with one parent Native parent 584 100.0% NativeForeign-born parent 110 87.5% Native16 12.5% Foreign-bornChildren 6 to 17 years - Living with two parents Both parents native 1,035 100.0% NativeBoth parents foreign-born 1,162 75.2% Native384 24.8% Foreign-bornOne native, one foreign-born parent 408 60.5% Native267 39.5% Foreign-bornChildren 6 to 17 years - Living with one parent Native parent 938 100.0% NativeForeign-born parent 510 58.1% Native368 41.9% Foreign-born
Grandparents responsible for own grandchildren in Farmers Branch
Grandparents (30 to 59 years) White / Caucasian 36 71.1% Responsible for grandchildren15 28.9% Not responsible for grandchildrenBlack or African American 2 100.0% Not responsible for grandchildrenOther race 204 100.0% Not responsible for grandchildrenTwo or more races 22 100.0% Not responsible for grandchildrenWhite alone, not Hispanic / Latino 3 20.4% Responsible for grandchildren14 79.6% Not responsible for grandchildrenHispanic or Latino 69 32.0% Responsible for grandchildren145 68.0% Not responsible for grandchildrenGrandparents (60 years and over) White / Caucasian 50 31.0% Responsible for grandchildren111 69.0% Not responsible for grandchildrenBlack or African American 14 100.0% Responsible for grandchildrenOther race 98 100.0% Not responsible for grandchildrenTwo or more races 6 11.0% Responsible for grandchildren49 89.0% Not responsible for grandchildrenWhite alone, not Hispanic / Latino 17 29.3% Responsible for grandchildren42 70.7% Not responsible for grandchildrenHispanic or Latino 45 15.1% Responsible for grandchildren253 84.9% Not responsible for grandchildren