Races in Espanola, New Mexico (NM) Detailed Stats
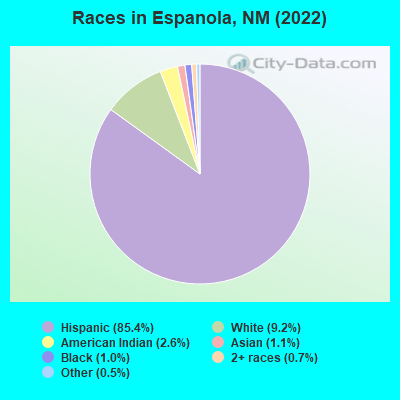
According to 2022 data, the most numerous races in Espanola, NM are Hispanic (8,951 residents), White alone (963 residents), and American Indian alone (275 residents). 40.8% of Espanola residents speak English at home. 12.6% of Espanola, NM residents are foreign-born (11.2% born in Latin America), which is 28.5% greater than the foreign-born rate of 9.0% across the entire state of New Mexico.
Race distribution in Espanola
2000 2022
813,495 44.7% White alone 765,386 42.1% Hispanic 161,460 8.9% American Indian alone 30,654 1.7% Black alone 25,793 1.4% Two or more races 18,257 1.0% Asian alone 3,009 0.2% Other race alone 992 0.05% Native Hawaiian and Other
1,059,867 50.2% Hispanic 735,478 34.8% White alone 171,808 8.1% American Indian alone 65,084 3.1% Two or more races 36,870 1.7% Black alone 35,870 1.7% Asian alone 7,582 0.4% Other race alone 785 0.04% Native Hawaiian and Other
Income and house value in Espanola Median household income in 2022 $47,560 White non-Hispanic householders$89,530 Black householders$45,240 American Indian and Alaska Native householders$123,893 Asian householders$39,057 Some other race householders$55,790 Two or more races householders$44,164 Hispanic or Latino race householdersMedian 2022 house value $327,565 White Non-Hispanic householders$66,013 Black or African American householders$274,981 American Indian or Alaska Native householders$241,519 Some other race householders$346,686 Two or more races householders$259,275 Hispanic or Latino householders
Median age by race in Espanola
39.1 Median age for White residents36.8 42.5 14.4 Median age for Black or African American residents18.0 12.7 25.1 Median age for American Indian / Alaska Native residents22.4 31.1 18.6 Median age for Asian residents18.3 22.4 -658,511,722.1 Median age for Native Hawaiian / Pacific Islander residents-685,897,435.2 -659,380,691.5 35.5 Median age for Other race residents33.8 36.3 38.9 Median age for Two or more races residents39.0 38.8 49.2 Median age for White alone residents41.7 53.8 36.2 Median age for Hispanic or Latino residents35.9 36.3
Owner/renter occupied households by race in Espanola
House owners and renters - White residents 851 65.3% Owner occupied452 34.7% Renter occupiedHouse owners and renters - Black or African American residents 1 6.6% Owner occupied18 93.4% Renter occupiedHouse owners and renters - American Indian / Alaska Native residents 24 20.8% Owner occupied92 79.2% Renter occupiedHouse owners and renters - Asian residents 7 25.9% Owner occupied21 74.1% Renter occupiedHouse owners and renters - Other race residents 1,803 73.2% Owner occupied659 26.8% Renter occupiedHouse owners and renters - Two or more races residents 456 69.8% Owner occupied197 30.2% Renter occupiedHouse owners and renters - White alone residents 248 56.5% Owner occupied191 43.5% Renter occupiedHouse owners and renters - Hispanic or Latino residents 2,436 71.1% Owner occupied990 28.9% Renter occupied
Language usage in Espanola
English speakers - Total 40.8% of residents of Espanola speak English at home.
53.9% of residents speak Spanish at home 4,392 81.6% Speak English very well991 18.4% Speak English less than very well3.2% of residents speak other language at home 290 90.9% Speak English very well29 9.1% Speak English less than very well
English speakers - Born in the United States 58.5% of residents of Espanola speak English at home.
37.5% of residents speak Spanish at home 451 87.9% Speak English very well62 12.1% Speak English less than very well3.1% of residents speak other language at home 43 100.0% Speak English very well
English speakers - Native, born elsewhere 86.2% of residents of Espanola speak English at home.
10.3% of residents speak Spanish at home 3 100.0% Speak English less than very well6.9% of residents speak other language at home 1 50.0% Speak English very well1 50.0% Speak English less than very well
English speakers - Foreign-born 5.7% of residents of Espanola speak English at home.
82.8% of residents speak Spanish at home 448 41.4% Speak English very well634 58.6% Speak English less than very well7.7% of residents speak other language at home 72 72.0% Speak English very well28 28.0% Speak English less than very well
White (Caucasian) - Speak only English Native:
66.4% (2,041)Foreign-born:
18.7% (14)
White (Caucasian) - Speak another language Native:
23.3% (715)Foreign-born:
100.0% (76)
Asian - Speak another language Native:
86.9% (19)Foreign-born:
98.1% (94)
Other race - Speak only English Native:
24.8% (1,186)Foreign-born:
5.2% (63)
Other race - Speak another language Native:
74.5% (3,560)Foreign-born:
94.4% (1,143)
Two or more races - Speak only English Native:
56.9% (776)Foreign-born:
5.1% (13)
Two or more races - Speak another language Native:
43.5% (593)Foreign-born:
93.7% (248)
White alone - Speak only English Native:
83.6% (799)Foreign-born:
100.0% (5)
Hispanic or Latino - Speak only English Native:
40.5% (2,969)Foreign-born:
4.0% (47)
Hispanic or Latino - Speak another language Native:
58.8% (4,305)Foreign-born:
94.1% (1,098)
Foreign-born residents in Espanola 1,319 residents are foreign born (11.2% Latin America ).
This city:
12.6%New Mexico:
9.2%
Marital status for residents in Espanola Marital status - White (Caucasian) population 15 years and over
Males 44.2% Never married37.1% Now married2.3% Separated3.1% Widowed13.3% DivorcedFemales 38.2% Never married34.4% Now married0.9% Separated11.1% Widowed15.4% DivorcedWomen who gave birth in the past 12 months Now married:
37.5% (14)Unmarried:
62.5% (23)
Women who did not give birth in the past 12 months Now married:
37.1% (218)Unmarried:
62.9% (370)
Marital status - Black or African American population 15 years and over
Males 24.2% Never married75.8% Now married0.0% Separated0.0% Widowed0.0% DivorcedFemales 63.6% Never married27.3% Now married0.0% Separated0.0% Widowed9.1% DivorcedWomen who did not give birth in the past 12 months Now married:
30.0% (3)Unmarried:
70.0% (7)
Marital status - American Indian / Alaska Native population 15 years and over
Males 85.1% Never married4.8% Now married0.0% Separated1.8% Widowed8.3% DivorcedFemales 57.5% Never married23.3% Now married0.0% Separated3.3% Widowed15.8% DivorcedWomen who did not give birth in the past 12 months Now married:
26.2% (21)Unmarried:
73.8% (60)
Marital status - Asian population 15 years and over
Males 63.3% Never married20.4% Now married0.0% Separated6.1% Widowed10.2% DivorcedFemales 45.5% Never married45.5% Now married0.0% Separated0.0% Widowed9.1% DivorcedWomen who gave birth in the past 12 months Now married:
100.0% (1)Unmarried:
0.0% (0)
Women who did not give birth in the past 12 months Now married:
29.4% (6)Unmarried:
70.6% (14)
Marital status - Other race population 15 years and over
Males 47.7% Never married31.1% Now married0.4% Separated10.6% Widowed10.2% DivorcedFemales 41.1% Never married26.6% Now married1.6% Separated11.3% Widowed19.4% DivorcedWomen who gave birth in the past 12 months Now married:
22.2% (9)Unmarried:
77.8% (30)
Women who did not give birth in the past 12 months Now married:
25.8% (419)Unmarried:
74.2% (1,207)
Marital status - Two or more races population 15 years and over
Males 34.7% Never married48.7% Now married1.3% Separated3.4% Widowed11.9% DivorcedFemales 39.3% Never married29.8% Now married2.8% Separated10.7% Widowed17.4% DivorcedWomen who gave birth in the past 12 months Now married:
40.0% (3)Unmarried:
60.0% (5)
Women who did not give birth in the past 12 months Now married:
36.3% (148)Unmarried:
63.7% (259)
Marital status - White alone, not Hispanic / Latino population 15 years and over
Males 33.5% Never married36.2% Now married4.9% Separated8.0% Widowed17.5% DivorcedFemales 38.3% Never married36.0% Now married0.7% Separated5.6% Widowed19.5% DivorcedWomen who gave birth in the past 12 months Now married:
100.0% (2)Unmarried:
0.0% (0)
Women who did not give birth in the past 12 months Now married:
36.6% (61)Unmarried:
63.4% (106)
Marital status - Hispanic or Latino population 15 years and over
Males 46.8% Never married34.5% Now married0.8% Separated6.8% Widowed11.0% DivorcedFemales 40.3% Never married29.7% Now married1.6% Separated12.0% Widowed16.4% DivorcedWomen who gave birth in the past 12 months Now married:
30.8% (24)Unmarried:
69.2% (55)
Women who did not give birth in the past 12 months Now married:
30.5% (619)Unmarried:
69.5% (1,410)
Ancestries in Espanola
271 3.0% American40 0.4% Italian37 0.4% English29 0.3% German22 0.2% British22 0.2% Irish14 0.2% African11 0.1% Scottish8 0.09% Barbadian7 0.08% Greek6 0.07% Scotch-Irish4 0.04% European4 0.04% Finnish3 0.03% Dutch3 0.03% French Canadian3 0.03% Russian2 0.02% Australian2 0.02% Danish2 0.02% Welsh
Children Nativity (place of birth) in Espanola
Children under 6 years - Living with two parents Both parents native 287 100.0% NativeBoth parents foreign-born 16 100.0% NativeOne native, one foreign-born parent 37 100.0% NativeChildren under 6 years - Living with one parent Native parent 322 100.0% NativeForeign-born parent 15 100.0% NativeChildren 6 to 17 years - Living with two parents Both parents native 732 99.8% Native2 0.2% Foreign-bornBoth parents foreign-born 107 53.6% Native92 46.4% Foreign-bornOne native, one foreign-born parent 34 100.0% NativeChildren 6 to 17 years - Living with one parent Native parent 611 100.0% NativeForeign-born parent 111 51.9% Native103 48.1% Foreign-born
Grandparents responsible for own grandchildren in Espanola
Grandparents (30 to 59 years) White / Caucasian 23 84.1% Responsible for grandchildren4 15.9% Not responsible for grandchildrenAmerican Indian / Alaska Native 4 100.0% Responsible for grandchildrenOther race 3 5.3% Responsible for grandchildren48 94.7% Not responsible for grandchildrenTwo or more races 3 50.7% Responsible for grandchildren3 49.3% Not responsible for grandchildrenWhite alone, not Hispanic / Latino 14 78.5% Responsible for grandchildren4 21.5% Not responsible for grandchildrenHispanic or Latino 9 23.2% Responsible for grandchildren31 76.8% Not responsible for grandchildrenGrandparents (60 years and over) White / Caucasian 21 31.6% Responsible for grandchildren45 68.4% Not responsible for grandchildrenAmerican Indian / Alaska Native 4 35.0% Responsible for grandchildren7 65.0% Not responsible for grandchildrenOther race 68 65.4% Responsible for grandchildren36 34.6% Not responsible for grandchildrenTwo or more races 6 4.9% Responsible for grandchildren108 95.1% Not responsible for grandchildrenWhite alone, not Hispanic / Latino 4 100.0% Responsible for grandchildrenHispanic or Latino 90 38.8% Responsible for grandchildren142 61.2% Not responsible for grandchildren