Races in East Rutherford, New Jersey (NJ) Detailed Stats
Data:
Races - White alone (%)
Races - White alone (% change since 2000)
Races - Black alone (%)
Races - Black alone (% change since 2000)
Races - American Indian alone (%)
Races - American Indian alone (% change since 2000)
Races - Asian alone (%)
Races - Asian alone (% change since 2000)
Races - Hispanic (%)
Races - Hispanic (% change since 2000)
Races - Native Hawaiian and Other Pacific Islander alone (%)
Races - Native Hawaiian and Other Pacific Islander alone (% change since 2000)
Races - Two or more races(%)
Races - Two or more races(% change since 2000)
Races - Other race alone (%)
Races - Other race alone (% change since 2000)
Racial diversity
Place of birth - Born in state of residence (%)
Place of birth - Born in state of residence (%) - White
Place of birth - Born in state of residence (%) - Black or African American
Place of birth - Born in state of residence (%) - Asian
Place of birth - Born in state of residence (%) - Hispanic or Latino
Place of birth - Born in state of residence (%) - American Indian and Alaska Native
Place of birth - Born in state of residence (%) - Multirace
Place of birth - Born in state of residence (%) - Other Race
Place of birth - Born in other state (%)
Place of birth - Born in other state (%) - White
Place of birth - Born in other state (%) - Black or African American
Place of birth - Born in other state (%) - Asian
Place of birth - Born in other state (%) - Hispanic or Latino
Place of birth - Born in other state (%) - American Indian and Alaska Native
Place of birth - Born in other state (%) - Multirace
Place of birth - Born in other state (%) - Other Race
Place of birth - Native, outside of US (%)
Place of birth - Native, outside of US (%) - White
Place of birth - Native, outside of US (%) - Black or African American
Place of birth - Native, outside of US (%) - Asian
Place of birth - Native, outside of US (%) - Hispanic or Latino
Place of birth - Native, outside of US (%) - American Indian and Alaska Native
Place of birth - Native, outside of US (%) - Multirace
Place of birth - Native, outside of US (%) - Other Race
Place of birth - Foreign born (%)
Place of birth - Foreign born (%) - White
Place of birth - Foreign born (%) - Black or African American
Place of birth - Foreign born (%) - Asian
Place of birth - Foreign born (%) - Hispanic or Latino
Place of birth - Foreign born (%) - American Indian and Alaska Native
Place of birth - Foreign born (%) - Multirace
Place of birth - Foreign born (%) - Other Race
Residents speaking English at home (%)
Residents speaking English at home - Born in the United States (%)
Residents speaking English at home - Native, born elsewhere (%)
Residents speaking English at home - Foreign born (%)
Residents speaking Spanish at home (%)
Residents speaking Spanish at home - Born in the United States (%)
Residents speaking Spanish at home - Native, born elsewhere (%)
Residents speaking Spanish at home - Foreign born (%)
Residents speaking other language at home (%)
Residents speaking other language at home - Born in the United States (%)
Residents speaking other language at home - Native, born elsewhere (%)
Residents speaking other language at home - Foreign born (%)
Marital status - Never married (%)
Marital status - Now married (%)
Marital status - Separated (%)
Marital status - Widowed (%)
Marital status - Divorced (%)
Ancestries Reported - Arab (%)
Ancestries Reported - Czech (%)
Ancestries Reported - Danish (%)
Ancestries Reported - Dutch (%)
Ancestries Reported - English (%)
Ancestries Reported - French (%)
Ancestries Reported - French Canadian (%)
Ancestries Reported - German (%)
Ancestries Reported - Greek (%)
Ancestries Reported - Hungarian (%)
Ancestries Reported - Irish (%)
Ancestries Reported - Italian (%)
Ancestries Reported - Lithuanian (%)
Ancestries Reported - Norwegian (%)
Ancestries Reported - Polish (%)
Ancestries Reported - Portuguese (%)
Ancestries Reported - Russian (%)
Ancestries Reported - Scotch-Irish (%)
Ancestries Reported - Scottish (%)
Ancestries Reported - Slovak (%)
Ancestries Reported - Subsaharan African (%)
Ancestries Reported - Swedish (%)
Ancestries Reported - Swiss (%)
Ancestries Reported - Ukrainian (%)
Ancestries Reported - United States (%)
Ancestries Reported - Welsh (%)
Ancestries Reported - West Indian (%)
Ancestries Reported - Other (%)
Geographical mobility - Same house 1 year ago (%)
Geographical mobility - Same house 1 year ago (%) - White
Geographical mobility - Same house 1 year ago (%) - Black or African American
Geographical mobility - Same house 1 year ago (%) - Asian
Geographical mobility - Same house 1 year ago (%) - Hispanic or Latino
Geographical mobility - Same house 1 year ago (%) - American Indian and Alaska Native
Geographical mobility - Same house 1 year ago (%) - Multirace
Geographical mobility - Same house 1 year ago (%) - Other Race
Geographical mobility - Moved within same county (%)
Geographical mobility - Moved within same county (%) - White
Geographical mobility - Moved within same county (%) - Black or African American
Geographical mobility - Moved within same county (%) - Asian
Geographical mobility - Moved within same county (%) - Hispanic or Latino
Geographical mobility - Moved within same county (%) - American Indian and Alaska Native
Geographical mobility - Moved within same county (%) - Multirace
Geographical mobility - Moved within same county (%) - Other Race
Geographical mobility - Moved from different county within same state (%)
Geographical mobility - Moved from different county within same state (%) - White
Geographical mobility - Moved from different county within same state (%) - Black or African American
Geographical mobility - Moved from different county within same state (%) - Asian
Geographical mobility - Moved from different county within same state (%) - Hispanic or Latino
Geographical mobility - Moved from different county within same state (%) - American Indian and Alaska Native
Geographical mobility - Moved from different county within same state (%) - Multirace
Geographical mobility - Moved from different county within same state (%) - Other Race
Geographical mobility - Moved from different state (%)
Geographical mobility - Moved from different state (%) - White
Geographical mobility - Moved from different state (%) - Black or African American
Geographical mobility - Moved from different state (%) - Asian
Geographical mobility - Moved from different state (%) - Hispanic or Latino
Geographical mobility - Moved from different state (%) - American Indian and Alaska Native
Geographical mobility - Moved from different state (%) - Multirace
Geographical mobility - Moved from different state (%) - Other Race
Geographical mobility - Moved from abroad (%)
Geographical mobility - Moved from abroad (%) - White
Geographical mobility - Moved from abroad (%) - Black or African American
Geographical mobility - Moved from abroad (%) - Asian
Geographical mobility - Moved from abroad (%) - Hispanic or Latino
Geographical mobility - Moved from abroad (%) - American Indian and Alaska Native
Geographical mobility - Moved from abroad (%) - Multirace
Geographical mobility - Moved from abroad (%) - Other Race
Place of birth for the foreign-born population - Ireland (%)
Place of birth for the foreign-born population - Denmark (%)
Place of birth for the foreign-born population - Norway (%)
Place of birth for the foreign-born population - Sweden (%)
Place of birth for the foreign-born population - United Kingdom (%)
Place of birth for the foreign-born population - England (%)
Place of birth for the foreign-born population - Scotland (%)
Place of birth for the foreign-born population - Other Northern Europe (%)
Place of birth for the foreign-born population - Austria (%)
Place of birth for the foreign-born population - Belgium (%)
Place of birth for the foreign-born population - France (%)
Place of birth for the foreign-born population - Germany (%)
Place of birth for the foreign-born population - Netherlands (%)
Place of birth for the foreign-born population - Switzerland (%)
Place of birth for the foreign-born population - Other Western Europe (%)
Place of birth for the foreign-born population - Greece (%)
Place of birth for the foreign-born population - Italy (%)
Place of birth for the foreign-born population - Portugal (%)
Place of birth for the foreign-born population - Spain (%)
Place of birth for the foreign-born population - Other Southern Europe (%)
Place of birth for the foreign-born population - Albania (%)
Place of birth for the foreign-born population - Belarus (%)
Place of birth for the foreign-born population - Bosnia and Herzegovina (%)
Place of birth for the foreign-born population - Bulgaria (%)
Place of birth for the foreign-born population - Croatia (%)
Place of birth for the foreign-born population - Czechoslovakia (%)
Place of birth for the foreign-born population - Hungary (%)
Place of birth for the foreign-born population - Latvia (%)
Place of birth for the foreign-born population - Lithuania (%)
Place of birth for the foreign-born population - North Macedonia (Macedonia) (%)
Place of birth for the foreign-born population - Moldova (%)
Place of birth for the foreign-born population - Poland (%)
Place of birth for the foreign-born population - Romania (%)
Place of birth for the foreign-born population - Russia (%)
Place of birth for the foreign-born population - Serbia (%)
Place of birth for the foreign-born population - Ukraine (%)
Place of birth for the foreign-born population - Other Eastern Europe (%)
Place of birth for the foreign-born population - China (%)
Place of birth for the foreign-born population - Hong Kong (%)
Place of birth for the foreign-born population - Taiwan (%)
Place of birth for the foreign-born population - Japan (%)
Place of birth for the foreign-born population - Korea (%)
Place of birth for the foreign-born population - Other Eastern Asia (%)
Place of birth for the foreign-born population - Afghanistan (%)
Place of birth for the foreign-born population - Bangladesh (%)
Place of birth for the foreign-born population - India (%)
Place of birth for the foreign-born population - Iran (%)
Place of birth for the foreign-born population - Kazakhstan (%)
Place of birth for the foreign-born population - Nepal (%)
Place of birth for the foreign-born population - Pakistan (%)
Place of birth for the foreign-born population - Sri Lanka (%)
Place of birth for the foreign-born population - Uzbekistan (%)
Place of birth for the foreign-born population - Other South Central Asia (%)
Place of birth for the foreign-born population - Burma (%)
Place of birth for the foreign-born population - Cambodia (%)
Place of birth for the foreign-born population - Indonesia (%)
Place of birth for the foreign-born population - Laos (%)
Place of birth for the foreign-born population - Malaysia (%)
Place of birth for the foreign-born population - Philippines (%)
Place of birth for the foreign-born population - Singapore (%)
Place of birth for the foreign-born population - Thailand (%)
Place of birth for the foreign-born population - Vietnam (%)
Place of birth for the foreign-born population - Other South Eastern Asia (%)
Place of birth for the foreign-born population - Armenia (%)
Place of birth for the foreign-born population - Iraq (%)
Place of birth for the foreign-born population - Israel (%)
Place of birth for the foreign-born population - Jordan (%)
Place of birth for the foreign-born population - Kuwait (%)
Place of birth for the foreign-born population - Lebanon (%)
Place of birth for the foreign-born population - Saudi Arabia (%)
Place of birth for the foreign-born population - Syria (%)
Place of birth for the foreign-born population - Turkey (%)
Place of birth for the foreign-born population - Yemen (%)
Place of birth for the foreign-born population - Other Western Asia (%)
Place of birth for the foreign-born population - Eritrea (%)
Place of birth for the foreign-born population - Ethiopia (%)
Place of birth for the foreign-born population - Kenya (%)
Place of birth for the foreign-born population - Somalia (%)
Place of birth for the foreign-born population - Uganda (%)
Place of birth for the foreign-born population - Zimbabwe (%)
Place of birth for the foreign-born population - Other Eastern Africa (%)
Place of birth for the foreign-born population - Cameroon (%)
Place of birth for the foreign-born population - Congo (%)
Place of birth for the foreign-born population - Democratic Republic of Congo (Zaire) (%)
Place of birth for the foreign-born population - Other Middle Africa (%)
Place of birth for the foreign-born population - Egypt (%)
Place of birth for the foreign-born population - Morocco (%)
Place of birth for the foreign-born population - Sudan (%)
Place of birth for the foreign-born population - Other Northern Africa (%)
Place of birth for the foreign-born population - South Africa (%)
Place of birth for the foreign-born population - Other Southern Africa (%)
Place of birth for the foreign-born population - Cabo Verde (%)
Place of birth for the foreign-born population - Ghana (%)
Place of birth for the foreign-born population - Liberia (%)
Place of birth for the foreign-born population - Nigeria (%)
Place of birth for the foreign-born population - Senegal (%)
Place of birth for the foreign-born population - Sierra Leone (%)
Place of birth for the foreign-born population - Other Western Africa (%)
Place of birth for the foreign-born population - Australia (%)
Place of birth for the foreign-born population - New Zealand (%)
Place of birth for the foreign-born population - Fiji (%)
Place of birth for the foreign-born population - Micronesia (%)
Place of birth for the foreign-born population - Bahamas (%)
Place of birth for the foreign-born population - Barbados (%)
Place of birth for the foreign-born population - Cuba (%)
Place of birth for the foreign-born population - Dominica (%)
Place of birth for the foreign-born population - Dominican Republic (%)
Place of birth for the foreign-born population - Grenada (%)
Place of birth for the foreign-born population - Haiti (%)
Place of birth for the foreign-born population - Jamaica (%)
Place of birth for the foreign-born population - St. Vincent and the Grenadines (%)
Place of birth for the foreign-born population - Trinidad and Tobago (%)
Place of birth for the foreign-born population - West Indies (%)
Place of birth for the foreign-born population - Other Caribbean (%)
Place of birth for the foreign-born population - Belize (%)
Place of birth for the foreign-born population - Costa Rica (%)
Place of birth for the foreign-born population - El Salvador (%)
Place of birth for the foreign-born population - Guatemala (%)
Place of birth for the foreign-born population - Honduras (%)
Place of birth for the foreign-born population - Mexico (%)
Place of birth for the foreign-born population - Nicaragua (%)
Place of birth for the foreign-born population - Panama (%)
Place of birth for the foreign-born population - Other Central America (%)
Place of birth for the foreign-born population - Argentina (%)
Place of birth for the foreign-born population - Bolivia (%)
Place of birth for the foreign-born population - Brazil (%)
Place of birth for the foreign-born population - Chile (%)
Place of birth for the foreign-born population - Colombia (%)
Place of birth for the foreign-born population - Ecuador (%)
Place of birth for the foreign-born population - Guyana (%)
Place of birth for the foreign-born population - Peru (%)
Place of birth for the foreign-born population - Uruguay (%)
Place of birth for the foreign-born population - Venezuela (%)
Place of birth for the foreign-born population - Other South America (%)
Place of birth for the foreign-born population - Canada (%)
Place of birth for the foreign-born population - Other Northern America (%)
Place of birth for the foreign-born population - Other (%)
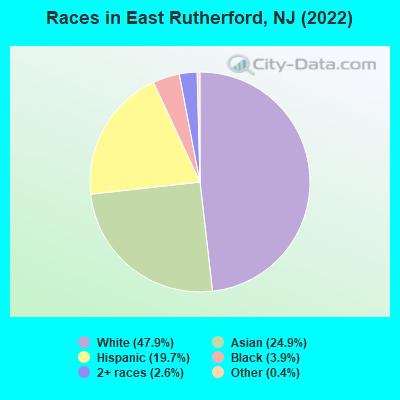
According to 2022 data, the most numerous races in East Rutherford, NJ are White alone (4,801 residents), Hispanic (1,970 residents), and Black alone (392 residents). 48.7% of East Rutherford residents speak English at home. 35.3% of East Rutherford, NJ residents are foreign-born (20.4% born in Asia, 7.1% born in Latin America, 6.5% born in Europe), which is 34.9% greater than the foreign-born rate of 23.0% across the entire state of New Jersey.
Race distribution in East Rutherford
2000 2022
5,557,209 66.0% White alone 1,117,191 13.3% Hispanic 1,096,171 13.0% Black alone 477,012 5.7% Asian alone 133,689 1.6% Two or more races 19,565 0.2% Other race alone 11,338 0.1% American Indian alone 2,175 0.03% Native Hawaiian and Other
4,766,476 51.5% White alone 2,028,470 21.9% Hispanic 1,111,632 12.0% Black alone 923,546 10.0% Asian alone 332,237 3.6% Two or more races 89,847 1.0% Other race alone 8,557 0.09% American Indian alone 934 0.01% Native Hawaiian and Other
Income and house value in East Rutherford Median household income in 2022 $86,971 White non-Hispanic householders$131,978 Asian householders$59,922 Some other race householders$71,183 Two or more races householders$71,612 Hispanic or Latino race householdersMedian 2022 house value $453,486 White Non-Hispanic householders$663,256 Black or African American householders $526,765 Asian householders$440,141 Hispanic or Latino householders
Median age by race in East Rutherford
43.2 Median age for White residents39.6 47.9 30.9 Median age for Black or African American residents34.0 28.0 -766,197,182.3 Median age for American Indian / Alaska Native residents-686,322,685.6 -753,722,794.2 35.5 Median age for Asian residents35.7 33.2 -510,460,250.5 Median age for Native Hawaiian / Pacific Islander residents-514,767,932.0 -713,070,378.3 39.1 Median age for Other race residents36.8 39.4 44.1 Median age for Two or more races residents45.8 36.2 42.8 Median age for White alone residents39.4 47.7 40.9 Median age for Hispanic or Latino residents39.0 41.1
Owner/renter occupied households by race in East Rutherford
House owners and renters - White residents 994 43.3% Owner occupied1,303 56.7% Renter occupiedHouse owners and renters - Black or African American residents 150 100.0% Renter occupiedHouse owners and renters - Asian residents 303 36.8% Owner occupied520 63.2% Renter occupiedHouse owners and renters - Other race residents 150 24.3% Owner occupied467 75.7% Renter occupiedHouse owners and renters - Two or more races residents 12 2.6% Owner occupied439 97.4% Renter occupiedHouse owners and renters - White alone residents 1,042 45.4% Owner occupied1,254 54.6% Renter occupiedHouse owners and renters - Hispanic or Latino residents 96 11.0% Owner occupied777 89.0% Renter occupied
Language usage in East Rutherford
English speakers - Total 48.7% of residents of East Rutherford speak English at home.
17.7% of residents speak Spanish at home 1,183 73.0% Speak English very well437 27.0% Speak English less than very well33.5% of residents speak other language at home 1,937 63.3% Speak English very well1,121 36.7% Speak English less than very well
English speakers - Born in the United States 75.6% of residents of East Rutherford speak English at home.
12.6% of residents speak Spanish at home 188 100.0% Speak English very well12.0% of residents speak other language at home 179 100.0% Speak English very well
English speakers - Native, born elsewhere 33.8% of residents of East Rutherford speak English at home.
62.8% of residents speak Spanish at home 93 100.0% Speak English very well3.4% of residents speak other language at home 5 100.0% Speak English very well
English speakers - Foreign-born 6.1% of residents of East Rutherford speak English at home.
21.8% of residents speak Spanish at home 338 44.1% Speak English very well428 55.9% Speak English less than very well71.9% of residents speak other language at home 1,477 58.4% Speak English very well1,054 41.6% Speak English less than very well
White (Caucasian) - Speak only English Native:
89.2% (3,374)Foreign-born:
9.3% (75)
White (Caucasian) - Speak another language Native:
10.6% (402)Foreign-born:
87.8% (703)
Asian - Speak only English Native:
55.0% (223)Foreign-born:
5.9% (101)
Asian - Speak another language Native:
45.4% (183)Foreign-born:
94.4% (1,626)
Other race - Speak only English Native:
2.9% (26)Foreign-born:
4.6% (34)
Other race - Speak another language Native:
100.0% (904)Foreign-born:
96.0% (713)
Two or more races - Speak another language Native:
19.9% (64)Foreign-born:
100.0% (317)
White alone - Speak only English Native:
90.0% (3,163)Foreign-born:
7.9% (76)
White alone - Speak another language Native:
9.9% (349)Foreign-born:
92.5% (891)
Hispanic or Latino - Speak only English Native:
30.4% (352)Foreign-born:
5.7% (44)
Hispanic or Latino - Speak another language Native:
71.3% (827)Foreign-born:
93.8% (723)
Foreign-born residents in East Rutherford 3,539 residents are foreign born (20.4% Asia , 7.1% Latin America , 6.5% Europe ).
This city:
35.3%New Jersey:
23.2%
Marital status for residents in East Rutherford Marital status - White (Caucasian) population 15 years and over
Males 37.7% Never married45.2% Now married0.0% Separated2.0% Widowed15.1% DivorcedFemales 37.8% Never married30.8% Now married1.3% Separated12.5% Widowed17.6% DivorcedWomen who gave birth in the past 12 months Now married:
100.0% (36)Unmarried:
0.0% (0)
Women who did not give birth in the past 12 months Now married:
28.0% (356)Unmarried:
72.0% (913)
Marital status - Black or African American population 15 years and over
Males 82.3% Never married17.7% Now married0.0% Separated0.0% Widowed0.0% DivorcedFemales 59.1% Never married40.9% Now married0.0% Separated0.0% Widowed0.0% DivorcedWomen who did not give birth in the past 12 months Now married:
27.6% (30)Unmarried:
72.4% (78)
Marital status - Asian population 15 years and over
Males 15.9% Never married84.1% Now married0.0% Separated0.0% Widowed0.0% DivorcedFemales 13.0% Never married77.8% Now married0.0% Separated8.5% Widowed0.7% DivorcedWomen who gave birth in the past 12 months Now married:
100.0% (87)Unmarried:
0.0% (0)
Women who did not give birth in the past 12 months Now married:
78.0% (385)Unmarried:
22.0% (108)
Marital status - Other race population 15 years and over
Males 52.0% Never married38.4% Now married0.0% Separated9.7% Widowed0.0% DivorcedFemales 31.0% Never married42.3% Now married10.7% Separated0.0% Widowed16.0% DivorcedWomen who did not give birth in the past 12 months Now married:
57.9% (413)Unmarried:
42.1% (300)
Marital status - Two or more races population 15 years and over
Males 19.9% Never married23.8% Now married45.1% Separated0.0% Widowed11.2% DivorcedFemales 88.7% Never married11.3% Now married0.0% Separated0.0% Widowed0.0% DivorcedWomen who did not give birth in the past 12 months Now married:
7.5% (20)Unmarried:
92.5% (252)
Marital status - White alone, not Hispanic / Latino population 15 years and over
Males 35.8% Never married45.0% Now married0.0% Separated2.2% Widowed16.9% DivorcedFemales 34.8% Never married33.4% Now married0.3% Separated13.9% Widowed17.7% DivorcedWomen who gave birth in the past 12 months Now married:
100.0% (42)Unmarried:
0.0% (0)
Women who did not give birth in the past 12 months Now married:
32.2% (410)Unmarried:
67.8% (864)
Marital status - Hispanic or Latino population 15 years and over
Males 47.3% Never married34.7% Now married10.6% Separated4.8% Widowed2.6% DivorcedFemales 44.9% Never married29.4% Now married10.2% Separated0.0% Widowed15.5% DivorcedWomen who did not give birth in the past 12 months Now married:
35.9% (235)Unmarried:
64.1% (419)
Ancestries in East Rutherford
500 9.1% Polish425 7.7% Turkish413 7.5% Italian165 3.0% Irish98 1.8% American70 1.3% Portuguese54 1.0% Jordanian51 0.9% Slovak50 0.9% German34 0.6% Armenian30 0.5% Ukrainian28 0.5% Scotch-Irish25 0.5% Brazilian24 0.4% Croatian23 0.4% Macedonian23 0.4% Welsh21 0.4% English21 0.4% Swedish20 0.4% European16 0.3% Scottish12 0.2% Greek12 0.2% Scandinavian10 0.2% Moroccan9 0.2% Hungarian8 0.1% Syrian8 0.1% Eastern European4 0.07% French Canadian1 0.02% Maltese1 0.02% Slavic
Children Nativity (place of birth) in East Rutherford
Children under 6 years - Living with two parents Both parents native 279 100.0% NativeBoth parents foreign-born 326 85.0% Native57 15.0% Foreign-bornOne native, one foreign-born parent 27 100.0% NativeChildren under 6 years - Living with one parent Native parent 277 100.0% NativeChildren 6 to 17 years - Living with two parents Both parents native 143 93.0% Native11 7.0% Foreign-bornBoth parents foreign-born 195 58.4% Native139 41.6% Foreign-bornOne native, one foreign-born parent 61 100.0% NativeChildren 6 to 17 years - Living with one parent Foreign-born parent 78 52.4% Native71 47.6% Foreign-born