Races in Doral, Florida (FL) Detailed Stats
Data:
Races - White alone (%)
Races - White alone (% change since 2000)
Races - Black alone (%)
Races - Black alone (% change since 2000)
Races - American Indian alone (%)
Races - American Indian alone (% change since 2000)
Races - Asian alone (%)
Races - Asian alone (% change since 2000)
Races - Hispanic (%)
Races - Hispanic (% change since 2000)
Races - Native Hawaiian and Other Pacific Islander alone (%)
Races - Native Hawaiian and Other Pacific Islander alone (% change since 2000)
Races - Two or more races(%)
Races - Two or more races(% change since 2000)
Races - Other race alone (%)
Races - Other race alone (% change since 2000)
Racial diversity
Place of birth - Born in state of residence (%)
Place of birth - Born in state of residence (%) - White
Place of birth - Born in state of residence (%) - Black or African American
Place of birth - Born in state of residence (%) - Asian
Place of birth - Born in state of residence (%) - Hispanic or Latino
Place of birth - Born in state of residence (%) - American Indian and Alaska Native
Place of birth - Born in state of residence (%) - Multirace
Place of birth - Born in state of residence (%) - Other Race
Place of birth - Born in other state (%)
Place of birth - Born in other state (%) - White
Place of birth - Born in other state (%) - Black or African American
Place of birth - Born in other state (%) - Asian
Place of birth - Born in other state (%) - Hispanic or Latino
Place of birth - Born in other state (%) - American Indian and Alaska Native
Place of birth - Born in other state (%) - Multirace
Place of birth - Born in other state (%) - Other Race
Place of birth - Native, outside of US (%)
Place of birth - Native, outside of US (%) - White
Place of birth - Native, outside of US (%) - Black or African American
Place of birth - Native, outside of US (%) - Asian
Place of birth - Native, outside of US (%) - Hispanic or Latino
Place of birth - Native, outside of US (%) - American Indian and Alaska Native
Place of birth - Native, outside of US (%) - Multirace
Place of birth - Native, outside of US (%) - Other Race
Place of birth - Foreign born (%)
Place of birth - Foreign born (%) - White
Place of birth - Foreign born (%) - Black or African American
Place of birth - Foreign born (%) - Asian
Place of birth - Foreign born (%) - Hispanic or Latino
Place of birth - Foreign born (%) - American Indian and Alaska Native
Place of birth - Foreign born (%) - Multirace
Place of birth - Foreign born (%) - Other Race
Residents speaking English at home (%)
Residents speaking English at home - Born in the United States (%)
Residents speaking English at home - Native, born elsewhere (%)
Residents speaking English at home - Foreign born (%)
Residents speaking Spanish at home (%)
Residents speaking Spanish at home - Born in the United States (%)
Residents speaking Spanish at home - Native, born elsewhere (%)
Residents speaking Spanish at home - Foreign born (%)
Residents speaking other language at home (%)
Residents speaking other language at home - Born in the United States (%)
Residents speaking other language at home - Native, born elsewhere (%)
Residents speaking other language at home - Foreign born (%)
Marital status - Never married (%)
Marital status - Now married (%)
Marital status - Separated (%)
Marital status - Widowed (%)
Marital status - Divorced (%)
Ancestries Reported - Arab (%)
Ancestries Reported - Czech (%)
Ancestries Reported - Danish (%)
Ancestries Reported - Dutch (%)
Ancestries Reported - English (%)
Ancestries Reported - French (%)
Ancestries Reported - French Canadian (%)
Ancestries Reported - German (%)
Ancestries Reported - Greek (%)
Ancestries Reported - Hungarian (%)
Ancestries Reported - Irish (%)
Ancestries Reported - Italian (%)
Ancestries Reported - Lithuanian (%)
Ancestries Reported - Norwegian (%)
Ancestries Reported - Polish (%)
Ancestries Reported - Portuguese (%)
Ancestries Reported - Russian (%)
Ancestries Reported - Scotch-Irish (%)
Ancestries Reported - Scottish (%)
Ancestries Reported - Slovak (%)
Ancestries Reported - Subsaharan African (%)
Ancestries Reported - Swedish (%)
Ancestries Reported - Swiss (%)
Ancestries Reported - Ukrainian (%)
Ancestries Reported - United States (%)
Ancestries Reported - Welsh (%)
Ancestries Reported - West Indian (%)
Ancestries Reported - Other (%)
Geographical mobility - Same house 1 year ago (%)
Geographical mobility - Same house 1 year ago (%) - White
Geographical mobility - Same house 1 year ago (%) - Black or African American
Geographical mobility - Same house 1 year ago (%) - Asian
Geographical mobility - Same house 1 year ago (%) - Hispanic or Latino
Geographical mobility - Same house 1 year ago (%) - American Indian and Alaska Native
Geographical mobility - Same house 1 year ago (%) - Multirace
Geographical mobility - Same house 1 year ago (%) - Other Race
Geographical mobility - Moved within same county (%)
Geographical mobility - Moved within same county (%) - White
Geographical mobility - Moved within same county (%) - Black or African American
Geographical mobility - Moved within same county (%) - Asian
Geographical mobility - Moved within same county (%) - Hispanic or Latino
Geographical mobility - Moved within same county (%) - American Indian and Alaska Native
Geographical mobility - Moved within same county (%) - Multirace
Geographical mobility - Moved within same county (%) - Other Race
Geographical mobility - Moved from different county within same state (%)
Geographical mobility - Moved from different county within same state (%) - White
Geographical mobility - Moved from different county within same state (%) - Black or African American
Geographical mobility - Moved from different county within same state (%) - Asian
Geographical mobility - Moved from different county within same state (%) - Hispanic or Latino
Geographical mobility - Moved from different county within same state (%) - American Indian and Alaska Native
Geographical mobility - Moved from different county within same state (%) - Multirace
Geographical mobility - Moved from different county within same state (%) - Other Race
Geographical mobility - Moved from different state (%)
Geographical mobility - Moved from different state (%) - White
Geographical mobility - Moved from different state (%) - Black or African American
Geographical mobility - Moved from different state (%) - Asian
Geographical mobility - Moved from different state (%) - Hispanic or Latino
Geographical mobility - Moved from different state (%) - American Indian and Alaska Native
Geographical mobility - Moved from different state (%) - Multirace
Geographical mobility - Moved from different state (%) - Other Race
Geographical mobility - Moved from abroad (%)
Geographical mobility - Moved from abroad (%) - White
Geographical mobility - Moved from abroad (%) - Black or African American
Geographical mobility - Moved from abroad (%) - Asian
Geographical mobility - Moved from abroad (%) - Hispanic or Latino
Geographical mobility - Moved from abroad (%) - American Indian and Alaska Native
Geographical mobility - Moved from abroad (%) - Multirace
Geographical mobility - Moved from abroad (%) - Other Race
Place of birth for the foreign-born population - Ireland (%)
Place of birth for the foreign-born population - Denmark (%)
Place of birth for the foreign-born population - Norway (%)
Place of birth for the foreign-born population - Sweden (%)
Place of birth for the foreign-born population - United Kingdom (%)
Place of birth for the foreign-born population - England (%)
Place of birth for the foreign-born population - Scotland (%)
Place of birth for the foreign-born population - Other Northern Europe (%)
Place of birth for the foreign-born population - Austria (%)
Place of birth for the foreign-born population - Belgium (%)
Place of birth for the foreign-born population - France (%)
Place of birth for the foreign-born population - Germany (%)
Place of birth for the foreign-born population - Netherlands (%)
Place of birth for the foreign-born population - Switzerland (%)
Place of birth for the foreign-born population - Other Western Europe (%)
Place of birth for the foreign-born population - Greece (%)
Place of birth for the foreign-born population - Italy (%)
Place of birth for the foreign-born population - Portugal (%)
Place of birth for the foreign-born population - Spain (%)
Place of birth for the foreign-born population - Other Southern Europe (%)
Place of birth for the foreign-born population - Albania (%)
Place of birth for the foreign-born population - Belarus (%)
Place of birth for the foreign-born population - Bosnia and Herzegovina (%)
Place of birth for the foreign-born population - Bulgaria (%)
Place of birth for the foreign-born population - Croatia (%)
Place of birth for the foreign-born population - Czechoslovakia (%)
Place of birth for the foreign-born population - Hungary (%)
Place of birth for the foreign-born population - Latvia (%)
Place of birth for the foreign-born population - Lithuania (%)
Place of birth for the foreign-born population - North Macedonia (Macedonia) (%)
Place of birth for the foreign-born population - Moldova (%)
Place of birth for the foreign-born population - Poland (%)
Place of birth for the foreign-born population - Romania (%)
Place of birth for the foreign-born population - Russia (%)
Place of birth for the foreign-born population - Serbia (%)
Place of birth for the foreign-born population - Ukraine (%)
Place of birth for the foreign-born population - Other Eastern Europe (%)
Place of birth for the foreign-born population - China (%)
Place of birth for the foreign-born population - Hong Kong (%)
Place of birth for the foreign-born population - Taiwan (%)
Place of birth for the foreign-born population - Japan (%)
Place of birth for the foreign-born population - Korea (%)
Place of birth for the foreign-born population - Other Eastern Asia (%)
Place of birth for the foreign-born population - Afghanistan (%)
Place of birth for the foreign-born population - Bangladesh (%)
Place of birth for the foreign-born population - India (%)
Place of birth for the foreign-born population - Iran (%)
Place of birth for the foreign-born population - Kazakhstan (%)
Place of birth for the foreign-born population - Nepal (%)
Place of birth for the foreign-born population - Pakistan (%)
Place of birth for the foreign-born population - Sri Lanka (%)
Place of birth for the foreign-born population - Uzbekistan (%)
Place of birth for the foreign-born population - Other South Central Asia (%)
Place of birth for the foreign-born population - Burma (%)
Place of birth for the foreign-born population - Cambodia (%)
Place of birth for the foreign-born population - Indonesia (%)
Place of birth for the foreign-born population - Laos (%)
Place of birth for the foreign-born population - Malaysia (%)
Place of birth for the foreign-born population - Philippines (%)
Place of birth for the foreign-born population - Singapore (%)
Place of birth for the foreign-born population - Thailand (%)
Place of birth for the foreign-born population - Vietnam (%)
Place of birth for the foreign-born population - Other South Eastern Asia (%)
Place of birth for the foreign-born population - Armenia (%)
Place of birth for the foreign-born population - Iraq (%)
Place of birth for the foreign-born population - Israel (%)
Place of birth for the foreign-born population - Jordan (%)
Place of birth for the foreign-born population - Kuwait (%)
Place of birth for the foreign-born population - Lebanon (%)
Place of birth for the foreign-born population - Saudi Arabia (%)
Place of birth for the foreign-born population - Syria (%)
Place of birth for the foreign-born population - Turkey (%)
Place of birth for the foreign-born population - Yemen (%)
Place of birth for the foreign-born population - Other Western Asia (%)
Place of birth for the foreign-born population - Eritrea (%)
Place of birth for the foreign-born population - Ethiopia (%)
Place of birth for the foreign-born population - Kenya (%)
Place of birth for the foreign-born population - Somalia (%)
Place of birth for the foreign-born population - Uganda (%)
Place of birth for the foreign-born population - Zimbabwe (%)
Place of birth for the foreign-born population - Other Eastern Africa (%)
Place of birth for the foreign-born population - Cameroon (%)
Place of birth for the foreign-born population - Congo (%)
Place of birth for the foreign-born population - Democratic Republic of Congo (Zaire) (%)
Place of birth for the foreign-born population - Other Middle Africa (%)
Place of birth for the foreign-born population - Egypt (%)
Place of birth for the foreign-born population - Morocco (%)
Place of birth for the foreign-born population - Sudan (%)
Place of birth for the foreign-born population - Other Northern Africa (%)
Place of birth for the foreign-born population - South Africa (%)
Place of birth for the foreign-born population - Other Southern Africa (%)
Place of birth for the foreign-born population - Cabo Verde (%)
Place of birth for the foreign-born population - Ghana (%)
Place of birth for the foreign-born population - Liberia (%)
Place of birth for the foreign-born population - Nigeria (%)
Place of birth for the foreign-born population - Senegal (%)
Place of birth for the foreign-born population - Sierra Leone (%)
Place of birth for the foreign-born population - Other Western Africa (%)
Place of birth for the foreign-born population - Australia (%)
Place of birth for the foreign-born population - New Zealand (%)
Place of birth for the foreign-born population - Fiji (%)
Place of birth for the foreign-born population - Micronesia (%)
Place of birth for the foreign-born population - Bahamas (%)
Place of birth for the foreign-born population - Barbados (%)
Place of birth for the foreign-born population - Cuba (%)
Place of birth for the foreign-born population - Dominica (%)
Place of birth for the foreign-born population - Dominican Republic (%)
Place of birth for the foreign-born population - Grenada (%)
Place of birth for the foreign-born population - Haiti (%)
Place of birth for the foreign-born population - Jamaica (%)
Place of birth for the foreign-born population - St. Vincent and the Grenadines (%)
Place of birth for the foreign-born population - Trinidad and Tobago (%)
Place of birth for the foreign-born population - West Indies (%)
Place of birth for the foreign-born population - Other Caribbean (%)
Place of birth for the foreign-born population - Belize (%)
Place of birth for the foreign-born population - Costa Rica (%)
Place of birth for the foreign-born population - El Salvador (%)
Place of birth for the foreign-born population - Guatemala (%)
Place of birth for the foreign-born population - Honduras (%)
Place of birth for the foreign-born population - Mexico (%)
Place of birth for the foreign-born population - Nicaragua (%)
Place of birth for the foreign-born population - Panama (%)
Place of birth for the foreign-born population - Other Central America (%)
Place of birth for the foreign-born population - Argentina (%)
Place of birth for the foreign-born population - Bolivia (%)
Place of birth for the foreign-born population - Brazil (%)
Place of birth for the foreign-born population - Chile (%)
Place of birth for the foreign-born population - Colombia (%)
Place of birth for the foreign-born population - Ecuador (%)
Place of birth for the foreign-born population - Guyana (%)
Place of birth for the foreign-born population - Peru (%)
Place of birth for the foreign-born population - Uruguay (%)
Place of birth for the foreign-born population - Venezuela (%)
Place of birth for the foreign-born population - Other South America (%)
Place of birth for the foreign-born population - Canada (%)
Place of birth for the foreign-born population - Other Northern America (%)
Place of birth for the foreign-born population - Other (%)
Latest news about races in Doral, FL collected exclusively by city-data.com from local newspapers, TV, and radio stations
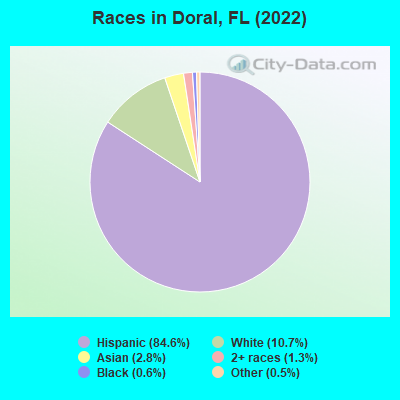
According to 2022 data, the most numerous races in Doral, FL are White alone (7,968 residents), Hispanic (62,995 residents), and Black alone (471 residents). 8.5% of Doral residents speak English at home. 70.7% of Doral, FL residents are foreign-born (65.4% born in Latin America), which is 70.3% greater than the foreign-born rate of 21.0% across the entire state of Florida.
Race distribution in Doral
2000 2022
10,458,509 65.4% White alone 2,682,715 16.8% Hispanic 2,264,268 14.2% Black alone 261,693 1.6% Asian alone 236,954 1.5% Two or more races 42,358 0.3% American Indian alone 28,994 0.2% Other race alone 6,887 0.04% Native Hawaiian and Other
11,309,403 50.8% White alone 6,025,039 27.1% Hispanic 3,241,015 14.6% Black alone 861,630 3.9% Two or more races 623,692 2.8% Asian alone 152,054 0.7% Other race alone 22,504 0.1% American Indian alone 9,486 0.04% Native Hawaiian and Other
Income and house value in Doral Median household income in 2022 $137,888 White non-Hispanic householders$100,045 Black householdersover $200,000 Asian householders$111,447 Some other race householders$83,994 Two or more races householders$79,879 Hispanic or Latino race householdersMedian 2022 house value $571,677 White Non-Hispanic householders$370,044 Black or African American householders $524,311 Asian householders$564,769 Some other race householders$863,436 Two or more races householders$596,346 Hispanic or Latino householders
Median age by race in Doral
35.6 Median age for White residents33.0 40.1 44.5 Median age for Black or African American residents-666,666,666.0 44.4 -666,666,666.0 Median age for American Indian / Alaska Native residents-666,666,666.0 -666,666,666.0 36.9 Median age for Asian residents36.0 40.7 -666,666,666.0 Median age for Native Hawaiian / Pacific Islander residents-666,666,666.0 -666,666,666.0 38.2 Median age for Other race residents42.2 36.8 40.7 Median age for Two or more races residents42.3 39.2 22.4 Median age for White alone residents25.7 22.3 39.1 Median age for Hispanic or Latino residents38.4 39.6
Owner/renter occupied households by race in Doral
House owners and renters - White residents 3,950 41.3% Owner occupied5,617 58.7% Renter occupiedHouse owners and renters - Black or African American residents 117 24.7% Owner occupied357 75.3% Renter occupiedHouse owners and renters - American Indian / Alaska Native residents 21 100.0% Renter occupiedHouse owners and renters - Asian residents 506 63.4% Owner occupied292 36.6% Renter occupiedHouse owners and renters - Native Hawaiian / Pacific Islander residents 24 100.0% Owner occupiedHouse owners and renters - Other race residents 1,153 45.2% Owner occupied1,397 54.8% Renter occupiedHouse owners and renters - Two or more races residents 5,909 47.1% Owner occupied6,647 52.9% Renter occupiedHouse owners and renters - White alone residents 884 43.5% Owner occupied1,146 56.5% Renter occupiedHouse owners and renters - Hispanic or Latino residents 9,847 44.2% Owner occupied12,419 55.8% Renter occupied
Language usage in Doral
English speakers - Total 8.5% of residents of Doral speak English at home.
86.9% of residents speak Spanish at home 32,722 51.6% Speak English very well30,748 48.4% Speak English less than very well4.5% of residents speak other language at home 2,606 78.9% Speak English very well699 21.1% Speak English less than very well
English speakers - Born in the United States 34.5% of residents of Doral speak English at home.
63.9% of residents speak Spanish at home 3,101 84.6% Speak English very well563 15.4% Speak English less than very well1.6% of residents speak other language at home 94 100.0% Speak English very well
English speakers - Native, born elsewhere 24.9% of residents of Doral speak English at home.
75.1% of residents speak Spanish at home 831 51.5% Speak English very well782 48.5% Speak English less than very well
English speakers - Foreign-born 4.1% of residents of Doral speak English at home.
90.6% of residents speak Spanish at home 22,286 43.8% Speak English very well28,648 56.2% Speak English less than very well5.3% of residents speak other language at home 2,285 76.6% Speak English very well699 23.4% Speak English less than very well
White (Caucasian) - Speak only English Native:
25.4% (2,069)Foreign-born:
3.6% (717)
White (Caucasian) - Speak another language Native:
74.6% (6,069)Foreign-born:
96.4% (19,135)
Black or African American - Speak only English Native:
65.5% (340)Foreign-born:
9.1% (19)
Black or African American - Speak another language Native:
34.5% (179)Foreign-born:
88.8% (184)
Asian - Speak only English Native:
52.1% (318)Foreign-born:
13.0% (192)
Asian - Speak another language Native:
47.7% (291)Foreign-born:
88.1% (1,304)
Other race - Speak only English Native:
20.2% (297)Foreign-born:
1.8% (127)
Other race - Speak another language Native:
79.8% (1,171)Foreign-born:
98.2% (6,912)
Two or more races - Speak only English Native:
13.4% (861)Foreign-born:
4.2% (1,158)
Two or more races - Speak another language Native:
86.6% (5,559)Foreign-born:
95.8% (26,099)
White alone - Speak only English Native:
28.2% (1,181)Foreign-born:
26.6% (482)
White alone - Speak another language Native:
71.8% (3,008)Foreign-born:
73.4% (1,333)
Hispanic or Latino - Speak only English Native:
16.6% (1,865)Foreign-born:
2.7% (1,413)
Hispanic or Latino - Speak another language Native:
83.4% (9,344)Foreign-born:
97.3% (50,469)
Foreign-born residents in Doral 52,701 residents are foreign born (65.4% Latin America ).
This city:
70.7%Florida:
21.1%
Marital status for residents in Doral Marital status - White (Caucasian) population 15 years and over
Males 38.8% Never married50.4% Now married4.0% Separated0.8% Widowed5.9% DivorcedFemales 24.5% Never married48.7% Now married4.6% Separated6.1% Widowed16.1% DivorcedWomen who gave birth in the past 12 months Now married:
100.0% (118)Unmarried:
0.0% (0)
Women who did not give birth in the past 12 months Now married:
55.5% (3,689)Unmarried:
44.5% (2,955)
Marital status - Black or African American population 15 years and over
Males 27.1% Never married70.0% Now married0.0% Separated0.0% Widowed2.9% DivorcedFemales 41.2% Never married30.0% Now married0.0% Separated0.0% Widowed28.8% DivorcedWomen who did not give birth in the past 12 months Now married:
41.1% (84)Unmarried:
58.9% (120)
Marital status - American Indian / Alaska Native population 15 years and over
Males 70.6% Never married29.4% Now married0.0% Separated0.0% Widowed0.0% DivorcedFemales 100.0% Never married0.0% Now married0.0% Separated0.0% Widowed0.0% DivorcedWomen who did not give birth in the past 12 months Now married:
0.0% (0)Unmarried:
100.0% (100)
Marital status - Asian population 15 years and over
Males 25.4% Never married62.1% Now married0.0% Separated9.6% Widowed2.9% DivorcedFemales 19.7% Never married77.0% Now married1.9% Separated0.0% Widowed1.3% DivorcedWomen who gave birth in the past 12 months Now married:
57.4% (28)Unmarried:
42.6% (21)
Women who did not give birth in the past 12 months Now married:
78.6% (407)Unmarried:
21.4% (111)
Marital status - Other race population 15 years and over
Males 17.9% Never married71.9% Now married0.6% Separated2.2% Widowed7.3% DivorcedFemales 26.0% Never married60.6% Now married0.6% Separated3.1% Widowed9.8% DivorcedWomen who gave birth in the past 12 months Now married:
100.0% (49)Unmarried:
0.0% (0)
Women who did not give birth in the past 12 months Now married:
53.1% (934)Unmarried:
46.9% (825)
Marital status - Two or more races population 15 years and over
Males 18.7% Never married66.3% Now married5.2% Separated0.8% Widowed8.9% DivorcedFemales 28.9% Never married51.0% Now married1.1% Separated6.3% Widowed12.8% DivorcedWomen who gave birth in the past 12 months Now married:
60.3% (217)Unmarried:
39.7% (143)
Women who did not give birth in the past 12 months Now married:
50.4% (5,386)Unmarried:
49.6% (5,301)
Marital status - White alone, not Hispanic / Latino population 15 years and over
Males 28.9% Never married50.2% Now married7.3% Separated1.4% Widowed12.2% DivorcedFemales 42.4% Never married35.7% Now married0.0% Separated12.1% Widowed9.8% DivorcedWomen who gave birth in the past 12 months Now married:
59.7% (83)Unmarried:
40.3% (56)
Women who did not give birth in the past 12 months Now married:
53.0% (637)Unmarried:
47.0% (566)
Marital status - Hispanic or Latino population 15 years and over
Males 27.1% Never married61.1% Now married4.1% Separated0.7% Widowed7.1% DivorcedFemales 27.6% Never married51.0% Now married2.5% Separated5.6% Widowed13.2% DivorcedWomen who gave birth in the past 12 months Now married:
72.9% (385)Unmarried:
27.1% (143)
Women who did not give birth in the past 12 months Now married:
52.3% (9,820)Unmarried:
47.7% (8,962)
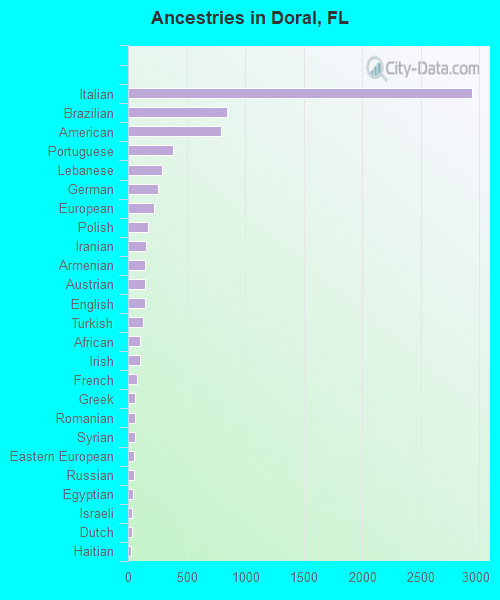
Ancestries in Doral
2,935 5.5% Italian848 1.6% Brazilian790 1.5% American382 0.7% Portuguese290 0.5% Lebanese256 0.5% German222 0.4% European174 0.3% Polish154 0.3% Iranian145 0.3% Armenian143 0.3% Austrian142 0.3% English127 0.2% Turkish105 0.2% African99 0.2% Irish74 0.1% French62 0.1% Greek61 0.1% Romanian60 0.1% Syrian50 0.09% Eastern European50 0.09% Russian39 0.07% Egyptian33 0.06% Israeli30 0.06% Dutch29 0.05% Haitian28 0.05% Arab23 0.04% Croatian23 0.04% Bulgarian22 0.04% Swedish19 0.04% Hungarian19 0.04% Barbadian18 0.03% Palestinian11 0.02% Macedonian10 0.02% Danish7 0.01% Scottish4 0.01% Scotch-Irish
Geographical mobility in Doral Same house 1 year ago 23,706 80.2% White (Caucasian)538 69.2% Black or African American100 81.3% American Indian / Alaska Native1,940 91.3% Asian19 100.0% Native Hawaiian / Pacific Islander6,172 70.3% Other race30,276 85.7% Two or more races5,733 84.3% White alone, not Hispanic / Latino53,223 81.2% Hispanic or LatinoMoved within same county 3,452 11.7% White / Caucasian44 5.6% Black or African American14 11.6% American Indian / Alaska Native94 4.4% Asian2,300 26.2% Other race2,542 7.2% Two or more races589 8.7% White alone, not Hispanic / Latino7,705 11.8% Hispanic or LatinoMoved within same state 100 0.3% White / Caucasian5 0.6% Black or African American393 1.1% Two or more races493 0.8% Hispanic or LatinoMoved from different state 613 2.1% White / Caucasian50 6.4% Black or African American60 2.8% Asian127 1.4% Other race558 1.6% Two or more races424 6.2% White alone, not Hispanic / Latino743 1.1% Hispanic or LatinoMoved from abroad 1,672 5.7% White281 36.1% Black or African American10 8.0% American Indian / Alaska Native94 4.4% Asian185 2.1% Other race1,568 4.4% Two or more races55 0.8% White alone, not Hispanic / Latino3,370 5.1% Hispanic or Latino
Children Nativity (place of birth) in Doral
Children under 6 years - Living with two parents Both parents native 505 100.0% NativeBoth parents foreign-born 1,929 77.7% Native555 22.3% Foreign-bornOne native, one foreign-born parent 888 100.0% NativeChildren under 6 years - Living with one parent Native parent 74 100.0% NativeForeign-born parent 910 83.0% Native186 17.0% Foreign-bornChildren 6 to 17 years - Living with two parents Both parents native 666 100.0% NativeBoth parents foreign-born 3,983 46.6% Native4,558 53.4% Foreign-bornOne native, one foreign-born parent 815 71.2% Native330 28.8% Foreign-bornChildren 6 to 17 years - Living with one parent Native parent 1,336 100.0% Foreign-bornForeign-born parent 4,242 74.5% Native1,453 25.5% Foreign-born
Place of birth for residents in Doral 49,069 Americas48,943 Latin America40,608 South America5,874 Caribbean2,461 Central America1,817 Asia1,666 Europe1,045 Southern Europe640 South Central Asia625 Eastern Asia351 Western Europe278 South Eastern Asia268 Western Asia238 China203 Eastern Europe147 Africa125 Northern America112 Northern Africa65 Northern Europe25 Eastern Africa8 Middle Africa26,587 Venezuela7,514 Colombia4,469 Cuba1,410 Ecuador1,403 Brazil1,273 Dominican Republic1,259 Peru1,175 Argentina697 Mexico602 Spain586 Chile585 India567 Nicaragua376 Panama320 Bolivia316 Italy314 Honduras245 Japan242 France236 El Salvador222 Uruguay148 Costa Rica140 Korea126 Thailand125 Canada110 Guatemala110 Portugal103 Taiwan97 Lebanon96 Philippines88 China67 Morocco64 Netherlands62 Poland52 Turkey50 Romania49 Haiti46 Kuwait45 Hong Kong41 Israel41 Pakistan40 Egypt37 Jamaica35 Russia32 Germany27 Burma (Myanmar)26 Vietnam24 Trinidad and Tobago24 Syria21 Ireland18 Croatia18 Barbados14 Greece14 Czechoslovakia13 Bulgaria13 Sweden12 Bangladesh11 England10 Austria9 United Kingdom7 Denmark7 Belize3 Jordan
Grandparents responsible for own grandchildren in Doral
Grandparents (30 to 59 years) White / Caucasian 62 19.6% Responsible for grandchildren255 80.4% Not responsible for grandchildrenAsian 48 100.0% Not responsible for grandchildrenTwo or more races 39 41.1% Responsible for grandchildren56 58.9% Not responsible for grandchildrenWhite alone, not Hispanic / Latino 87 95.5% Responsible for grandchildren4 4.5% Not responsible for grandchildrenHispanic or Latino 84 17.0% Responsible for grandchildren413 83.0% Not responsible for grandchildrenGrandparents (60 years and over) White / Caucasian 26 5.5% Responsible for grandchildren445 94.5% Not responsible for grandchildrenAsian 124 100.0% Not responsible for grandchildrenTwo or more races 50 12.2% Responsible for grandchildren359 87.8% Not responsible for grandchildrenWhite alone, not Hispanic / Latino 26 100.0% Not responsible for grandchildrenHispanic or Latino 114 7.6% Responsible for grandchildren1,386 92.4% Not responsible for grandchildren