Races in Clarksville, Tennessee (TN) Detailed Stats
Data:
Races - White alone (%)
Races - White alone (% change since 2000)
Races - Black alone (%)
Races - Black alone (% change since 2000)
Races - American Indian alone (%)
Races - American Indian alone (% change since 2000)
Races - Asian alone (%)
Races - Asian alone (% change since 2000)
Races - Hispanic (%)
Races - Hispanic (% change since 2000)
Races - Native Hawaiian and Other Pacific Islander alone (%)
Races - Native Hawaiian and Other Pacific Islander alone (% change since 2000)
Races - Two or more races(%)
Races - Two or more races(% change since 2000)
Races - Other race alone (%)
Races - Other race alone (% change since 2000)
Racial diversity
Place of birth - Born in state of residence (%)
Place of birth - Born in state of residence (%) - White
Place of birth - Born in state of residence (%) - Black or African American
Place of birth - Born in state of residence (%) - Asian
Place of birth - Born in state of residence (%) - Hispanic or Latino
Place of birth - Born in state of residence (%) - American Indian and Alaska Native
Place of birth - Born in state of residence (%) - Multirace
Place of birth - Born in state of residence (%) - Other Race
Place of birth - Born in other state (%)
Place of birth - Born in other state (%) - White
Place of birth - Born in other state (%) - Black or African American
Place of birth - Born in other state (%) - Asian
Place of birth - Born in other state (%) - Hispanic or Latino
Place of birth - Born in other state (%) - American Indian and Alaska Native
Place of birth - Born in other state (%) - Multirace
Place of birth - Born in other state (%) - Other Race
Place of birth - Native, outside of US (%)
Place of birth - Native, outside of US (%) - White
Place of birth - Native, outside of US (%) - Black or African American
Place of birth - Native, outside of US (%) - Asian
Place of birth - Native, outside of US (%) - Hispanic or Latino
Place of birth - Native, outside of US (%) - American Indian and Alaska Native
Place of birth - Native, outside of US (%) - Multirace
Place of birth - Native, outside of US (%) - Other Race
Place of birth - Foreign born (%)
Place of birth - Foreign born (%) - White
Place of birth - Foreign born (%) - Black or African American
Place of birth - Foreign born (%) - Asian
Place of birth - Foreign born (%) - Hispanic or Latino
Place of birth - Foreign born (%) - American Indian and Alaska Native
Place of birth - Foreign born (%) - Multirace
Place of birth - Foreign born (%) - Other Race
Residents speaking English at home (%)
Residents speaking English at home - Born in the United States (%)
Residents speaking English at home - Native, born elsewhere (%)
Residents speaking English at home - Foreign born (%)
Residents speaking Spanish at home (%)
Residents speaking Spanish at home - Born in the United States (%)
Residents speaking Spanish at home - Native, born elsewhere (%)
Residents speaking Spanish at home - Foreign born (%)
Residents speaking other language at home (%)
Residents speaking other language at home - Born in the United States (%)
Residents speaking other language at home - Native, born elsewhere (%)
Residents speaking other language at home - Foreign born (%)
Marital status - Never married (%)
Marital status - Now married (%)
Marital status - Separated (%)
Marital status - Widowed (%)
Marital status - Divorced (%)
Ancestries Reported - Arab (%)
Ancestries Reported - Czech (%)
Ancestries Reported - Danish (%)
Ancestries Reported - Dutch (%)
Ancestries Reported - English (%)
Ancestries Reported - French (%)
Ancestries Reported - French Canadian (%)
Ancestries Reported - German (%)
Ancestries Reported - Greek (%)
Ancestries Reported - Hungarian (%)
Ancestries Reported - Irish (%)
Ancestries Reported - Italian (%)
Ancestries Reported - Lithuanian (%)
Ancestries Reported - Norwegian (%)
Ancestries Reported - Polish (%)
Ancestries Reported - Portuguese (%)
Ancestries Reported - Russian (%)
Ancestries Reported - Scotch-Irish (%)
Ancestries Reported - Scottish (%)
Ancestries Reported - Slovak (%)
Ancestries Reported - Subsaharan African (%)
Ancestries Reported - Swedish (%)
Ancestries Reported - Swiss (%)
Ancestries Reported - Ukrainian (%)
Ancestries Reported - United States (%)
Ancestries Reported - Welsh (%)
Ancestries Reported - West Indian (%)
Ancestries Reported - Other (%)
Geographical mobility - Same house 1 year ago (%)
Geographical mobility - Same house 1 year ago (%) - White
Geographical mobility - Same house 1 year ago (%) - Black or African American
Geographical mobility - Same house 1 year ago (%) - Asian
Geographical mobility - Same house 1 year ago (%) - Hispanic or Latino
Geographical mobility - Same house 1 year ago (%) - American Indian and Alaska Native
Geographical mobility - Same house 1 year ago (%) - Multirace
Geographical mobility - Same house 1 year ago (%) - Other Race
Geographical mobility - Moved within same county (%)
Geographical mobility - Moved within same county (%) - White
Geographical mobility - Moved within same county (%) - Black or African American
Geographical mobility - Moved within same county (%) - Asian
Geographical mobility - Moved within same county (%) - Hispanic or Latino
Geographical mobility - Moved within same county (%) - American Indian and Alaska Native
Geographical mobility - Moved within same county (%) - Multirace
Geographical mobility - Moved within same county (%) - Other Race
Geographical mobility - Moved from different county within same state (%)
Geographical mobility - Moved from different county within same state (%) - White
Geographical mobility - Moved from different county within same state (%) - Black or African American
Geographical mobility - Moved from different county within same state (%) - Asian
Geographical mobility - Moved from different county within same state (%) - Hispanic or Latino
Geographical mobility - Moved from different county within same state (%) - American Indian and Alaska Native
Geographical mobility - Moved from different county within same state (%) - Multirace
Geographical mobility - Moved from different county within same state (%) - Other Race
Geographical mobility - Moved from different state (%)
Geographical mobility - Moved from different state (%) - White
Geographical mobility - Moved from different state (%) - Black or African American
Geographical mobility - Moved from different state (%) - Asian
Geographical mobility - Moved from different state (%) - Hispanic or Latino
Geographical mobility - Moved from different state (%) - American Indian and Alaska Native
Geographical mobility - Moved from different state (%) - Multirace
Geographical mobility - Moved from different state (%) - Other Race
Geographical mobility - Moved from abroad (%)
Geographical mobility - Moved from abroad (%) - White
Geographical mobility - Moved from abroad (%) - Black or African American
Geographical mobility - Moved from abroad (%) - Asian
Geographical mobility - Moved from abroad (%) - Hispanic or Latino
Geographical mobility - Moved from abroad (%) - American Indian and Alaska Native
Geographical mobility - Moved from abroad (%) - Multirace
Geographical mobility - Moved from abroad (%) - Other Race
Place of birth for the foreign-born population - Ireland (%)
Place of birth for the foreign-born population - Denmark (%)
Place of birth for the foreign-born population - Norway (%)
Place of birth for the foreign-born population - Sweden (%)
Place of birth for the foreign-born population - United Kingdom (%)
Place of birth for the foreign-born population - England (%)
Place of birth for the foreign-born population - Scotland (%)
Place of birth for the foreign-born population - Other Northern Europe (%)
Place of birth for the foreign-born population - Austria (%)
Place of birth for the foreign-born population - Belgium (%)
Place of birth for the foreign-born population - France (%)
Place of birth for the foreign-born population - Germany (%)
Place of birth for the foreign-born population - Netherlands (%)
Place of birth for the foreign-born population - Switzerland (%)
Place of birth for the foreign-born population - Other Western Europe (%)
Place of birth for the foreign-born population - Greece (%)
Place of birth for the foreign-born population - Italy (%)
Place of birth for the foreign-born population - Portugal (%)
Place of birth for the foreign-born population - Spain (%)
Place of birth for the foreign-born population - Other Southern Europe (%)
Place of birth for the foreign-born population - Albania (%)
Place of birth for the foreign-born population - Belarus (%)
Place of birth for the foreign-born population - Bosnia and Herzegovina (%)
Place of birth for the foreign-born population - Bulgaria (%)
Place of birth for the foreign-born population - Croatia (%)
Place of birth for the foreign-born population - Czechoslovakia (%)
Place of birth for the foreign-born population - Hungary (%)
Place of birth for the foreign-born population - Latvia (%)
Place of birth for the foreign-born population - Lithuania (%)
Place of birth for the foreign-born population - North Macedonia (Macedonia) (%)
Place of birth for the foreign-born population - Moldova (%)
Place of birth for the foreign-born population - Poland (%)
Place of birth for the foreign-born population - Romania (%)
Place of birth for the foreign-born population - Russia (%)
Place of birth for the foreign-born population - Serbia (%)
Place of birth for the foreign-born population - Ukraine (%)
Place of birth for the foreign-born population - Other Eastern Europe (%)
Place of birth for the foreign-born population - China (%)
Place of birth for the foreign-born population - Hong Kong (%)
Place of birth for the foreign-born population - Taiwan (%)
Place of birth for the foreign-born population - Japan (%)
Place of birth for the foreign-born population - Korea (%)
Place of birth for the foreign-born population - Other Eastern Asia (%)
Place of birth for the foreign-born population - Afghanistan (%)
Place of birth for the foreign-born population - Bangladesh (%)
Place of birth for the foreign-born population - India (%)
Place of birth for the foreign-born population - Iran (%)
Place of birth for the foreign-born population - Kazakhstan (%)
Place of birth for the foreign-born population - Nepal (%)
Place of birth for the foreign-born population - Pakistan (%)
Place of birth for the foreign-born population - Sri Lanka (%)
Place of birth for the foreign-born population - Uzbekistan (%)
Place of birth for the foreign-born population - Other South Central Asia (%)
Place of birth for the foreign-born population - Burma (%)
Place of birth for the foreign-born population - Cambodia (%)
Place of birth for the foreign-born population - Indonesia (%)
Place of birth for the foreign-born population - Laos (%)
Place of birth for the foreign-born population - Malaysia (%)
Place of birth for the foreign-born population - Philippines (%)
Place of birth for the foreign-born population - Singapore (%)
Place of birth for the foreign-born population - Thailand (%)
Place of birth for the foreign-born population - Vietnam (%)
Place of birth for the foreign-born population - Other South Eastern Asia (%)
Place of birth for the foreign-born population - Armenia (%)
Place of birth for the foreign-born population - Iraq (%)
Place of birth for the foreign-born population - Israel (%)
Place of birth for the foreign-born population - Jordan (%)
Place of birth for the foreign-born population - Kuwait (%)
Place of birth for the foreign-born population - Lebanon (%)
Place of birth for the foreign-born population - Saudi Arabia (%)
Place of birth for the foreign-born population - Syria (%)
Place of birth for the foreign-born population - Turkey (%)
Place of birth for the foreign-born population - Yemen (%)
Place of birth for the foreign-born population - Other Western Asia (%)
Place of birth for the foreign-born population - Eritrea (%)
Place of birth for the foreign-born population - Ethiopia (%)
Place of birth for the foreign-born population - Kenya (%)
Place of birth for the foreign-born population - Somalia (%)
Place of birth for the foreign-born population - Uganda (%)
Place of birth for the foreign-born population - Zimbabwe (%)
Place of birth for the foreign-born population - Other Eastern Africa (%)
Place of birth for the foreign-born population - Cameroon (%)
Place of birth for the foreign-born population - Congo (%)
Place of birth for the foreign-born population - Democratic Republic of Congo (Zaire) (%)
Place of birth for the foreign-born population - Other Middle Africa (%)
Place of birth for the foreign-born population - Egypt (%)
Place of birth for the foreign-born population - Morocco (%)
Place of birth for the foreign-born population - Sudan (%)
Place of birth for the foreign-born population - Other Northern Africa (%)
Place of birth for the foreign-born population - South Africa (%)
Place of birth for the foreign-born population - Other Southern Africa (%)
Place of birth for the foreign-born population - Cabo Verde (%)
Place of birth for the foreign-born population - Ghana (%)
Place of birth for the foreign-born population - Liberia (%)
Place of birth for the foreign-born population - Nigeria (%)
Place of birth for the foreign-born population - Senegal (%)
Place of birth for the foreign-born population - Sierra Leone (%)
Place of birth for the foreign-born population - Other Western Africa (%)
Place of birth for the foreign-born population - Australia (%)
Place of birth for the foreign-born population - New Zealand (%)
Place of birth for the foreign-born population - Fiji (%)
Place of birth for the foreign-born population - Micronesia (%)
Place of birth for the foreign-born population - Bahamas (%)
Place of birth for the foreign-born population - Barbados (%)
Place of birth for the foreign-born population - Cuba (%)
Place of birth for the foreign-born population - Dominica (%)
Place of birth for the foreign-born population - Dominican Republic (%)
Place of birth for the foreign-born population - Grenada (%)
Place of birth for the foreign-born population - Haiti (%)
Place of birth for the foreign-born population - Jamaica (%)
Place of birth for the foreign-born population - St. Vincent and the Grenadines (%)
Place of birth for the foreign-born population - Trinidad and Tobago (%)
Place of birth for the foreign-born population - West Indies (%)
Place of birth for the foreign-born population - Other Caribbean (%)
Place of birth for the foreign-born population - Belize (%)
Place of birth for the foreign-born population - Costa Rica (%)
Place of birth for the foreign-born population - El Salvador (%)
Place of birth for the foreign-born population - Guatemala (%)
Place of birth for the foreign-born population - Honduras (%)
Place of birth for the foreign-born population - Mexico (%)
Place of birth for the foreign-born population - Nicaragua (%)
Place of birth for the foreign-born population - Panama (%)
Place of birth for the foreign-born population - Other Central America (%)
Place of birth for the foreign-born population - Argentina (%)
Place of birth for the foreign-born population - Bolivia (%)
Place of birth for the foreign-born population - Brazil (%)
Place of birth for the foreign-born population - Chile (%)
Place of birth for the foreign-born population - Colombia (%)
Place of birth for the foreign-born population - Ecuador (%)
Place of birth for the foreign-born population - Guyana (%)
Place of birth for the foreign-born population - Peru (%)
Place of birth for the foreign-born population - Uruguay (%)
Place of birth for the foreign-born population - Venezuela (%)
Place of birth for the foreign-born population - Other South America (%)
Place of birth for the foreign-born population - Canada (%)
Place of birth for the foreign-born population - Other Northern America (%)
Place of birth for the foreign-born population - Other (%)
Latest news about races in Clarksville, TN collected exclusively by city-data.com from local newspapers, TV, and radio stations
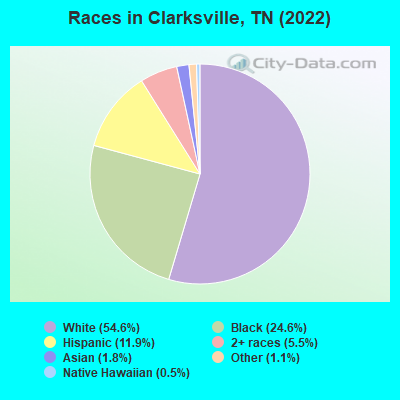
According to 2022 data, the most numerous races in Clarksville, TN are White alone (96,654 residents), Black alone (43,461 residents), and Hispanic (21,065 residents). 88.4% of Clarksville residents speak English at home. 6.5% of Clarksville, TN residents are foreign-born (2.8% born in Latin America, 2.0% born in Asia, 0.8% born in Europe), which is 23.0% greater than the foreign-born rate of 5.0% across the entire state of Tennessee.
Race distribution in Clarksville
2000 2022
67,562 65.3% White alone 23,692 22.9% Black alone 6,241 6.0% Hispanic 2,717 2.6% Two or more races 2,189 2.1% Asian alone 486 0.5% American Indian alone 320 0.3% Other race alone 248 0.2% Native Hawaiian and Other
96,654 54.6% White alone 43,461 24.6% Black alone 21,065 11.9% Hispanic 9,649 5.5% Two or more races 3,160 1.8% Asian alone 1,927 1.1% Other race alone 955 0.5% Native Hawaiian and Other 106 0.06% American Indian alone
2000 2022
4,505,930 79.2% White alone 928,204 16.3% Black alone 123,838 2.2% Hispanic 54,824 1.0% Two or more races 56,077 1.0% Asian alone 13,820 0.2% American Indian alone 4,780 0.08% Other race alone 1,810 0.03% Native Hawaiian and Other
5,070,026 71.9% White alone 1,089,738 15.5% Black alone 442,629 6.3% Hispanic 279,381 4.0% Two or more races 131,817 1.9% Asian alone 26,972 0.4% Other race alone 6,387 0.09% American Indian alone 4,389 0.06% Native Hawaiian and Other
Income and house value in Clarksville Median household income in 2022 $67,805 White non-Hispanic householders$56,501 Black householders$65,231 Asian householders$49,938 Some other race householders$50,689 Two or more races householders$50,750 Hispanic or Latino race householdersMedian 2022 house value $269,094 White Non-Hispanic householders$250,525 Black or African American householders$240,139 American Indian or Alaska Native householders $280,110 Asian householders$301,197 Native Hawaiian and other Pacific Islander householders$265,317 Some other race householders$234,788 Two or more races householders$259,967 Hispanic or Latino householders
Median age by race in Clarksville
32.6 Median age for White residents31.9 34.2 31.1 Median age for Black or African American residents28.9 31.8 36.3 Median age for American Indian / Alaska Native residents-666,666,666.0 36.4 41.9 Median age for Asian residents34.6 50.2 14.8 Median age for Native Hawaiian / Pacific Islander residents27.8 14.6 29.5 Median age for Other race residents31.9 25.5 19.7 Median age for Two or more races residents17.7 20.3 32.9 Median age for White alone residents32.3 34.5 27.1 Median age for Hispanic or Latino residents29.0 25.6
Owner/renter occupied households by race in Clarksville
House owners and renters - White residents 26,804 64.6% Owner occupied14,689 35.4% Renter occupiedHouse owners and renters - Black or African American residents 8,237 47.7% Owner occupied9,028 52.3% Renter occupiedHouse owners and renters - American Indian / Alaska Native residents 216 55.2% Owner occupied175 44.8% Renter occupiedHouse owners and renters - Asian residents 771 56.2% Owner occupied600 43.8% Renter occupiedHouse owners and renters - Native Hawaiian / Pacific Islander residents 27 15.5% Owner occupied147 84.5% Renter occupiedHouse owners and renters - Other race residents 2,151 71.4% Owner occupied862 28.6% Renter occupiedHouse owners and renters - Two or more races residents 2,579 49.2% Owner occupied2,660 50.8% Renter occupiedHouse owners and renters - White alone residents 25,517 64.1% Owner occupied14,274 35.9% Renter occupiedHouse owners and renters - Hispanic or Latino residents 4,612 63.6% Owner occupied2,634 36.4% Renter occupied
Language usage in Clarksville
English speakers - Total 88.4% of residents of Clarksville speak English at home.
6.8% of residents speak Spanish at home 6,753 61.3% Speak English very well4,257 38.7% Speak English less than very well4.8% of residents speak other language at home 6,651 85.0% Speak English very well1,172 15.0% Speak English less than very well
English speakers - Born in the United States 91.4% of residents of Clarksville speak English at home.
5.1% of residents speak Spanish at home 4,029 84.6% Speak English very well733 15.4% Speak English less than very well3.5% of residents speak other language at home 3,130 95.8% Speak English very well137 4.2% Speak English less than very well
English speakers - Native, born elsewhere 65.7% of residents of Clarksville speak English at home.
30.8% of residents speak Spanish at home 1,619 70.8% Speak English very well669 29.2% Speak English less than very well3.5% of residents speak other language at home 140 54.5% Speak English very well117 45.5% Speak English less than very well
English speakers - Foreign-born 39.6% of residents of Clarksville speak English at home.
24.7% of residents speak Spanish at home 383 14.0% Speak English very well2,360 86.0% Speak English less than very well35.7% of residents speak other language at home 3,134 79.1% Speak English very well827 20.9% Speak English less than very well
White (Caucasian) - Speak only English Native:
96.3% (89,095)Foreign-born:
66.2% (1,839)
White (Caucasian) - Speak another language Native:
3.7% (3,405)Foreign-born:
33.8% (940)
Black or African American - Speak only English Native:
93.7% (35,546)Foreign-born:
35.0% (827)
Black or African American - Speak another language Native:
6.3% (2,390)Foreign-born:
65.0% (1,533)
American Indian / Alaska Native - Speak another language Native:
41.6% (302)Foreign-born:
100.0% (143)
Asian - Speak only English Native:
42.8% (530)Foreign-born:
35.3% (792)
Asian - Speak another language Native:
57.2% (707)Foreign-born:
64.7% (1,449)
Native Hawaiian / Pacific Islander - Speak only English Native:
94.0% (220)Foreign-born:
50.4% (226)
Native Hawaiian / Pacific Islander - Speak another language Native:
8.8% (21)Foreign-born:
35.5% (159)
Other race - Speak only English Native:
59.4% (2,266)Foreign-born:
18.1% (285)
Other race - Speak another language Native:
41.7% (1,590)Foreign-born:
76.0% (1,195)
Two or more races - Speak only English Native:
76.2% (10,999)Foreign-born:
12.4% (288)
Two or more races - Speak another language Native:
23.8% (3,426)Foreign-born:
87.6% (2,030)
White alone - Speak only English Native:
97.9% (85,755)Foreign-born:
71.2% (1,839)
White alone - Speak another language Native:
2.1% (1,854)Foreign-born:
28.8% (745)
Hispanic or Latino - Speak only English Native:
55.8% (8,486)Foreign-born:
12.4% (402)
Hispanic or Latino - Speak another language Native:
44.2% (6,710)Foreign-born:
87.6% (2,847)
Foreign-born residents in Clarksville 11,530 residents are foreign born (2.8% Latin America , 2.0% Asia , 0.8% Europe ).
This city:
6.5%Tennessee:
5.4%
Marital status for residents in Clarksville Marital status - White (Caucasian) population 15 years and over
Males 29.8% Never married57.2% Now married0.4% Separated2.4% Widowed10.2% DivorcedFemales 23.7% Never married54.1% Now married1.7% Separated9.1% Widowed11.3% DivorcedWomen who gave birth in the past 12 months Now married:
92.5% (1,164)Unmarried:
7.5% (94)
Women who did not give birth in the past 12 months Now married:
55.2% (14,141)Unmarried:
44.8% (11,472)
Marital status - Black or African American population 15 years and over
Males 43.1% Never married39.9% Now married2.7% Separated2.0% Widowed12.3% DivorcedFemales 40.7% Never married29.7% Now married5.9% Separated8.0% Widowed15.8% DivorcedWomen who gave birth in the past 12 months Now married:
96.8% (632)Unmarried:
3.2% (21)
Women who did not give birth in the past 12 months Now married:
28.6% (3,534)Unmarried:
71.4% (8,823)
Marital status - American Indian / Alaska Native population 15 years and over
Males 36.0% Never married38.0% Now married8.8% Separated1.9% Widowed15.3% DivorcedFemales 24.9% Never married45.1% Now married10.2% Separated6.5% Widowed13.2% DivorcedWomen who gave birth in the past 12 months Now married:
100.0% (26)Unmarried:
0.0% (0)
Women who did not give birth in the past 12 months Now married:
36.1% (97)Unmarried:
63.9% (171)
Marital status - Asian population 15 years and over
Males 41.1% Never married53.8% Now married0.0% Separated0.0% Widowed5.2% DivorcedFemales 18.4% Never married59.6% Now married3.3% Separated6.7% Widowed12.0% DivorcedWomen who gave birth in the past 12 months Now married:
90.0% (56)Unmarried:
10.0% (6)
Women who did not give birth in the past 12 months Now married:
64.3% (943)Unmarried:
35.7% (524)
Marital status - Native Hawaiian / Pacific Islander population 15 years and over
Males 50.0% Never married39.7% Now married0.0% Separated10.3% Widowed0.0% DivorcedFemales 54.1% Never married19.8% Now married0.0% Separated24.5% Widowed1.6% DivorcedWomen who gave birth in the past 12 months Now married:
0.0% (0)Unmarried:
100.0% (136)
Women who did not give birth in the past 12 months Now married:
33.1% (49)Unmarried:
66.9% (98)
Marital status - Other race population 15 years and over
Males 41.3% Never married46.8% Now married6.8% Separated0.0% Widowed5.2% DivorcedFemales 53.2% Never married37.9% Now married1.0% Separated0.5% Widowed7.4% DivorcedWomen who gave birth in the past 12 months Now married:
52.5% (63)Unmarried:
47.5% (57)
Women who did not give birth in the past 12 months Now married:
35.7% (506)Unmarried:
64.3% (909)
Marital status - Two or more races population 15 years and over
Males 39.2% Never married54.4% Now married0.0% Separated0.0% Widowed6.3% DivorcedFemales 36.5% Never married37.6% Now married10.1% Separated7.1% Widowed8.7% DivorcedWomen who gave birth in the past 12 months Now married:
100.0% (515)Unmarried:
0.0% (0)
Women who did not give birth in the past 12 months Now married:
43.8% (1,717)Unmarried:
56.2% (2,205)
Marital status - White alone, not Hispanic / Latino population 15 years and over
Males 29.2% Never married57.1% Now married0.4% Separated2.6% Widowed10.7% DivorcedFemales 24.0% Never married53.5% Now married1.8% Separated9.6% Widowed11.2% DivorcedWomen who gave birth in the past 12 months Now married:
94.5% (1,004)Unmarried:
5.5% (58)
Women who did not give birth in the past 12 months Now married:
55.0% (13,393)Unmarried:
45.0% (10,971)
Marital status - Hispanic or Latino population 15 years and over
Males 35.1% Never married55.1% Now married7.2% Separated0.0% Widowed2.7% DivorcedFemales 25.2% Never married55.0% Now married8.0% Separated3.3% Widowed8.5% DivorcedWomen who gave birth in the past 12 months Now married:
95.5% (770)Unmarried:
4.5% (36)
Women who did not give birth in the past 12 months Now married:
55.4% (2,535)Unmarried:
44.6% (2,043)
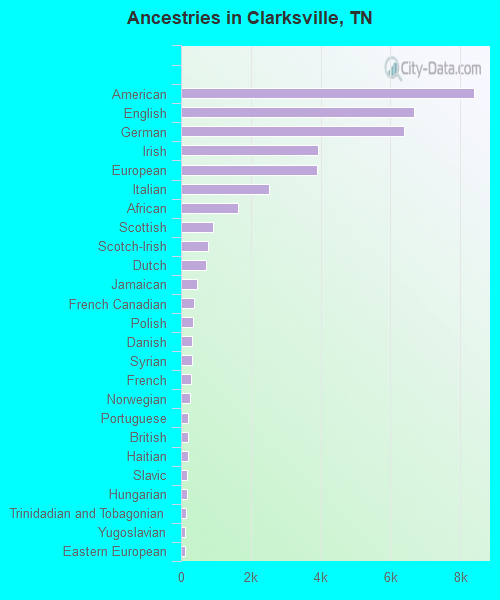
Ancestries in Clarksville
8,410 9.8% American6,667 7.8% English6,405 7.5% German3,921 4.6% Irish3,891 4.5% European2,528 2.9% Italian1,630 1.9% African905 1.1% Scottish786 0.9% Scotch-Irish719 0.8% Dutch459 0.5% Jamaican385 0.4% French Canadian337 0.4% Polish312 0.4% Danish304 0.4% Syrian296 0.3% French270 0.3% Norwegian212 0.2% Portuguese210 0.2% British205 0.2% Haitian163 0.2% Slavic163 0.2% Hungarian139 0.2% Trinidadian and Tobagonian126 0.1% Yugoslavian118 0.1% Eastern European105 0.1% Albanian103 0.1% Brazilian102 0.1% Greek99 0.1% Swedish95 0.1% Moroccan94 0.1% Welsh89 0.1% Guyanese84 0.10% Nigerian78 0.09% Basque77 0.09% Ethiopian74 0.09% Finnish73 0.08% Lebanese70 0.08% Iraqi66 0.08% Scandinavian54 0.06% Belgian51 0.06% Kenyan43 0.05% Russian41 0.05% Latvian40 0.05% West Indian39 0.05% British West Indian37 0.04% Celtic36 0.04% Czech36 0.04% Ukrainian30 0.03% Romanian28 0.03% Canadian25 0.03% Liberian24 0.03% Cajun23 0.03% Egyptian23 0.03% U.S. Virgin Islander21 0.02% Sudanese19 0.02% Czechoslovakian19 0.02% Serbian16 0.02% Austrian15 0.02% Dutch West Indian13 0.02% Jordanian13 0.02% Lithuanian11 0.01% Swiss
Geographical mobility in Clarksville Same house 1 year ago 79,892 79.6% White (Caucasian)34,687 81.1% Black or African American722 86.0% American Indian / Alaska Native3,595 76.3% Asian494 92.8% Native Hawaiian / Pacific Islander3,984 69.0% Other race13,392 69.1% Two or more races76,301 80.3% White alone, not Hispanic / Latino13,355 65.0% Hispanic or LatinoMoved within same county 7,941 7.9% White / Caucasian2,334 5.5% Black or African American32 3.8% American Indian / Alaska Native429 9.1% Asian645 11.2% Other race4,757 24.5% Two or more races7,563 8.0% White alone, not Hispanic / Latino4,123 20.1% Hispanic or LatinoMoved within same state 3,466 3.5% White / Caucasian2,987 7.0% Black or African American160 3.4% Asian217 3.8% Other race37 0.2% Two or more races3,466 3.6% White alone, not Hispanic / Latino121 0.6% Hispanic or LatinoMoved from different state 8,437 8.4% White / Caucasian836 2.0% Black or African American132 15.8% American Indian / Alaska Native219 4.6% Asian42 7.9% Native Hawaiian / Pacific Islander869 15.1% Other race1,123 5.8% Two or more races7,314 7.7% White alone, not Hispanic / Latino2,548 12.4% Hispanic or LatinoMoved from abroad 570 0.6% White1,944 4.5% Black or African American267 5.7% Asian1 0.1% Native Hawaiian / Pacific Islander51 0.9% Other race70 0.4% Two or more races403 0.4% White alone, not Hispanic / Latino396 1.9% Hispanic or Latino
Children Nativity (place of birth) in Clarksville
Children under 6 years - Living with two parents Both parents native 9,467 100.0% NativeBoth parents foreign-born 247 100.0% NativeOne native, one foreign-born parent 994 100.0% NativeChildren under 6 years - Living with one parent Native parent 5,290 100.0% NativeForeign-born parent 323 100.0% NativeChildren 6 to 17 years - Living with two parents Both parents native 13,219 99.2% Native102 0.8% Foreign-bornBoth parents foreign-born 533 73.7% Native190 26.3% Foreign-bornOne native, one foreign-born parent 1,554 97.2% Native44 2.8% Foreign-bornChildren 6 to 17 years - Living with one parent Native parent 9,728 100.0% NativeForeign-born parent 1,095 55.5% Native877 44.5% Foreign-born
Grandparents responsible for own grandchildren in Clarksville
Grandparents (30 to 59 years) White / Caucasian 280 49.4% Responsible for grandchildren286 50.6% Not responsible for grandchildrenBlack or African American 226 57.5% Responsible for grandchildren167 42.5% Not responsible for grandchildrenAmerican Indian / Alaska Native 33 100.0% Responsible for grandchildrenNative Hawaiian / Pacific Islander 101 100.0% Responsible for grandchildrenOther race 134 100.0% Not responsible for grandchildrenTwo or more races 128 74.3% Responsible for grandchildren44 25.7% Not responsible for grandchildrenWhite alone, not Hispanic / Latino 280 57.7% Responsible for grandchildren205 42.3% Not responsible for grandchildrenHispanic or Latino 83 100.0% Not responsible for grandchildrenGrandparents (60 years and over) White / Caucasian 336 37.7% Responsible for grandchildren556 62.3% Not responsible for grandchildrenBlack or African American 128 31.7% Responsible for grandchildren275 68.3% Not responsible for grandchildrenTwo or more races 20 18.8% Responsible for grandchildren87 81.2% Not responsible for grandchildrenWhite alone, not Hispanic / Latino 301 35.0% Responsible for grandchildren559 65.0% Not responsible for grandchildrenHispanic or Latino 37 100.0% Responsible for grandchildren