Races in China Spring, Texas (TX) Detailed Stats
Ancestries, Foreign-born residents, place of birth

Data:
Race distribution in China Spring

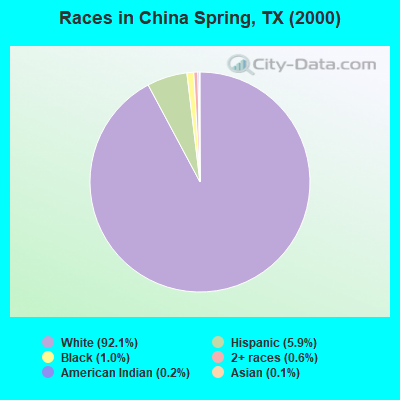
- 3,76492.1%White alone
- 2415.9%Hispanic
- 401.0%Black alone
- 260.6%Two or more races
- 80.2%American Indian alone
- 50.1%Asian alone
- 30.07%Other race alone
2000
2022
-
- 10,933,31352.4%White alone
- 6,669,66632.0%Hispanic
- 2,364,25511.3%Black alone
- 554,4452.7%Asian alone
- 230,5671.1%Two or more races
- 68,8590.3%American Indian alone
- 19,9580.10%Other race alone
- 10,7570.05%Native Hawaiian and Other
Pacific Islander alone
-
- 12,070,64240.2%Hispanic
- 11,683,43038.9%White alone
- 3,508,70611.7%Black alone
- 1,608,1735.4%Asian alone
- 956,5603.2%Two or more races
- 125,7630.4%Other race alone
- 47,0230.2%American Indian alone
- 29,2750.10%Native Hawaiian and Other
Pacific Islander alone
Income and house value in China Spring
- Median household income in 2022
- $103,651White non-Hispanic householders
- $119,002Black householders
- $88,769American Indian and Alaska Native householders
- $44,431Some other race householders
- $45,508Hispanic or Latino race householders
- Median 2022 house value
- $323,385White Non-Hispanic householders
- $193,328Black or African American householders
- $263,629American Indian or Alaska Native householders
- $158,177Some other race householders
- $207,388Hispanic or Latino householders