Races in Boca Raton, Florida (FL) Detailed Stats
Data:
Races - White alone (%)
Races - White alone (% change since 2000)
Races - Black alone (%)
Races - Black alone (% change since 2000)
Races - American Indian alone (%)
Races - American Indian alone (% change since 2000)
Races - Asian alone (%)
Races - Asian alone (% change since 2000)
Races - Hispanic (%)
Races - Hispanic (% change since 2000)
Races - Native Hawaiian and Other Pacific Islander alone (%)
Races - Native Hawaiian and Other Pacific Islander alone (% change since 2000)
Races - Two or more races(%)
Races - Two or more races(% change since 2000)
Races - Other race alone (%)
Races - Other race alone (% change since 2000)
Racial diversity
Place of birth - Born in state of residence (%)
Place of birth - Born in state of residence (%) - White
Place of birth - Born in state of residence (%) - Black or African American
Place of birth - Born in state of residence (%) - Asian
Place of birth - Born in state of residence (%) - Hispanic or Latino
Place of birth - Born in state of residence (%) - American Indian and Alaska Native
Place of birth - Born in state of residence (%) - Multirace
Place of birth - Born in state of residence (%) - Other Race
Place of birth - Born in other state (%)
Place of birth - Born in other state (%) - White
Place of birth - Born in other state (%) - Black or African American
Place of birth - Born in other state (%) - Asian
Place of birth - Born in other state (%) - Hispanic or Latino
Place of birth - Born in other state (%) - American Indian and Alaska Native
Place of birth - Born in other state (%) - Multirace
Place of birth - Born in other state (%) - Other Race
Place of birth - Native, outside of US (%)
Place of birth - Native, outside of US (%) - White
Place of birth - Native, outside of US (%) - Black or African American
Place of birth - Native, outside of US (%) - Asian
Place of birth - Native, outside of US (%) - Hispanic or Latino
Place of birth - Native, outside of US (%) - American Indian and Alaska Native
Place of birth - Native, outside of US (%) - Multirace
Place of birth - Native, outside of US (%) - Other Race
Place of birth - Foreign born (%)
Place of birth - Foreign born (%) - White
Place of birth - Foreign born (%) - Black or African American
Place of birth - Foreign born (%) - Asian
Place of birth - Foreign born (%) - Hispanic or Latino
Place of birth - Foreign born (%) - American Indian and Alaska Native
Place of birth - Foreign born (%) - Multirace
Place of birth - Foreign born (%) - Other Race
Residents speaking English at home (%)
Residents speaking English at home - Born in the United States (%)
Residents speaking English at home - Native, born elsewhere (%)
Residents speaking English at home - Foreign born (%)
Residents speaking Spanish at home (%)
Residents speaking Spanish at home - Born in the United States (%)
Residents speaking Spanish at home - Native, born elsewhere (%)
Residents speaking Spanish at home - Foreign born (%)
Residents speaking other language at home (%)
Residents speaking other language at home - Born in the United States (%)
Residents speaking other language at home - Native, born elsewhere (%)
Residents speaking other language at home - Foreign born (%)
Marital status - Never married (%)
Marital status - Now married (%)
Marital status - Separated (%)
Marital status - Widowed (%)
Marital status - Divorced (%)
Ancestries Reported - Arab (%)
Ancestries Reported - Czech (%)
Ancestries Reported - Danish (%)
Ancestries Reported - Dutch (%)
Ancestries Reported - English (%)
Ancestries Reported - French (%)
Ancestries Reported - French Canadian (%)
Ancestries Reported - German (%)
Ancestries Reported - Greek (%)
Ancestries Reported - Hungarian (%)
Ancestries Reported - Irish (%)
Ancestries Reported - Italian (%)
Ancestries Reported - Lithuanian (%)
Ancestries Reported - Norwegian (%)
Ancestries Reported - Polish (%)
Ancestries Reported - Portuguese (%)
Ancestries Reported - Russian (%)
Ancestries Reported - Scotch-Irish (%)
Ancestries Reported - Scottish (%)
Ancestries Reported - Slovak (%)
Ancestries Reported - Subsaharan African (%)
Ancestries Reported - Swedish (%)
Ancestries Reported - Swiss (%)
Ancestries Reported - Ukrainian (%)
Ancestries Reported - United States (%)
Ancestries Reported - Welsh (%)
Ancestries Reported - West Indian (%)
Ancestries Reported - Other (%)
Geographical mobility - Same house 1 year ago (%)
Geographical mobility - Same house 1 year ago (%) - White
Geographical mobility - Same house 1 year ago (%) - Black or African American
Geographical mobility - Same house 1 year ago (%) - Asian
Geographical mobility - Same house 1 year ago (%) - Hispanic or Latino
Geographical mobility - Same house 1 year ago (%) - American Indian and Alaska Native
Geographical mobility - Same house 1 year ago (%) - Multirace
Geographical mobility - Same house 1 year ago (%) - Other Race
Geographical mobility - Moved within same county (%)
Geographical mobility - Moved within same county (%) - White
Geographical mobility - Moved within same county (%) - Black or African American
Geographical mobility - Moved within same county (%) - Asian
Geographical mobility - Moved within same county (%) - Hispanic or Latino
Geographical mobility - Moved within same county (%) - American Indian and Alaska Native
Geographical mobility - Moved within same county (%) - Multirace
Geographical mobility - Moved within same county (%) - Other Race
Geographical mobility - Moved from different county within same state (%)
Geographical mobility - Moved from different county within same state (%) - White
Geographical mobility - Moved from different county within same state (%) - Black or African American
Geographical mobility - Moved from different county within same state (%) - Asian
Geographical mobility - Moved from different county within same state (%) - Hispanic or Latino
Geographical mobility - Moved from different county within same state (%) - American Indian and Alaska Native
Geographical mobility - Moved from different county within same state (%) - Multirace
Geographical mobility - Moved from different county within same state (%) - Other Race
Geographical mobility - Moved from different state (%)
Geographical mobility - Moved from different state (%) - White
Geographical mobility - Moved from different state (%) - Black or African American
Geographical mobility - Moved from different state (%) - Asian
Geographical mobility - Moved from different state (%) - Hispanic or Latino
Geographical mobility - Moved from different state (%) - American Indian and Alaska Native
Geographical mobility - Moved from different state (%) - Multirace
Geographical mobility - Moved from different state (%) - Other Race
Geographical mobility - Moved from abroad (%)
Geographical mobility - Moved from abroad (%) - White
Geographical mobility - Moved from abroad (%) - Black or African American
Geographical mobility - Moved from abroad (%) - Asian
Geographical mobility - Moved from abroad (%) - Hispanic or Latino
Geographical mobility - Moved from abroad (%) - American Indian and Alaska Native
Geographical mobility - Moved from abroad (%) - Multirace
Geographical mobility - Moved from abroad (%) - Other Race
Place of birth for the foreign-born population - Ireland (%)
Place of birth for the foreign-born population - Denmark (%)
Place of birth for the foreign-born population - Norway (%)
Place of birth for the foreign-born population - Sweden (%)
Place of birth for the foreign-born population - United Kingdom (%)
Place of birth for the foreign-born population - England (%)
Place of birth for the foreign-born population - Scotland (%)
Place of birth for the foreign-born population - Other Northern Europe (%)
Place of birth for the foreign-born population - Austria (%)
Place of birth for the foreign-born population - Belgium (%)
Place of birth for the foreign-born population - France (%)
Place of birth for the foreign-born population - Germany (%)
Place of birth for the foreign-born population - Netherlands (%)
Place of birth for the foreign-born population - Switzerland (%)
Place of birth for the foreign-born population - Other Western Europe (%)
Place of birth for the foreign-born population - Greece (%)
Place of birth for the foreign-born population - Italy (%)
Place of birth for the foreign-born population - Portugal (%)
Place of birth for the foreign-born population - Spain (%)
Place of birth for the foreign-born population - Other Southern Europe (%)
Place of birth for the foreign-born population - Albania (%)
Place of birth for the foreign-born population - Belarus (%)
Place of birth for the foreign-born population - Bosnia and Herzegovina (%)
Place of birth for the foreign-born population - Bulgaria (%)
Place of birth for the foreign-born population - Croatia (%)
Place of birth for the foreign-born population - Czechoslovakia (%)
Place of birth for the foreign-born population - Hungary (%)
Place of birth for the foreign-born population - Latvia (%)
Place of birth for the foreign-born population - Lithuania (%)
Place of birth for the foreign-born population - North Macedonia (Macedonia) (%)
Place of birth for the foreign-born population - Moldova (%)
Place of birth for the foreign-born population - Poland (%)
Place of birth for the foreign-born population - Romania (%)
Place of birth for the foreign-born population - Russia (%)
Place of birth for the foreign-born population - Serbia (%)
Place of birth for the foreign-born population - Ukraine (%)
Place of birth for the foreign-born population - Other Eastern Europe (%)
Place of birth for the foreign-born population - China (%)
Place of birth for the foreign-born population - Hong Kong (%)
Place of birth for the foreign-born population - Taiwan (%)
Place of birth for the foreign-born population - Japan (%)
Place of birth for the foreign-born population - Korea (%)
Place of birth for the foreign-born population - Other Eastern Asia (%)
Place of birth for the foreign-born population - Afghanistan (%)
Place of birth for the foreign-born population - Bangladesh (%)
Place of birth for the foreign-born population - India (%)
Place of birth for the foreign-born population - Iran (%)
Place of birth for the foreign-born population - Kazakhstan (%)
Place of birth for the foreign-born population - Nepal (%)
Place of birth for the foreign-born population - Pakistan (%)
Place of birth for the foreign-born population - Sri Lanka (%)
Place of birth for the foreign-born population - Uzbekistan (%)
Place of birth for the foreign-born population - Other South Central Asia (%)
Place of birth for the foreign-born population - Burma (%)
Place of birth for the foreign-born population - Cambodia (%)
Place of birth for the foreign-born population - Indonesia (%)
Place of birth for the foreign-born population - Laos (%)
Place of birth for the foreign-born population - Malaysia (%)
Place of birth for the foreign-born population - Philippines (%)
Place of birth for the foreign-born population - Singapore (%)
Place of birth for the foreign-born population - Thailand (%)
Place of birth for the foreign-born population - Vietnam (%)
Place of birth for the foreign-born population - Other South Eastern Asia (%)
Place of birth for the foreign-born population - Armenia (%)
Place of birth for the foreign-born population - Iraq (%)
Place of birth for the foreign-born population - Israel (%)
Place of birth for the foreign-born population - Jordan (%)
Place of birth for the foreign-born population - Kuwait (%)
Place of birth for the foreign-born population - Lebanon (%)
Place of birth for the foreign-born population - Saudi Arabia (%)
Place of birth for the foreign-born population - Syria (%)
Place of birth for the foreign-born population - Turkey (%)
Place of birth for the foreign-born population - Yemen (%)
Place of birth for the foreign-born population - Other Western Asia (%)
Place of birth for the foreign-born population - Eritrea (%)
Place of birth for the foreign-born population - Ethiopia (%)
Place of birth for the foreign-born population - Kenya (%)
Place of birth for the foreign-born population - Somalia (%)
Place of birth for the foreign-born population - Uganda (%)
Place of birth for the foreign-born population - Zimbabwe (%)
Place of birth for the foreign-born population - Other Eastern Africa (%)
Place of birth for the foreign-born population - Cameroon (%)
Place of birth for the foreign-born population - Congo (%)
Place of birth for the foreign-born population - Democratic Republic of Congo (Zaire) (%)
Place of birth for the foreign-born population - Other Middle Africa (%)
Place of birth for the foreign-born population - Egypt (%)
Place of birth for the foreign-born population - Morocco (%)
Place of birth for the foreign-born population - Sudan (%)
Place of birth for the foreign-born population - Other Northern Africa (%)
Place of birth for the foreign-born population - South Africa (%)
Place of birth for the foreign-born population - Other Southern Africa (%)
Place of birth for the foreign-born population - Cabo Verde (%)
Place of birth for the foreign-born population - Ghana (%)
Place of birth for the foreign-born population - Liberia (%)
Place of birth for the foreign-born population - Nigeria (%)
Place of birth for the foreign-born population - Senegal (%)
Place of birth for the foreign-born population - Sierra Leone (%)
Place of birth for the foreign-born population - Other Western Africa (%)
Place of birth for the foreign-born population - Australia (%)
Place of birth for the foreign-born population - New Zealand (%)
Place of birth for the foreign-born population - Fiji (%)
Place of birth for the foreign-born population - Micronesia (%)
Place of birth for the foreign-born population - Bahamas (%)
Place of birth for the foreign-born population - Barbados (%)
Place of birth for the foreign-born population - Cuba (%)
Place of birth for the foreign-born population - Dominica (%)
Place of birth for the foreign-born population - Dominican Republic (%)
Place of birth for the foreign-born population - Grenada (%)
Place of birth for the foreign-born population - Haiti (%)
Place of birth for the foreign-born population - Jamaica (%)
Place of birth for the foreign-born population - St. Vincent and the Grenadines (%)
Place of birth for the foreign-born population - Trinidad and Tobago (%)
Place of birth for the foreign-born population - West Indies (%)
Place of birth for the foreign-born population - Other Caribbean (%)
Place of birth for the foreign-born population - Belize (%)
Place of birth for the foreign-born population - Costa Rica (%)
Place of birth for the foreign-born population - El Salvador (%)
Place of birth for the foreign-born population - Guatemala (%)
Place of birth for the foreign-born population - Honduras (%)
Place of birth for the foreign-born population - Mexico (%)
Place of birth for the foreign-born population - Nicaragua (%)
Place of birth for the foreign-born population - Panama (%)
Place of birth for the foreign-born population - Other Central America (%)
Place of birth for the foreign-born population - Argentina (%)
Place of birth for the foreign-born population - Bolivia (%)
Place of birth for the foreign-born population - Brazil (%)
Place of birth for the foreign-born population - Chile (%)
Place of birth for the foreign-born population - Colombia (%)
Place of birth for the foreign-born population - Ecuador (%)
Place of birth for the foreign-born population - Guyana (%)
Place of birth for the foreign-born population - Peru (%)
Place of birth for the foreign-born population - Uruguay (%)
Place of birth for the foreign-born population - Venezuela (%)
Place of birth for the foreign-born population - Other South America (%)
Place of birth for the foreign-born population - Canada (%)
Place of birth for the foreign-born population - Other Northern America (%)
Place of birth for the foreign-born population - Other (%)
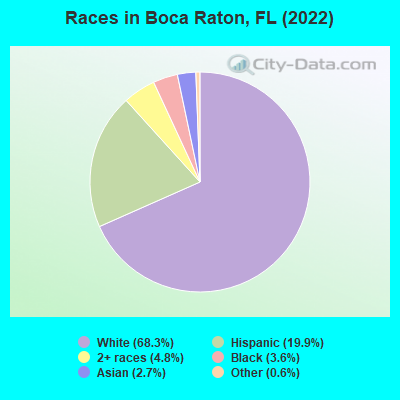
According to 2022 data, the most numerous races in Boca Raton, FL are White alone (67,655 residents), Hispanic (19,709 residents), and Black alone (3,603 residents). 70.9% of Boca Raton residents speak English at home. 19.6% of Boca Raton, FL residents are foreign-born (8.9% born in Latin America, 4.7% born in Europe, 3.8% born in Asia), which is 7.3% less than the foreign-born rate of 21.0% across the entire state of Florida.
Race distribution in Boca Raton
2000 2022
10,458,509 65.4% White alone 2,682,715 16.8% Hispanic 2,264,268 14.2% Black alone 261,693 1.6% Asian alone 236,954 1.5% Two or more races 42,358 0.3% American Indian alone 28,994 0.2% Other race alone 6,887 0.04% Native Hawaiian and Other
11,309,403 50.8% White alone 6,025,039 27.1% Hispanic 3,241,015 14.6% Black alone 861,630 3.9% Two or more races 623,692 2.8% Asian alone 152,054 0.7% Other race alone 22,504 0.1% American Indian alone 9,486 0.04% Native Hawaiian and Other
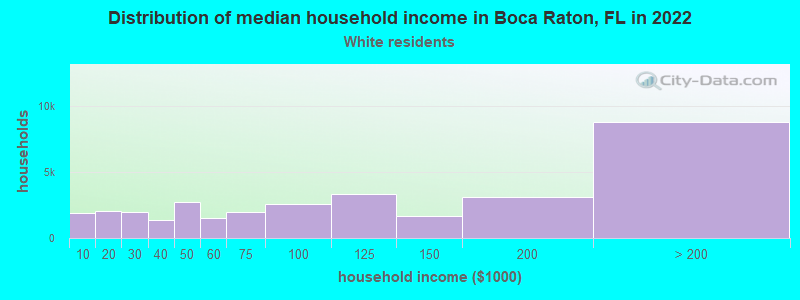
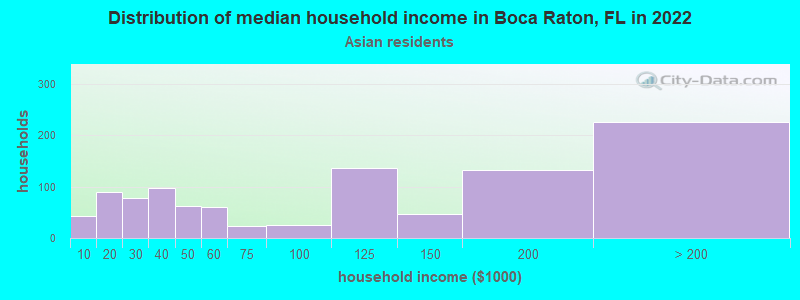
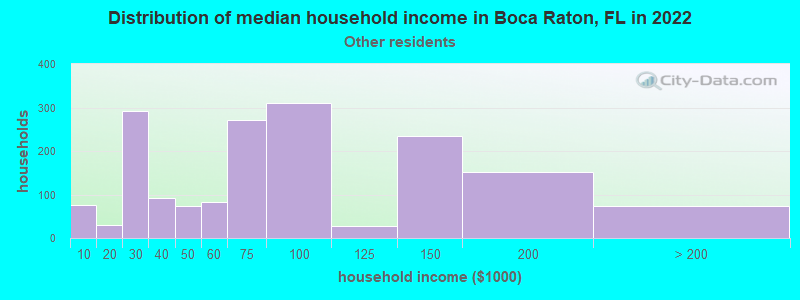
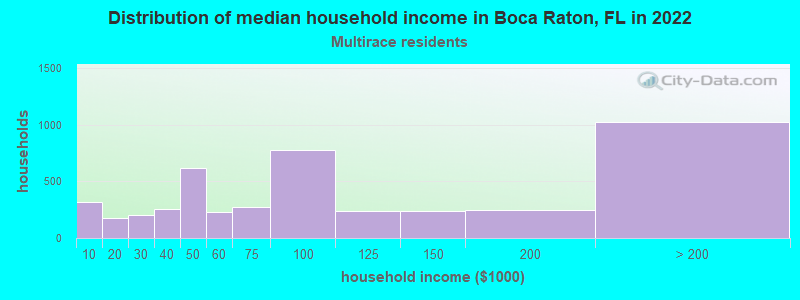
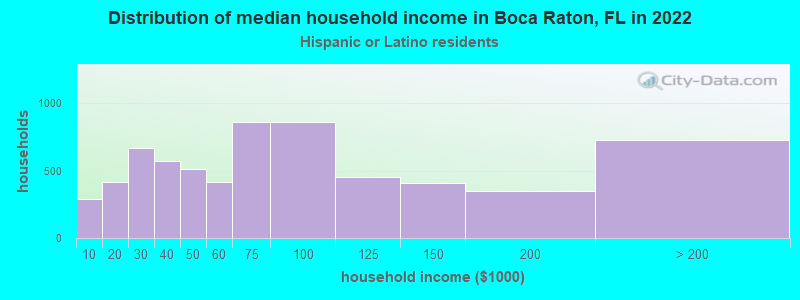
Income and house value in Boca Raton Median household income in 2022 $106,183 White non-Hispanic householders$79,025 Black householders$108,813 Asian householders$73,622 Some other race householders$80,000 Two or more races householders$64,018 Hispanic or Latino race householdersMedian 2022 house value $942,270 White Non-Hispanic householders$574,389 Black or African American householders$386,654 American Indian or Alaska Native householders $666,260 Asian householders$443,374 Some other race householders$571,593 Two or more races householders$718,985 Hispanic or Latino householders
Median age by race in Boca Raton
49.6 Median age for White residents48.8 50.3 22.8 Median age for Black or African American residents27.6 21.0 47.4 Median age for American Indian / Alaska Native residents52.2 48.0 48.8 Median age for Asian residents48.7 50.1 -666,666,666.0 Median age for Native Hawaiian / Pacific Islander residents-666,666,666.0 -666,666,666.0 33.1 Median age for Other race residents26.8 36.7 37.3 Median age for Two or more races residents29.0 40.2 49.9 Median age for White alone residents49.8 50.2 37.0 Median age for Hispanic or Latino residents29.0 45.1
Owner/renter occupied households by race in Boca Raton
House owners and renters - White residents 22,376 67.7% Owner occupied10,669 32.3% Renter occupiedHouse owners and renters - Black or African American residents 551 73.3% Owner occupied201 26.7% Renter occupiedHouse owners and renters - American Indian / Alaska Native residents 5 100.0% Owner occupiedHouse owners and renters - Asian residents 504 57.8% Owner occupied368 42.2% Renter occupiedHouse owners and renters - Other race residents 93 5.5% Owner occupied1,600 94.5% Renter occupiedHouse owners and renters - Two or more races residents 2,092 48.6% Owner occupied2,214 51.4% Renter occupiedHouse owners and renters - White alone residents 21,132 67.8% Owner occupied10,041 32.2% Renter occupiedHouse owners and renters - Hispanic or Latino residents 2,871 44.0% Owner occupied3,647 56.0% Renter occupied
Language usage in Boca Raton
English speakers - Total 70.9% of residents of Boca Raton speak English at home.
16.1% of residents speak Spanish at home 10,121 66.3% Speak English very well5,144 33.7% Speak English less than very well13.0% of residents speak other language at home 8,803 71.7% Speak English very well3,480 28.3% Speak English less than very well
English speakers - Born in the United States 89.3% of residents of Boca Raton speak English at home.
7.0% of residents speak Spanish at home 2,817 88.5% Speak English very well365 11.5% Speak English less than very well3.8% of residents speak other language at home 1,673 97.5% Speak English very well43 2.5% Speak English less than very well
English speakers - Native, born elsewhere 43.3% of residents of Boca Raton speak English at home.
40.5% of residents speak Spanish at home 908 83.8% Speak English very well175 16.2% Speak English less than very well16.2% of residents speak other language at home 435 100.0% Speak English very well
English speakers - Foreign-born 19.9% of residents of Boca Raton speak English at home.
39.5% of residents speak Spanish at home 4,730 54.1% Speak English very well4,017 45.9% Speak English less than very well40.6% of residents speak other language at home 5,665 63.1% Speak English very well3,314 36.9% Speak English less than very well
White (Caucasian) - Speak only English Native:
92.3% (53,732)Foreign-born:
25.7% (2,611)
White (Caucasian) - Speak another language Native:
7.7% (4,467)Foreign-born:
74.3% (7,532)
Black or African American - Speak only English Native:
89.8% (4,181)Foreign-born:
18.6% (220)
Black or African American - Speak another language Native:
9.8% (457)Foreign-born:
82.6% (976)
American Indian / Alaska Native - Speak only English Native:
20.0% (9)Foreign-born:
48.2% (45)
American Indian / Alaska Native - Speak another language Native:
86.2% (38)Foreign-born:
70.0% (65)
Asian - Speak only English Native:
80.2% (570)Foreign-born:
34.3% (675)
Asian - Speak another language Native:
19.8% (141)Foreign-born:
65.7% (1,293)
Other race - Speak only English Native:
27.2% (663)Foreign-born:
11.0% (355)
Other race - Speak another language Native:
72.8% (1,777)Foreign-born:
89.0% (2,868)
Two or more races - Speak only English Native:
66.6% (5,380)Foreign-born:
7.0% (422)
Two or more races - Speak another language Native:
33.4% (2,704)Foreign-born:
93.0% (5,649)
White alone - Speak only English Native:
93.5% (52,787)Foreign-born:
30.2% (2,577)
White alone - Speak another language Native:
6.5% (3,665)Foreign-born:
69.8% (5,960)
Hispanic or Latino - Speak only English Native:
42.3% (3,881)Foreign-born:
5.9% (550)
Hispanic or Latino - Speak another language Native:
57.7% (5,292)Foreign-born:
94.1% (8,815)
Foreign-born residents in Boca Raton 19,480 residents are foreign born (8.9% Latin America , 4.7% Europe , 3.8% Asia ).
This city:
19.6%Florida:
21.1%
Marital status for residents in Boca Raton Marital status - White (Caucasian) population 15 years and over
Males 33.5% Never married52.4% Now married0.5% Separated2.6% Widowed10.9% DivorcedFemales 28.3% Never married42.9% Now married1.9% Separated13.3% Widowed13.6% DivorcedWomen who gave birth in the past 12 months Now married:
100.0% (783)Unmarried:
0.0% (0)
Women who did not give birth in the past 12 months Now married:
29.4% (4,212)Unmarried:
70.6% (10,124)
Marital status - Black or African American population 15 years and over
Males 42.1% Never married45.4% Now married0.7% Separated1.5% Widowed10.3% DivorcedFemales 58.5% Never married30.7% Now married0.9% Separated1.3% Widowed8.6% DivorcedWomen who gave birth in the past 12 months Now married:
0.0% (0)Unmarried:
100.0% (11)
Women who did not give birth in the past 12 months Now married:
31.8% (656)Unmarried:
68.2% (1,406)
Marital status - American Indian / Alaska Native population 15 years and over
Males 59.1% Never married12.9% Now married0.0% Separated7.5% Widowed20.4% DivorcedFemales 0.0% Never married100.0% Now married0.0% Separated0.0% Widowed0.0% DivorcedWomen who gave birth in the past 12 months Now married:
100.0% (11)Unmarried:
0.0% (0)
Women who did not give birth in the past 12 months Now married:
100.0% (25)Unmarried:
0.0% (0)
Marital status - Asian population 15 years and over
Males 20.4% Never married69.9% Now married0.0% Separated1.9% Widowed7.8% DivorcedFemales 18.2% Never married56.9% Now married0.0% Separated17.8% Widowed7.1% DivorcedWomen who gave birth in the past 12 months Now married:
100.0% (11)Unmarried:
0.0% (0)
Women who did not give birth in the past 12 months Now married:
56.1% (408)Unmarried:
43.9% (319)
Marital status - Other race population 15 years and over
Males 36.6% Never married53.9% Now married1.6% Separated0.0% Widowed7.9% DivorcedFemales 42.4% Never married38.1% Now married2.4% Separated3.4% Widowed13.8% DivorcedWomen who gave birth in the past 12 months Now married:
100.0% (50)Unmarried:
0.0% (0)
Women who did not give birth in the past 12 months Now married:
34.5% (624)Unmarried:
65.5% (1,188)
Marital status - Two or more races population 15 years and over
Males 43.5% Never married45.4% Now married0.0% Separated0.0% Widowed11.1% DivorcedFemales 32.5% Never married41.3% Now married0.0% Separated5.6% Widowed20.7% DivorcedWomen who gave birth in the past 12 months Now married:
29.5% (69)Unmarried:
70.5% (165)
Women who did not give birth in the past 12 months Now married:
32.0% (1,044)Unmarried:
68.0% (2,222)
Marital status - White alone, not Hispanic / Latino population 15 years and over
Males 31.7% Never married53.6% Now married0.6% Separated2.8% Widowed11.3% DivorcedFemales 28.5% Never married44.6% Now married2.0% Separated12.4% Widowed12.4% DivorcedWomen who gave birth in the past 12 months Now married:
100.0% (746)Unmarried:
0.0% (0)
Women who did not give birth in the past 12 months Now married:
30.7% (4,148)Unmarried:
69.3% (9,385)
Marital status - Hispanic or Latino population 15 years and over
Males 46.6% Never married43.0% Now married0.0% Separated1.1% Widowed9.3% DivorcedFemales 31.0% Never married34.1% Now married0.0% Separated10.3% Widowed24.7% DivorcedWomen who gave birth in the past 12 months Now married:
45.0% (135)Unmarried:
55.0% (165)
Women who did not give birth in the past 12 months Now married:
24.8% (1,140)Unmarried:
75.2% (3,462)
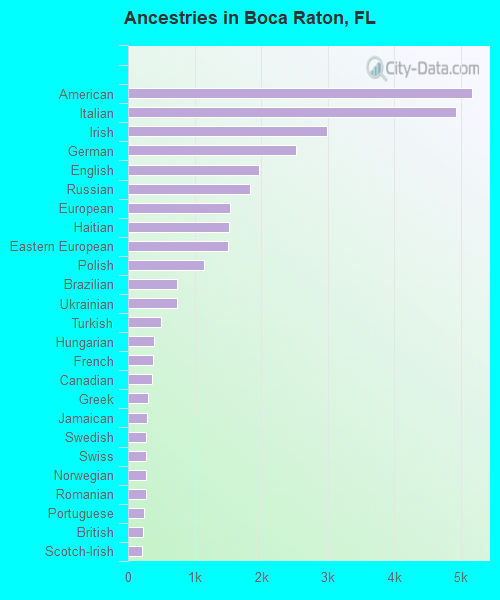
Ancestries in Boca Raton
5,163 10.5% American4,919 10.0% Italian2,985 6.1% Irish2,527 5.1% German1,973 4.0% English1,829 3.7% Russian1,534 3.1% European1,519 3.1% Haitian1,503 3.1% Eastern European1,147 2.3% Polish740 1.5% Brazilian737 1.5% Ukrainian489 1.0% Turkish387 0.8% Hungarian381 0.8% French365 0.7% Canadian307 0.6% Greek292 0.6% Jamaican276 0.6% Swedish271 0.6% Swiss265 0.5% Norwegian263 0.5% Romanian242 0.5% Portuguese227 0.5% British213 0.4% Scotch-Irish202 0.4% Czech201 0.4% Dutch187 0.4% French Canadian169 0.3% Egyptian162 0.3% Scottish159 0.3% Iranian146 0.3% Austrian136 0.3% South African125 0.3% Syrian122 0.2% Armenian113 0.2% Lebanese110 0.2% Israeli106 0.2% Croatian102 0.2% Slovak99 0.2% Finnish96 0.2% Lithuanian94 0.2% African85 0.2% Moroccan69 0.1% Yugoslavian66 0.1% Arab62 0.1% Northern European58 0.1% Czechoslovakian57 0.1% Scandinavian54 0.1% Serbian49 0.10% Maltese44 0.09% Danish41 0.08% Bulgarian37 0.08% Iraqi35 0.07% Guyanese33 0.07% Ethiopian25 0.05% Trinidadian and Tobagonian24 0.05% Welsh20 0.04% Kenyan18 0.04% West Indian12 0.02% Palestinian12 0.02% Nigerian11 0.02% Latvian9 0.02% Slavic9 0.02% Bahamian8 0.02% Macedonian7 0.01% Albanian5 0.01% Belgian4 0.01% Slovene4 0.01% British West Indian
Geographical mobility in Boca Raton Same house 1 year ago 60,996 86.7% White (Caucasian)5,170 84.5% Black or African American149 80.2% American Indian / Alaska Native2,251 73.8% Asian37 100.0% Native Hawaiian / Pacific Islander4,911 88.1% Other race10,512 71.2% Two or more races58,059 86.8% White alone, not Hispanic / Latino15,720 80.4% Hispanic or LatinoMoved within same county 2,839 4.0% White / Caucasian223 3.6% Black or African American32 17.2% American Indian / Alaska Native208 6.8% Asian206 3.7% Other race2,039 13.8% Two or more races2,693 4.0% White alone, not Hispanic / Latino2,053 10.5% Hispanic or LatinoMoved within same state 2,729 3.9% White / Caucasian548 8.9% Black or African American66 2.1% Asian87 1.6% Other race735 5.0% Two or more races2,648 4.0% White alone, not Hispanic / Latino298 1.5% Hispanic or LatinoMoved from different state 3,153 4.5% White / Caucasian86 1.4% Black or African American561 18.4% Asian287 5.1% Other race1,473 10.0% Two or more races2,896 4.3% White alone, not Hispanic / Latino1,339 6.8% Hispanic or LatinoMoved from abroad 650 0.9% White68 1.1% Black or African American103 3.4% Asian62 1.1% Other race587 0.9% White alone, not Hispanic / Latino138 0.7% Hispanic or Latino
Children Nativity (place of birth) in Boca Raton
Children under 6 years - Living with two parents Both parents native 2,493 100.0% NativeBoth parents foreign-born 675 67.2% Native330 32.8% Foreign-bornOne native, one foreign-born parent 565 100.0% NativeChildren under 6 years - Living with one parent Native parent 114 100.0% NativeForeign-born parent 702 100.0% NativeChildren 6 to 17 years - Living with two parents Both parents native 3,964 100.0% NativeBoth parents foreign-born 1,266 48.6% Native1,340 51.4% Foreign-bornOne native, one foreign-born parent 1,681 100.0% NativeChildren 6 to 17 years - Living with one parent Native parent 389 100.0% NativeForeign-born parent 2,149 63.3% Native1,248 36.7% Foreign-born
Place of birth for residents in Boca Raton 10,277 Americas9,066 Latin America5,374 South America4,813 Europe3,818 Asia2,386 Caribbean2,057 Eastern Europe1,305 Central America1,292 Western Asia1,275 South Central Asia1,210 Northern America1,086 Northern Europe1,004 Western Europe703 Eastern Asia649 Southern Europe515 South Eastern Asia514 Africa397 China278 Southern Africa141 Northern Africa67 Eastern Africa57 Oceania57 Australia and New Zealand Subregion26 Western Africa1,684 Colombia1,680 Brazil1,210 Canada834 Cuba685 Venezuela678 Haiti615 Mexico588 United Kingdom574 Turkey552 Peru481 Russia470 India370 Dominican Republic357 Bangladesh348 Germany314 Serbia304 Italy299 Romania278 South Africa266 China265 Israel257 Costa Rica237 Kazakhstan232 Jamaica232 Ukraine231 France227 England223 Philippines209 Syria198 Guatemala197 Ecuador189 Czechoslovakia186 Chile177 Netherlands176 Greece165 Switzerland164 Guyana159 Spain156 Korea155 Iran149 Japan149 Vietnam116 Poland108 Trinidad and Tobago98 Argentina86 Hungary85 Lebanon83 Saudi Arabia74 Sweden73 Taiwan67 Honduras66 Austria65 Ireland62 El Salvador59 Belarus56 Hong Kong54 Cambodia53 Egypt50 Bolivia50 Uruguay49 Belize47 Iraq45 Ethiopia45 Morocco44 Bahamas39 Croatia37 Australia34 Pakistan32 Bosnia and Herzegovina32 Nicaragua32 Thailand31 Scotland28 Bulgaria27 Burma (Myanmar)26 Indonesia24 Armenia22 Panama21 Kenya20 Norway20 New Zealand19 Uzbekistan14 Latvia14 Belgium12 Barbados11 Moldova11 Nigeria10 North Macedonia (Macedonia)9 Portugal6 Algeria
Grandparents responsible for own grandchildren in Boca Raton
Grandparents (30 to 59 years) White / Caucasian 14 100.0% Responsible for grandchildrenBlack or African American 1 100.0% Responsible for grandchildrenOther race 38 100.0% Not responsible for grandchildrenTwo or more races 47 100.0% Not responsible for grandchildrenWhite alone, not Hispanic / Latino 16 100.0% Responsible for grandchildrenHispanic or Latino 50 100.0% Not responsible for grandchildrenGrandparents (60 years and over) White / Caucasian 29 12.9% Responsible for grandchildren193 87.1% Not responsible for grandchildrenBlack or African American 15 100.0% Not responsible for grandchildrenOther race 101 100.0% Not responsible for grandchildrenTwo or more races 10 50.8% Responsible for grandchildren10 49.2% Not responsible for grandchildrenWhite alone, not Hispanic / Latino 34 14.6% Responsible for grandchildren200 85.4% Not responsible for grandchildrenHispanic or Latino 9 9.0% Responsible for grandchildren92 91.0% Not responsible for grandchildren