Races in Bluetown-Iglesia Antigua, Texas (TX) Detailed Stats
Ancestries, Foreign-born residents, place of birth

Discuss Bluetown-Iglesia Antigua, Texas races on our local forum with over 2,400,000 registered users
30.1% of Bluetown-Iglesia Antigua, TX residents are foreign-born (30.1% born in Latin America), which is 43.4% greater than the foreign-born rate of 17.0% across the entire state of Texas.
Race distribution in Bluetown-Iglesia Antigua

- 64993.8%Hispanic
- 405.8%White alone
- 20.3%Other race alone
- 10.1%Asian alone
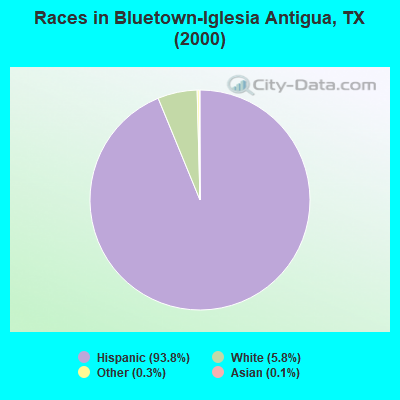
2000
2022
-
- 10,933,31352.4%White alone
- 6,669,66632.0%Hispanic
- 2,364,25511.3%Black alone
- 554,4452.7%Asian alone
- 230,5671.1%Two or more races
- 68,8590.3%American Indian alone
- 19,9580.10%Other race alone
- 10,7570.05%Native Hawaiian and Other
Pacific Islander alone

-
- 12,070,64240.2%Hispanic
- 11,683,43038.9%White alone
- 3,508,70611.7%Black alone
- 1,608,1735.4%Asian alone
- 956,5603.2%Two or more races
- 125,7630.4%Other race alone
- 47,0230.2%American Indian alone
- 29,2750.10%Native Hawaiian and Other
Pacific Islander alone

Income and house value in Bluetown-Iglesia Antigua
- Median household income in 2022
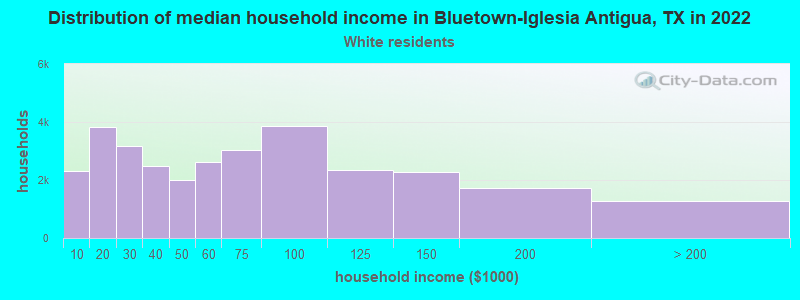
- $134,645White non-Hispanic householders
- $31,148Some other race householders
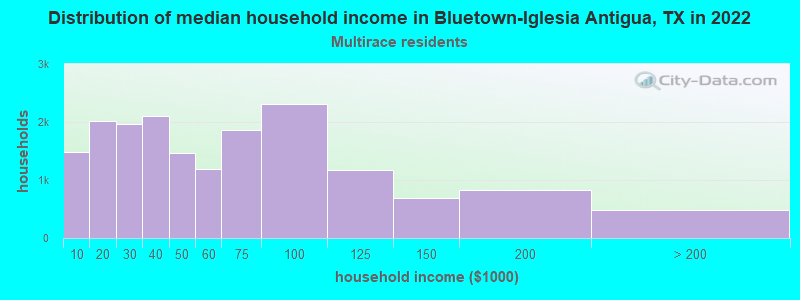
- $12,026Two or more races householders
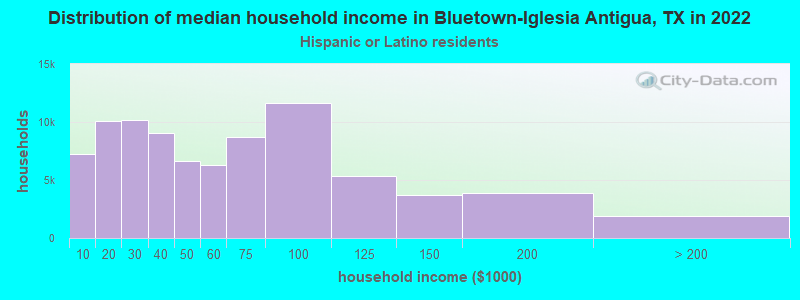
- $34,517Hispanic or Latino race householders
- Median 2022 house value
- $180,645White Non-Hispanic householders
- $113,945Some other race householders
- $125,062Two or more races householders
- $94,491Hispanic or Latino householders
Household income for White non-Hispanic householders
Household income for Two or more races householders
Household income for Hispanic or Latino race householders
Foreign-born residents in Bluetown-Iglesia Antigua
208 residents are foreign born (30.1% Latin America).
| This city: | 30.1% |
| Texas: | 13.9% |
Ancestries in Bluetown-Iglesia Antigua

- 54696.1%Other
- 101.8%German
- 81.4%United States
- 20.4%French
- 20.4%Subsaharan African

Zip codes: 78592.