Races in Belmont, Maine (ME) Detailed Stats
Ancestries, Foreign-born residents, place of birth
1.0% of Belmont, ME residents are foreign-born , which is 207.9% less than the foreign-born rate of 3.0% across the entire state of Maine.
Race distribution in Belmont

- 81098.7%White alone
- 70.9%Two or more races
- 40.5%American Indian alone

2000
2022
-
- 1,230,29796.5%White alone
- 11,7310.9%Two or more races
- 9,3600.7%Hispanic
- 9,0140.7%Asian alone
- 6,4400.5%Black alone
- 6,9110.5%American Indian alone
- 8360.07%Other race alone
- 3340.03%Native Hawaiian and Other
Pacific Islander alone

-
- 1,249,23390.2%White alone
- 58,3574.2%Two or more races
- 28,7172.1%Hispanic
- 21,5831.6%Black alone
- 16,1511.2%Asian alone
- 5,8730.4%Other race alone
- 5,2050.4%American Indian alone
- 2210.02%Native Hawaiian and Other
Pacific Islander alone

Income and house value in Belmont
- Median household income in 2022
- $53,665White non-Hispanic householders
- $87,118Two or more races householders
- Median 2022 house value
- $242,115White Non-Hispanic householders
Household income for White non-Hispanic householders

Household income for Two or more races householders

Foreign-born residents in Belmont
8 residents are foreign born
| This city: | 1.0% |
| Maine: | 2.9% |
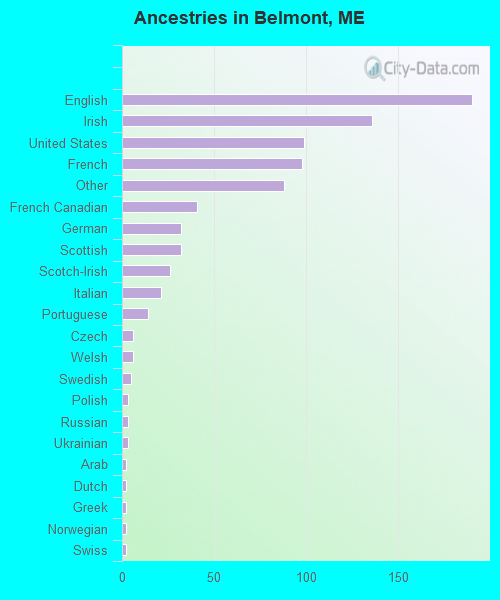
Ancestries in Belmont

- 19023.4%English
- 13616.7%Irish
- 9912.2%United States
- 9812.1%French
- 8810.8%Other
- 415.0%French Canadian
- 323.9%German
- 323.9%Scottish
- 263.2%Scotch-Irish
- 212.6%Italian
- 141.7%Portuguese
- 60.7%Czech
- 60.7%Welsh
- 50.6%Swedish
- 30.4%Polish
- 30.4%Russian
- 30.4%Ukrainian
- 20.2%Arab
- 20.2%Dutch
- 20.2%Greek
- 20.2%Norwegian
- 20.2%Swiss
Zip codes: 04952.