Races in Bay City, Michigan (MI) Detailed Stats
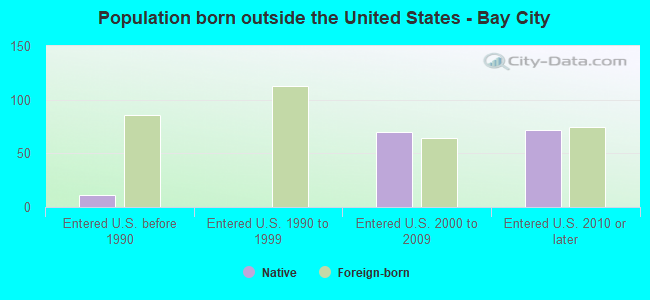
Ancestries, Foreign-born residents, place of birth
Settings
X


Recent posts about races in Bay City, Michigan on our local forum with over 2,400,000 registered users:
 | Considering coming home to Bay City...... (2 replies) |
| Bay City MI (16 replies) |
| Magical Small Towns in Michigan (27 replies) |
| For non-Michigan people: your stereotypes of Michigan people before meeting them (71 replies) |
| Bay City info? (17 replies) |
| Article: Michigan's Brain Drain is back, as best and brightest leave state (36 replies) |
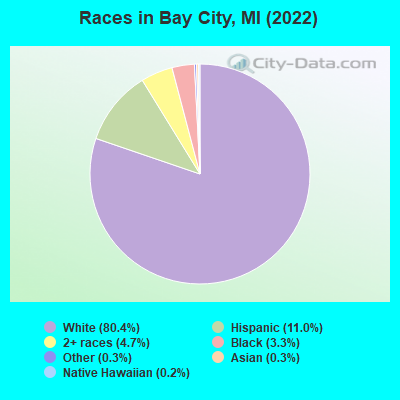
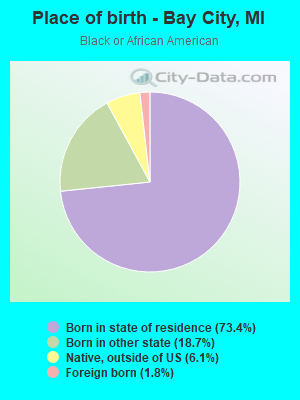
According to 2022 data, the most numerous races in Bay City, MI are White alone (26,016 residents), Black alone (1,075 residents), and Hispanic (3,558 residents). 96.8% of Bay City residents speak English at home. 1.1% of Bay City, MI residents are foreign-born , which is 453.4% less than the foreign-born rate of 6.0% across the entire state of Michigan.
Race distribution in Bay City
2000
2022

- 32,33387.8%White alone
- 2,4736.7%Hispanic
- 9722.6%Black alone
- 5911.6%Two or more races
- 2270.6%American Indian alone
- 1940.5%Asian alone
- 240.07%Other race alone
- 30.01%Native Hawaiian and Other
Pacific Islander alone
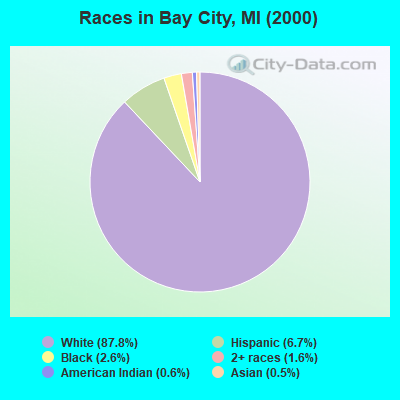
-
- 26,01680.4%White alone
- 3,55811.0%Hispanic
- 1,5074.7%Two or more races
- 1,0753.3%Black alone
- 970.3%Asian alone
- 1050.3%Other race alone
- 610.2%Native Hawaiian and Other
Pacific Islander alone - 210.06%American Indian alone
2000
2022
-
- 7,806,69178.6%White alone
- 1,402,04714.1%Black alone
- 323,8773.3%Hispanic
- 175,3111.8%Asian alone
- 163,4871.6%Two or more races
- 53,4210.5%American Indian alone
- 11,4650.1%Other race alone
- 2,1450.02%Native Hawaiian and Other
Pacific Islander alone

-
- 7,289,05172.6%White alone
- 1,310,46413.1%Black alone
- 572,4055.7%Hispanic
- 450,0314.5%Two or more races
- 335,7323.3%Asian alone
- 45,2170.5%Other race alone
- 29,0110.3%American Indian alone
- 2,2070.02%Native Hawaiian and Other
Pacific Islander alone

Income and house value in Bay City
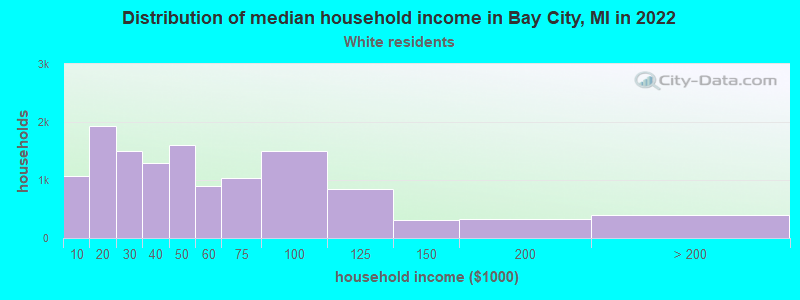
- Median household income in 2022
- $42,263White non-Hispanic householders
- $80,806American Indian and Alaska Native householders
- $36,755Some other race householders
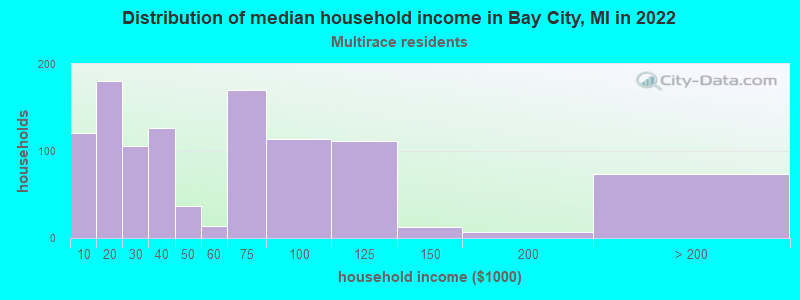
- $64,121Two or more races householders
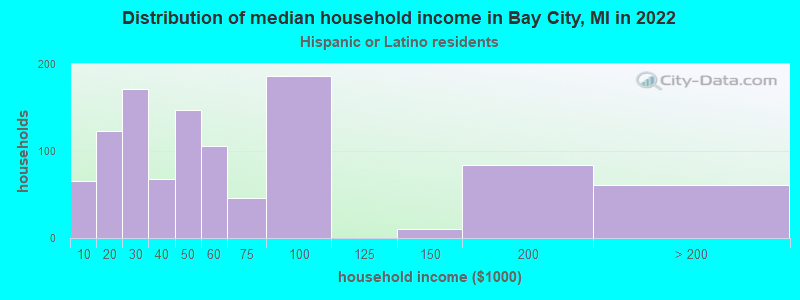
- $50,132Hispanic or Latino race householders
- Median 2022 house value
- $93,400White Non-Hispanic householders
- $76,843Black or African American householders
- $103,731American Indian or Alaska Native householders
- $103,165Asian householders
- $74,720Some other race householders
- $65,521Two or more races householders
- $81,796Hispanic or Latino householders
Household income for White non-Hispanic householders
Household income for Black householders
Household income for American Indian and Alaska Native householders
Household income for Asian householders
Household income for Some other race householders
Household income for Two or more races householders
Household income for Hispanic or Latino race householders
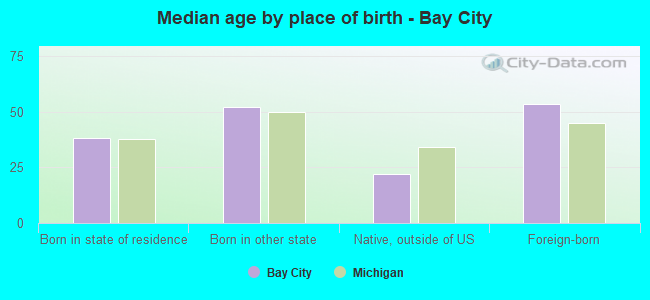
Median age by race in Bay City
- 40.4Median age for White residents
- 39.8Males
- 41.2Females
- 56.9Median age for Black or African American residents
- 51.6Males
- 54.1Females
- 42.1Median age for American Indian / Alaska Native residents
- 42.9Males
- 41.9Females
- 43.9Median age for Asian residents
- -690,476,189.8Males
- 44.0Females
- -666,666,666.0Median age for Native Hawaiian / Pacific Islander residents
- -666,666,666.0Males
- -666,666,666.0Females
- 33.3Median age for Other race residents
- 37.1Males
- 28.9Females
- 26.6Median age for Two or more races residents
- 28.1Males
- 25.9Females
- 41.5Median age for White alone residents
- 41.1Males
- 41.8Females
- 25.1Median age for Hispanic or Latino residents
- 25.9Males
- 25.3Females
Owner/renter occupied households by race in Bay City
- House owners and renters - White residents
- 8,60568.8%Owner occupied
- 3,89831.2%Renter occupied
- House owners and renters - Black or African American residents
- 17853.9%Owner occupied
- 15246.1%Renter occupied
- House owners and renters - American Indian / Alaska Native residents
- 720.0%Owner occupied
- 2980.0%Renter occupied
- House owners and renters - Asian residents
- 59100.0%Renter occupied
- House owners and renters - Other race residents
- 11361.1%Owner occupied
- 7238.9%Renter occupied
- House owners and renters - Two or more races residents
- 55553.0%Owner occupied
- 49147.0%Renter occupied
- House owners and renters - White alone residents
- 8,31568.8%Owner occupied
- 3,77831.2%Renter occupied
- House owners and renters - Hispanic or Latino residents
- 76260.3%Owner occupied
- 50139.7%Renter occupied
Language usage in Bay City
- English speakers - Total
- 96.8% of residents of Bay City speak English at home.
- 1.8% of residents speak Spanish at home
- 47083.5%Speak English very well
- 9316.5%Speak English less than very well
- 1.2% of residents speak other language at home
- 21760.4%Speak English very well
- 14239.6%Speak English less than very well
- English speakers - Born in the United States
- 90.8% of residents of Bay City speak English at home.
- 6.5% of residents speak Spanish at home
- 17972.2%Speak English very well
- 6927.8%Speak English less than very well
- 3.0% of residents speak other language at home
- 10794.7%Speak English very well
- 65.3%Speak English less than very well
- English speakers - Native, born elsewhere
- 97.5% of residents of Bay City speak English at home.
- 6.3% of residents speak Spanish at home
- 10100.0%Speak English very well
- English speakers - Foreign-born
- 39.9% of residents of Bay City speak English at home.
- 21.9% of residents speak Spanish at home
- 77100.0%Speak English very well
- 36.5% of residents speak other language at home
- 8969.5%Speak English very well
- 3930.5%Speak English less than very well
White (Caucasian) - Speak only English
| Native: | 98.7% (25,946) |
| Foreign-born: | 70.7% (121) |
White (Caucasian) - Speak another language
| Native: | 1.4% (366) |
| Foreign-born: | 29.4% (50) |
Black or African American - Speak only English
| Native: | 95.9% (911) |
| Foreign-born: | 93.1% (16) |
Two or more races - Speak another language
| Native: | 9.5% (298) |
| Foreign-born: | 100.0% (102) |
White alone - Speak only English
| Native: | 98.8% (24,634) |
| Foreign-born: | 66.3% (122) |
White alone - Speak another language
| Native: | 1.2% (299) |
| Foreign-born: | 30.1% (55) |
Hispanic or Latino - Speak another language
| Native: | 12.9% (427) |
| Foreign-born: | 100.0% (74) |
Foreign-born residents in Bay City
351 residents are foreign born
| This city: | 1.1% |
| Michigan: | 6.9% |
Marital status for residents in Bay City
Marital status - White (Caucasian) population 15 years and over
- Males
- 39.6%Never married
- 39.6%Now married
- 0.6%Separated
- 3.0%Widowed
- 17.3%Divorced
- Females
- 34.3%Never married
- 35.5%Now married
- 2.0%Separated
- 10.4%Widowed
- 17.8%Divorced
Women who gave birth in the past 12 months
| Now married: | 35.2% (118) |
| Unmarried: | 64.8% (217) |
Women who did not give birth in the past 12 months
| Now married: | 34.0% (2,096) |
| Unmarried: | 66.0% (4,074) |
Marital status - Black or African American population 15 years and over
- Males
- 69.7%Never married
- 17.3%Now married
- 5.0%Separated
- 0.0%Widowed
- 8.0%Divorced
- Females
- 62.1%Never married
- 22.1%Now married
- 0.0%Separated
- 4.9%Widowed
- 10.9%Divorced
Women who did not give birth in the past 12 months
| Now married: | 12.9% (30) |
| Unmarried: | 87.1% (206) |
Marital status - American Indian / Alaska Native population 15 years and over
- Males
- 50.0%Never married
- 50.0%Now married
- 0.0%Separated
- 0.0%Widowed
- 0.0%Divorced
- Females
- 2.3%Never married
- 9.1%Now married
- 0.0%Separated
- 27.3%Widowed
- 61.4%Divorced
Women who gave birth in the past 12 months
| Now married: | 0.0% (0) |
| Unmarried: | 100.0% (1) |
Women who did not give birth in the past 12 months
| Now married: | 0.0% (0) |
| Unmarried: | 100.0% (25) |
Marital status - Asian population 15 years and over
- Males
- 0.0%Never married
- 100.0%Now married
- 0.0%Separated
- 0.0%Widowed
- 0.0%Divorced
- Females
- 31.2%Never married
- 53.8%Now married
- 0.0%Separated
- 0.0%Widowed
- 15.1%Divorced
Women who did not give birth in the past 12 months
| Now married: | 36.8% (26) |
| Unmarried: | 63.2% (44) |
Marital status - Other race population 15 years and over
- Males
- 9.7%Never married
- 54.9%Now married
- 0.0%Separated
- 0.0%Widowed
- 35.4%Divorced
- Females
- 46.9%Never married
- 53.1%Now married
- 0.0%Separated
- 0.0%Widowed
- 0.0%Divorced
Women who did not give birth in the past 12 months
| Now married: | 33.3% (27) |
| Unmarried: | 66.7% (55) |
Marital status - Two or more races population 15 years and over
- Males
- 45.5%Never married
- 41.8%Now married
- 11.4%Separated
- 0.0%Widowed
- 1.4%Divorced
- Females
- 49.3%Never married
- 24.3%Now married
- 1.2%Separated
- 12.0%Widowed
- 13.1%Divorced
Women who did not give birth in the past 12 months
| Now married: | 28.4% (305) |
| Unmarried: | 71.6% (770) |
Marital status - White alone, not Hispanic / Latino population 15 years and over
- Males
- 39.3%Never married
- 39.9%Now married
- 0.6%Separated
- 3.0%Widowed
- 17.2%Divorced
- Females
- 33.5%Never married
- 35.5%Now married
- 2.0%Separated
- 10.9%Widowed
- 18.0%Divorced
Women who gave birth in the past 12 months
| Now married: | 26.1% (77) |
| Unmarried: | 73.9% (217) |
Women who did not give birth in the past 12 months
| Now married: | 34.6% (2,014) |
| Unmarried: | 65.4% (3,799) |
Marital status - Hispanic or Latino population 15 years and over
- Males
- 40.0%Never married
- 38.4%Now married
- 7.9%Separated
- 0.9%Widowed
- 12.7%Divorced
- Females
- 47.1%Never married
- 32.4%Now married
- 0.7%Separated
- 10.7%Widowed
- 9.1%Divorced
Women who gave birth in the past 12 months
| Now married: | 97.7% (45) |
| Unmarried: | 2.3% (1) |
Women who did not give birth in the past 12 months
| Now married: | 31.3% (278) |
| Unmarried: | 68.7% (612) |
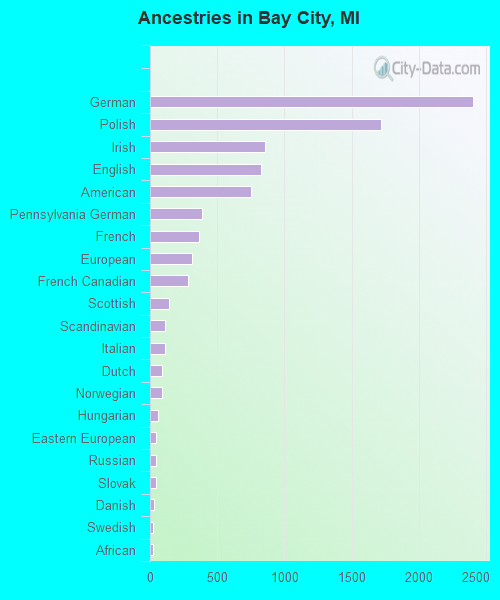
Ancestries in Bay City

- 2,40319.0%German
- 1,71813.6%Polish
- 8536.7%Irish
- 8246.5%English
- 7515.9%American
- 3903.1%Pennsylvania German
- 3622.9%French
- 3152.5%European
- 2842.2%French Canadian
- 1411.1%Scottish
- 1150.9%Scandinavian
- 1090.9%Italian
- 930.7%Dutch
- 900.7%Norwegian
- 610.5%Hungarian
- 480.4%Eastern European
- 460.4%Russian
- 450.4%Slovak
- 280.2%Danish
- 260.2%Swedish
- 240.2%African
- 130.1%Canadian
- 130.1%Nigerian
- 110.09%Portuguese
- 100.08%Swiss
- 100.08%Welsh
- 90.07%Scotch-Irish
- 90.07%Ukrainian
- 90.07%Haitian
- 70.06%Croatian
- 70.06%Lebanese
- 60.05%Finnish
- 60.05%Czechoslovakian
- 60.05%Northern European
- 50.04%Luxembourger
- 40.03%Romanian
- 40.03%Jordanian
- 20.02%Belgian
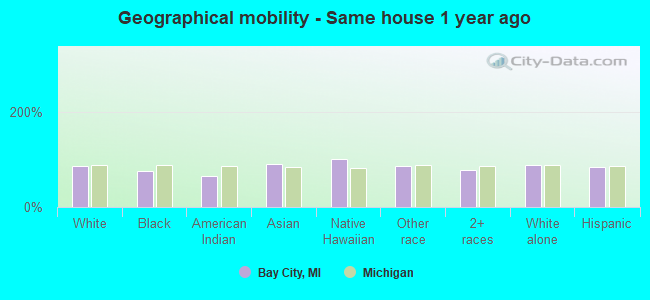
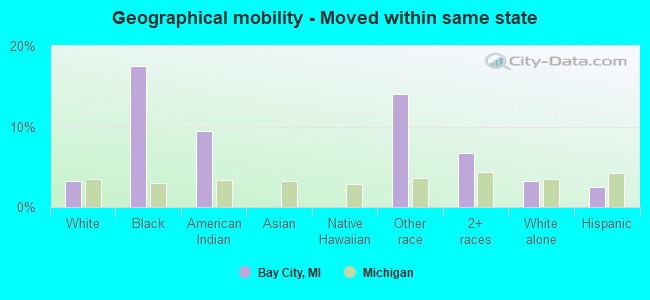
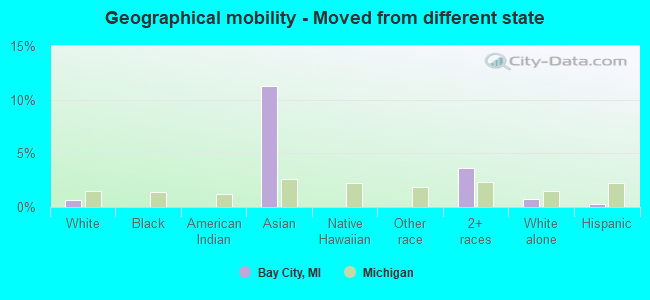
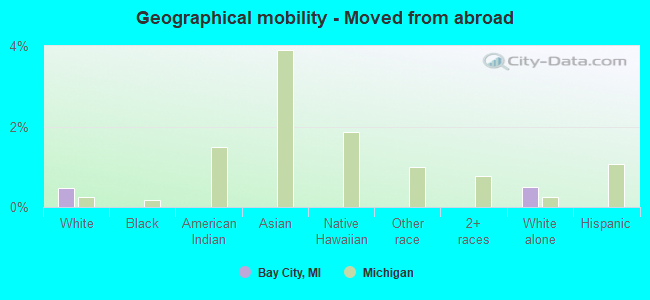
Geographical mobility in Bay City

- Same house 1 year ago
- 23,38486.5%White (Caucasian)
- 83775.1%Black or African American
- 4465.2%American Indian / Alaska Native
- 10189.7%Asian
- 59100.0%Native Hawaiian / Pacific Islander
- 30086.1%Other race
- 2,70678.5%Two or more races
- 22,56687.5%White alone, not Hispanic / Latino
- 2,96184.0%Hispanic or Latino
-
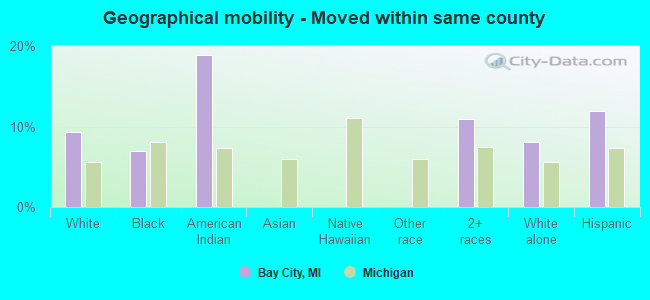
- Moved within same county
- 2,5369.4%White / Caucasian
- 787.0%Black or African American
- 1318.8%American Indian / Alaska Native
- 37811.0%Two or more races
- 2,0748.0%White alone, not Hispanic / Latino
- 42011.9%Hispanic or Latino
-
- Moved within same state
- 8823.3%White / Caucasian
- 19517.5%Black or African American
- 69.5%American Indian / Alaska Native
- 4914.0%Other race
- 2326.7%Two or more races
- 8413.3%White alone, not Hispanic / Latino
- 892.5%Hispanic or Latino
-
- Moved from different state
- 1880.7%White / Caucasian
- 1311.3%Asian
- 1253.6%Two or more races
- 1880.7%White alone, not Hispanic / Latino
- 90.3%Hispanic or Latino
-
- Moved from abroad
- 1250.5%White
- 1250.5%White alone, not Hispanic / Latino
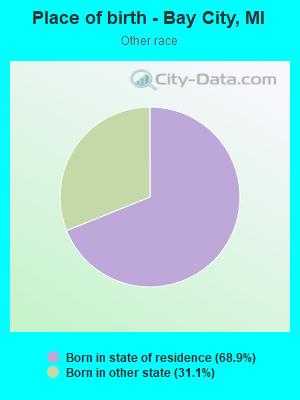
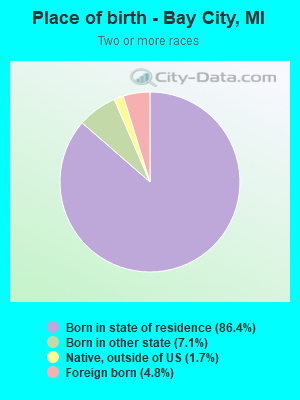
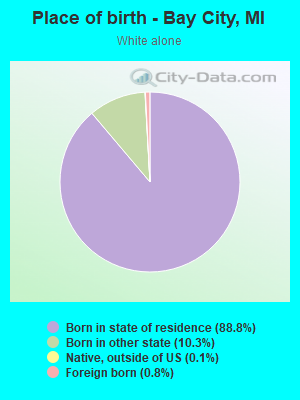
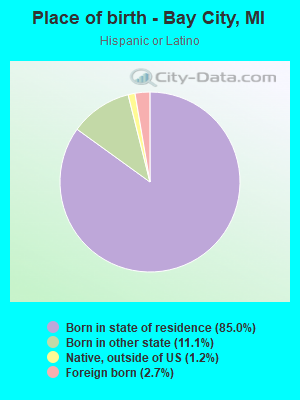
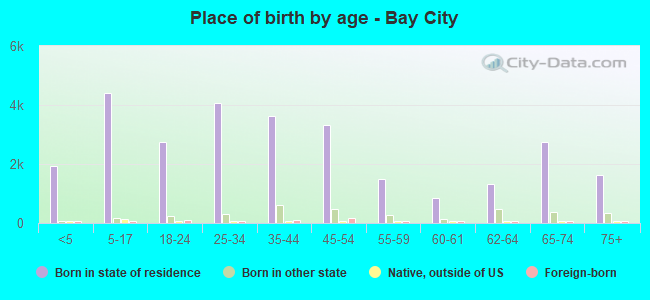
Children Nativity (place of birth) in Bay City
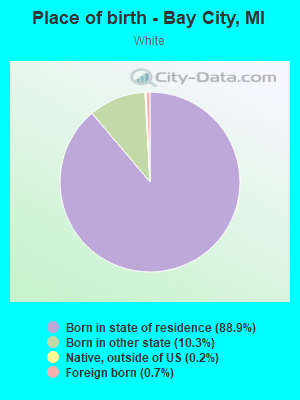
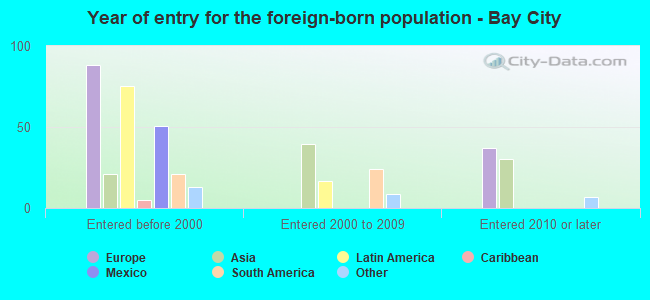
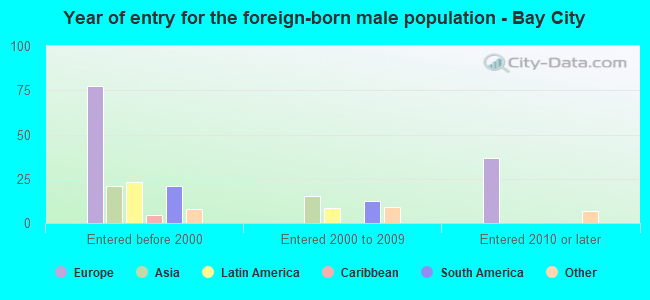
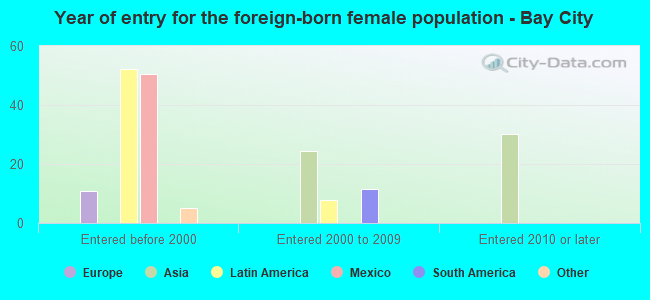
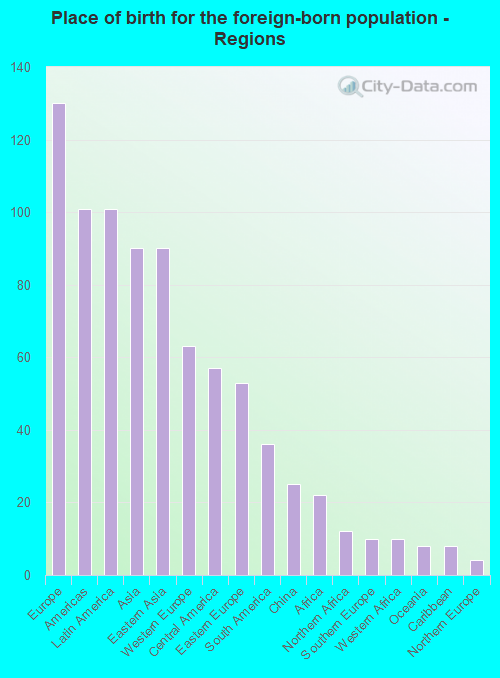
Place of birth for residents in Bay City
![Place of birth for the foreign-born population - Regions]()
- 130Europe
- 101Americas
- 101Latin America
- 90Asia
- 90Eastern Asia
- 63Western Europe
- 57Central America
- 53Eastern Europe
- 36South America
- 25China
- 22Africa
- 12Northern Africa
- 10Southern Europe
- 10Western Africa
- 8Oceania
- 8Caribbean
- 4Northern Europe
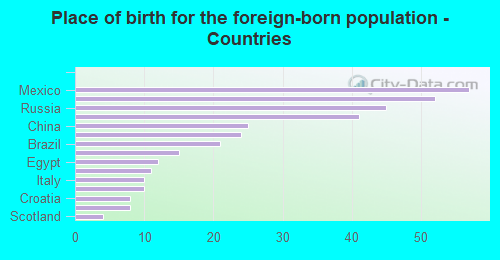
![Place of birth for the foreign-born population - Countries]()
- 57Mexico
- 52Germany
- 45Russia
- 41Korea
- 25China
- 24Japan
- 21Brazil
- 15Colombia
- 12Egypt
- 11Netherlands
- 10Italy
- 10Nigeria
- 8Croatia
- 8Haiti
- 4Scotland