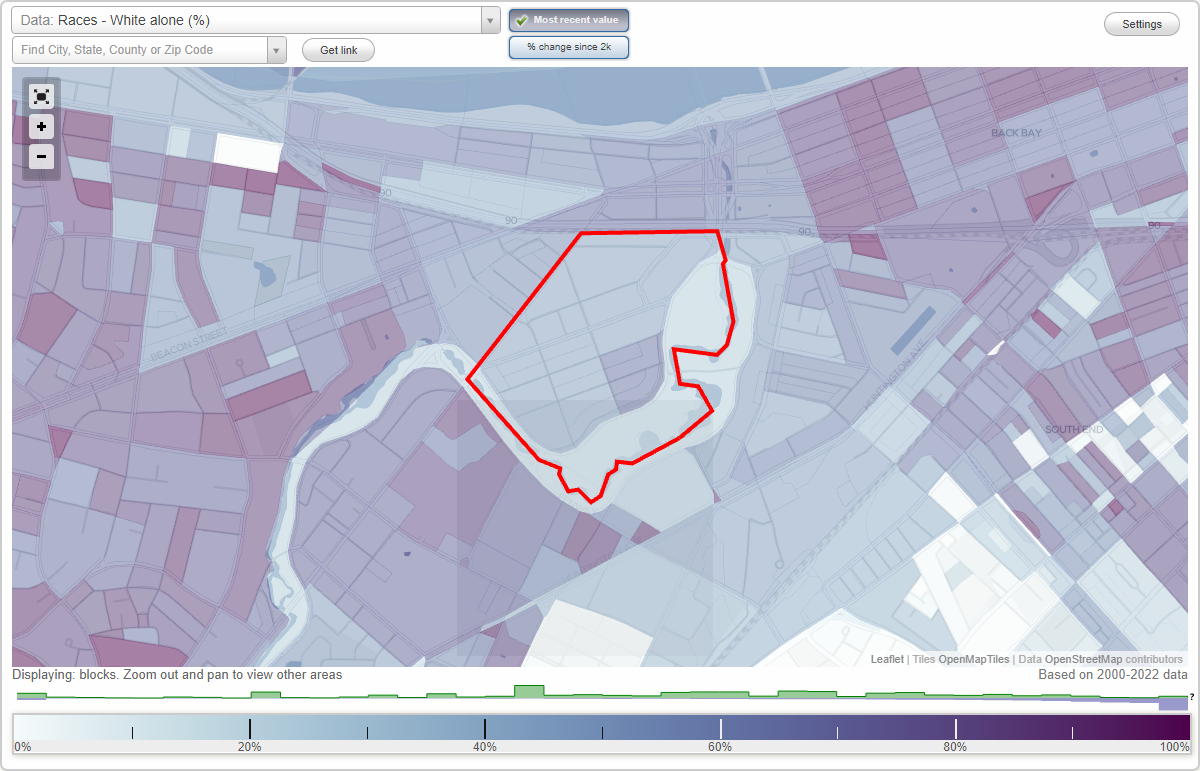
West Fens neighborhood in Boston, Massachusetts (MA), 02115, 02215 detailed profile
Settings
X

Business Search - 14 Million verified businesses
Area: 0.216 square miles
Population: 2,804
Population density:
| West Fens: | 12,978 people per square mile |
| Boston: | 13,418 people per square mile |

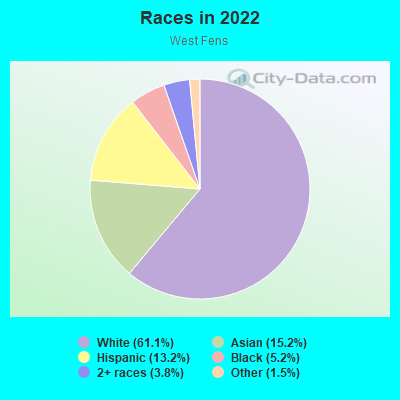
- 1,72861.1%White
- 43115.2%Asian
- 37313.2%Hispanic or Latino
- 1485.2%Black
- 1073.8%Two or more races
- 421.5%Some other race
Distribution of median household income
![Distribution of median household income]()
- 14Less than $10,000
- 41$10,000 to $19,999
- 29$20,000 to $29,999
- 3$30,000 to $39,999
- 17$40,000 to $49,999
- 8$50,000 to $59,999
- 17$60,000 to $74,999
- 9$75,000 to $99,999
- 34$100,000 to $124,999
- 16$125,000 to $149,999
- 34$150,000 to $199,999
- 7$200,000 or more

Distribution of owner-occupied house/condo value
![Distribution of owner-occupied house/condo value]()
- 12$300,000 to $399,999
- 4$500,000 to $749,999
- 8$1,000,000 or more

Distribution of rent paid by renters
![Distribution of rent paid by renters]()
- 80$200 to $299
- 8$300 to $399
- 2$500 to $599
- 17$1,000 to $1,249
- 9$1,500 to $1,999
- 78$2,000 or more

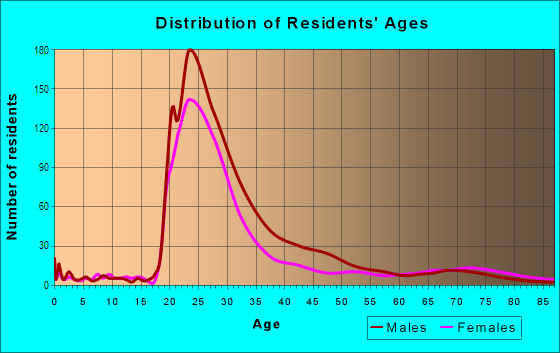
| Males: | 1,222 |
| Females: | 1,582 |
Males:
| This neighborhood: | 20.2 years |
| Whole city: | 32.7 years |
| This neighborhood: | 20.1 years |
| Whole city: | 34.1 years |
Average household size:
| West Fens: | 1.8 people |
| Boston: | 2.1 people |
Percentage of family households:
| West Fens: | 28.5% |
| Boston: | 34.5% |
| Here: | 11.7% |
| Boston: | 26.9% |
Percentage of married-couple families with children (among all households):
| West Fens: | 5.8% |
| Boston: | 24.9% |
Percentage of single-mother households (among all households):
| West Fens: | 0.0% |
| Boston: | 15.7% |
Percentage of never married males 15 years old and over:
Percentage of never married females 15 years old and over:
| West Fens: | 41.1% |
| Boston: | 26.8% |
Percentage of never married females 15 years old and over:
| West Fens: | 56.1% |
| city: | 28.3% |
Percentage of people that speak English not well or not at all:
| West Fens: | 0.0% |
| Boston: | 8.0% |
Percentage of people born in this state:
Percentage of people born in another U.S. state:
Percentage of native residents but born outside the U.S.:
Percentage of foreign born residents:
| Here: | 33.7% |
| Boston: | 42.4% |
Percentage of people born in another U.S. state:
| West Fens: | 49.9% |
| Boston: | 26.6% |
Percentage of native residents but born outside the U.S.:
| Here: | 1.3% |
| city: | 3.3% |
Percentage of foreign born residents:
| Here: | 15.1% |
| Boston: | 27.6% |
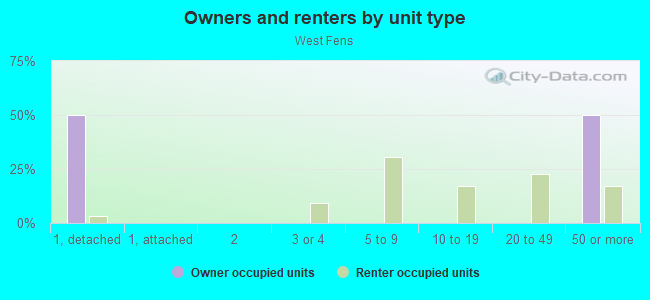
Owner-occupied
Renter-occupied

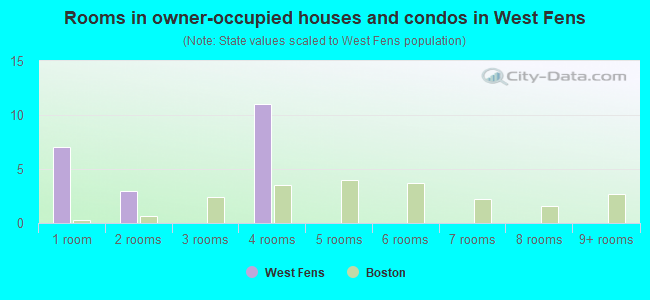
- Rooms in owner-occupied houses and condos in West Fens
- 71 room
- 32 rooms
- 03 rooms
- 114 rooms
- 05 rooms
- 06 rooms
- 07 rooms
- 08 rooms
- 09+ rooms
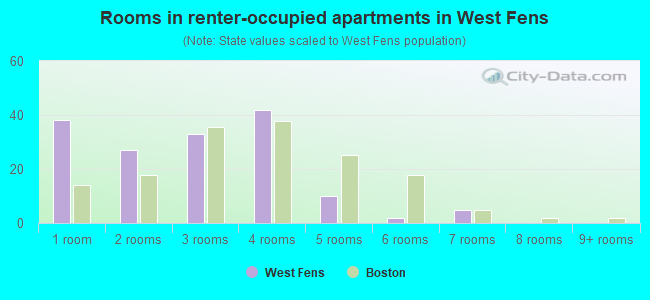
- Rooms in renter-occupied apartments in West Fens
- 381 room
- 272 rooms
- 333 rooms
- 424 rooms
- 105 rooms
- 26 rooms
- 57 rooms
- 08 rooms
- 09+ rooms
Owner-occupied
Renter-occupied
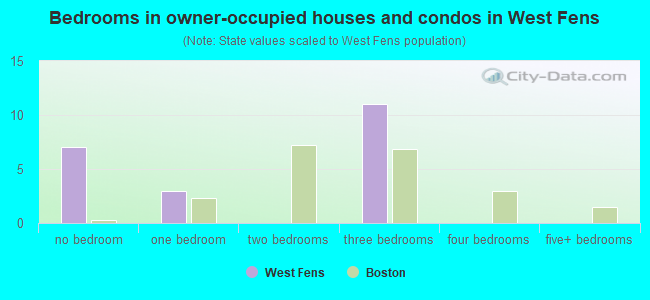
- Bedrooms in owner-occupied houses and condos in West Fens
- 7no bedroom
- 31 bedroom
- 02 bedrooms
- 113 bedrooms
- 04 bedrooms
- 05+ bedrooms
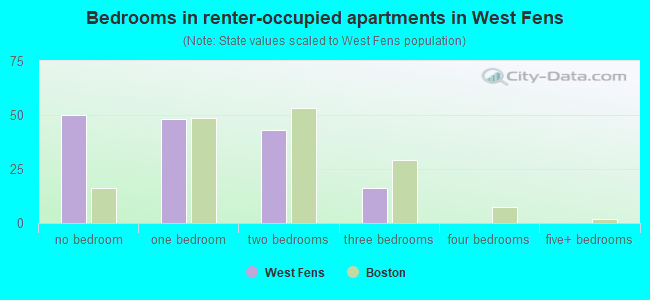
- Bedrooms in renter-occupied apartments in West Fens
- 50no bedroom
- 481 bedroom
- 432 bedrooms
- 163 bedrooms
- 04 bedrooms
- 05+ bedrooms
Average number of cars or other vehicles available in houses/condos:
Average number of cars or other vehicles available in apartments:
| This neighborhood: | |
| Boston: |
Average number of cars or other vehicles available in apartments:
| Here: | 0.4 |
| city: | 0.7 |
Percentage of units with a mortgage:
| West Fens: | 100.0% |
| Boston: | 69.7% |
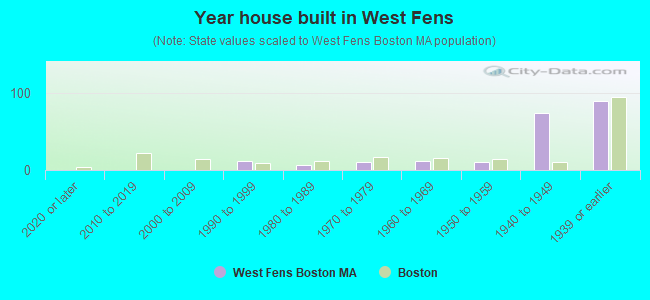
- Year house built in West Fens
- 02020 or later
- 02010 to 2019
- 02000 to 2009
- 111990 to 1999
- 71980 to 1989
- 101970 to 1979
- 111960 to 1969
- 101950 to 1959
- 741940 to 1949
- 891939 or earlier
City-data.com crime index for city in 2020 (higher means more crime):
| City: | 258.2 |
| U.S. average: | 219.5 |
Travel time to work (commute)
![Travel time to work (commute)]()
- 104Less than 5 minutes
- 4335 to 9 minutes
- 23210 to 14 minutes
- 17615 to 19 minutes
- 11920 to 24 minutes
- 1925 to 29 minutes
- 12030 to 34 minutes
- 2635 to 39 minutes
- 940 to 44 minutes
- 1745 to 59 minutes
- 5160 to 89 minutes
- 1790 or more minutes

Means of transportation to work
![Means of transportation to work]()
- 6.4%78Drove a car alone
- 3.6%44Carpooled
- 4.4%54Bus
- 5.7%70Subway or elevated rail
- 2.5%31Light rail, streetcar or trolley
- 2.6%32Bicycle
- 64.5%787Walked
- 1.5%18Other means
- 12.9%157Worked at home

Time leaving home to go to work
![Time leaving home to go to work]()
- 212:00 a.m. to 4:59 a.m.
- 455:30 a.m. to 5:59 a.m.
- 186:00 a.m. to 6:29 a.m.
- 176:30 a.m. to 6:59 a.m.
- 517:00 a.m. to 7:29 a.m.
- 937:30 a.m. to 7:59 a.m.
- 1218:00 a.m. to 8:29 a.m.
- 1098:30 a.m. to 8:59 a.m.
- 1479:00 a.m. to 9:59 a.m.
- 8010:00 a.m. to 10:59 a.m.
- 13811:00 a.m. to 11:59 a.m.
- 24112:00 p.m. to 3:59 p.m.
- 2664:00 p.m. to 11:59 p.m.

Occupations of males:
- Percentage of males in management occupations (except farmers):
Here: 5.6% city: 12.7%
- Percentage of males in business and financial operations occupations:
Here: 2.0% city: 9.1%
- Percentage of males in computer and mathematical occupations:
Here: 3.3% city: 7.4%
- Percentage of males in life, physical, and social science occupations:
Here: 9.2% city: 3.9%
- Percentage of males in education, training, and library occupations:
Here: 3.9% city: 5.7%
- Percentage of males in arts, design, entertainment, sports, and media occupations:
Here: 1.8% city: 2.7%
- Percentage of males in healthcare practitioners and technical occupations:
Here: 1.3% city: 4.4%
- Percentage of males in service occupations:
Here: 36.5% city: 16.0%
- Percentage of males in sales and office occupations:
Here: 32.6% city: 15.2%
- Percentage of males in material moving occupations:
Here: 1.4% city: 2.3%
Occupations of females:
- Percentage of females in management occupations (except farmers):
Here: 4.1% city: 12.2%
- Percentage of females in business and financial operations occupations:
Here: 6.7% city: 9.5%
- Percentage of females in computer and mathematical occupations:
Here: 3.7% city: 3.2%
- Percentage of females in architecture and engineering occupations:
Here: 1.6% city: 1.0%
- Percentage of females in life, physical, and social science occupations:
Here: 3.6% city: 3.3%
- Percentage of females in education, training, and library occupations:
Here: 8.1% city: 9.4%
- Percentage of females in arts, design, entertainment, sports, and media occupations:
Here: 5.3% city: 3.4%
- Percentage of females in healthcare practitioners and technical occupations:
Here: 3.4% city: 10.2%
- Percentage of females in service occupations:
Here: 19.0% city: 18.6%
- Percentage of females in sales and office occupations:
Here: 40.9% city: 20.2%
- Percentage of females in construction, extraction, and maintenance occupations:
Here: 1.3% city: 0.2%
- Percentage of females in material moving occupations:
Here: 1.3% city: 1.0%
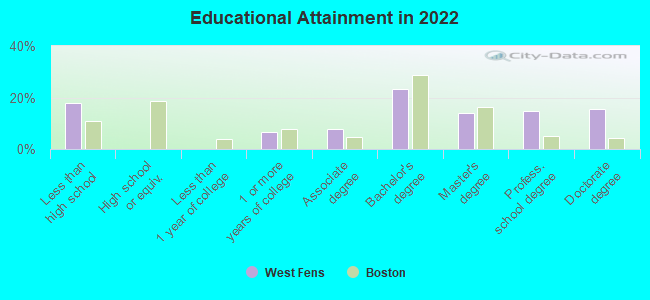
Education in this neighborhood (subdivision or community):
- Percentage of people 3 years and older in K-12 schools:
West Fens: 0.0% Boston: 11.0%
- Percentage of people 3 years and older in undergraduate colleges:
West Fens: 86.1% Boston: 11.0%
- Percentage of people 3 years and older in grad. or professional schools:
West Fens: 6.7% Boston: 4.3%
Percentage of population below poverty level:
| West Fens: | 17.6% |
| Boston: | 17.1% |
Median year renter moved in (as recorded in 2022):
| West Fens: | 2018 |
| Boston: | 2020 |
Percentage of married-couple families with both working:
| West Fens: | 100.0% |
| Boston: | 78.2% |
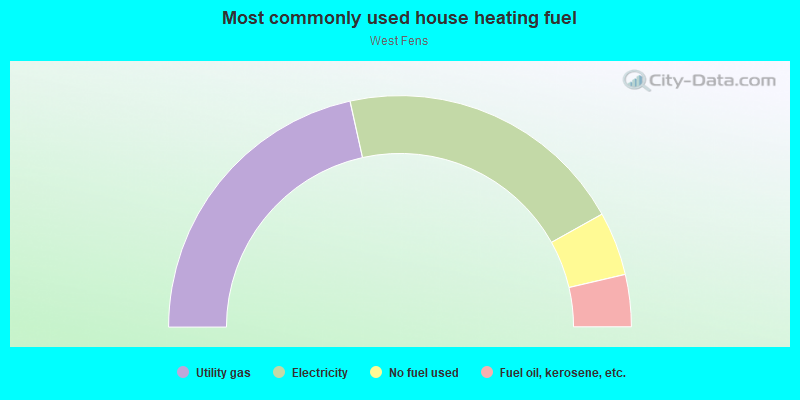
- 43.1%Utility gas
- 40.7%Electricity
- 8.9%No fuel used
- 7.3%Fuel oil, kerosene, etc.
Roads and streets:
Park Dr
Length: 1.30 miles
Directions: E-W, N-S, SE-NW, SW-NE
Address range: 1 to 98
Directions: E-W, N-S, SE-NW, SW-NE
Address range: 1 to 98
Boylston St
Length: 0.77 miles
Directions: E-W, N-S, SE-NW, SW-NE
Address range: 1156 to 1467
Directions: E-W, N-S, SE-NW, SW-NE
Address range: 1156 to 1467
Peterborough St
Length: 0.52 miles
Directions: E-W, SW-NE
Address range: 1 to 199
Directions: E-W, SW-NE
Address range: 1 to 199
Queensberry St
Length: 0.46 miles
Direction: E-W
Address range: 1 to 199
Direction: E-W
Address range: 1 to 199
Van Ness St
Length: 0.33 miles
Direction: E-W
Address range: 1 to 99
Direction: E-W
Address range: 1 to 99
Ipswich St
Length: 0.33 miles
Directions: E-W, N-S, SE-NW, SW-NE
Address range: 42 to 298
Directions: E-W, N-S, SE-NW, SW-NE
Address range: 42 to 298
Kilmarnock St
Length: 0.31 miles
Directions: N-S, SE-NW
Address range: 1 to 199
Directions: N-S, SE-NW
Address range: 1 to 199
Jersey St
Length: 0.27 miles
Direction: SE-NW
Address range: 41 to 199
Direction: SE-NW
Address range: 41 to 199
Charlesgate
Length: 0.20 miles
Directions: E-W, N-S, SW-NE
Address range: 1 to 6
Directions: E-W, N-S, SW-NE
Address range: 1 to 6
Agassiz Rd
Length: 0.03 miles
Direction: E-W
Address range: 82 to 99
Direction: E-W
Address range: 82 to 99
Other features:
Muddy Riv
Length: 0.43 miles
Directions: E-W, N-S, SE-NW, SW-NE
Directions: E-W, N-S, SE-NW, SW-NE