Washington Village neighborhood in Jersey City, New Jersey (NJ), 07307 detailed profile
Settings
X

Business Search - 14 Million verified businesses
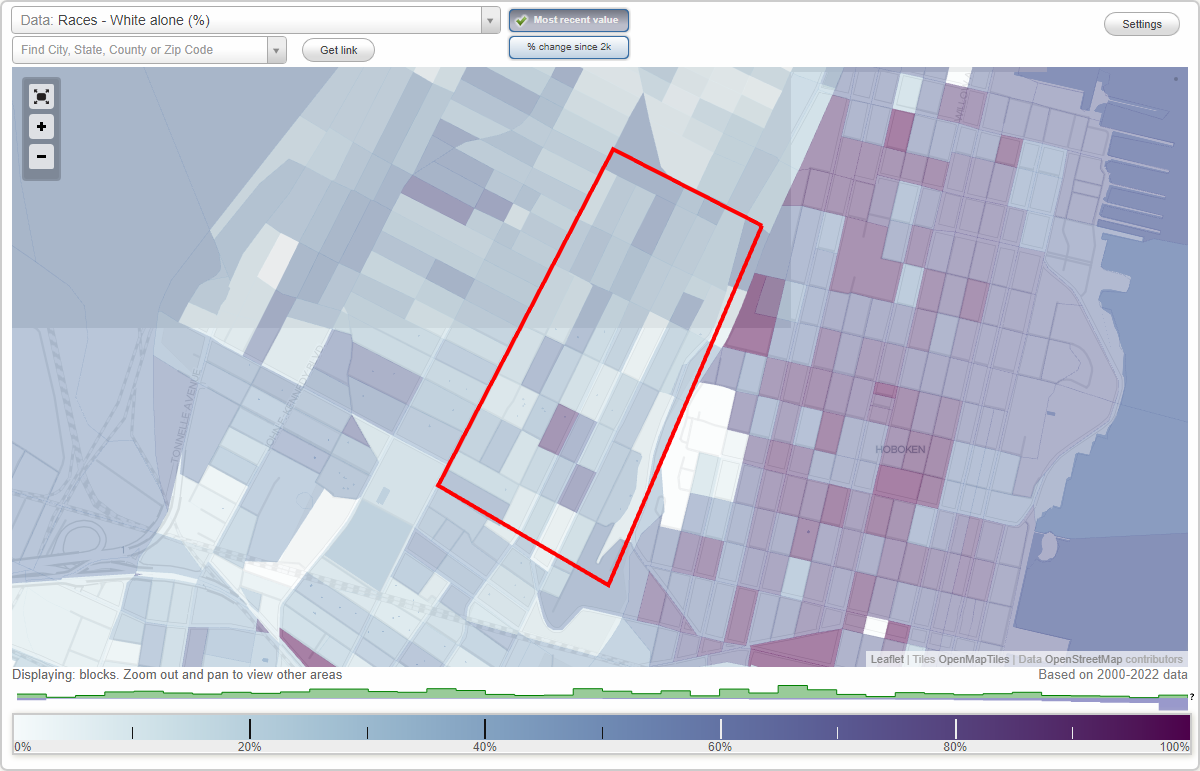
Area: 0.353 square miles
Population: 10,563
Population density:
| Washington Village: | 29,884 people per square mile |
| Jersey City: | 19,218 people per square mile |

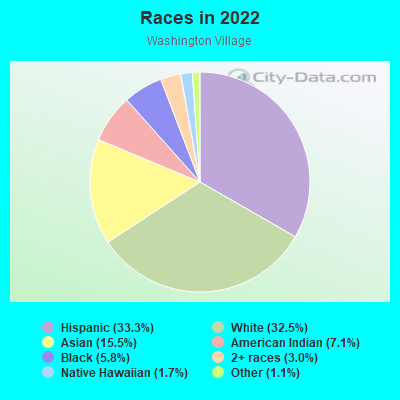
- 3,92333.3%Hispanic or Latino
- 3,83032.5%White
- 1,83315.5%Asian
- 8437.1%American Indian
- 6865.8%Black
- 3563.0%Two or more races
- 1951.7%Native Hawaiian and Other
Pacific Islander - 1321.1%Some other race
Distribution of median household income
![Distribution of median household income]()
- 356Less than $10,000
- 637$10,000 to $19,999
- 452$20,000 to $29,999
- 359$30,000 to $39,999
- 465$40,000 to $49,999
- 369$50,000 to $59,999
- 358$60,000 to $74,999
- 580$75,000 to $99,999
- 435$100,000 to $124,999
- 568$125,000 to $149,999
- 431$150,000 to $199,999
- 743$200,000 or more

Distribution of owner-occupied house/condo value
![Distribution of owner-occupied house/condo value]()
- 163Less than $50,000
- 224$50,000 to $99,999
- 368$100,000 to $149,999
- 391$150,000 to $199,999
- 160$200,000 to $249,999
- 220$250,000 to $299,999
- 236$300,000 to $399,999
- 176$400,000 to $499,999
- 564$500,000 to $749,999
- 262$750,000 to $999,999
- 376$1,000,000 or more

Distribution of rent paid by renters
![Distribution of rent paid by renters]()
- 196Less than $100
- 567$100 to $199
- 207$200 to $299
- 504$300 to $399
- 47$400 to $499
- 686$500 to $599
- 404$600 to $699
- 433$700 to $799
- 96$800 to $899
- 381$900 to $999
- 517$1,000 to $1,249
- 721$1,250 to $1,499
- 937$1,500 to $1,999
- 936$2,000 or more

Median rent in 2022:
| Washington Village: | $1,499 |
| Jersey City: | $1,738 |
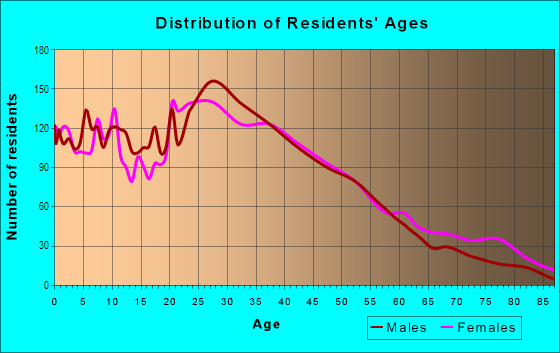
| Males: | 5,489 |
| Females: | 5,074 |
Males:
| This neighborhood: | 33.1 years |
| Whole city: | 34.1 years |
| This neighborhood: | 37.2 years |
| Whole city: | 36.2 years |
Average household size:
| Washington Village: | 4.1 people |
| Jersey City: | 2.2 people |
Percentage of family households:
| Washington Village: | 45.3% |
| Jersey City: | 39.8% |
| Here: | 41.3% |
| Jersey City: | 34.2% |
Percentage of married-couple families with children (among all households):
| Washington Village: | 38.6% |
| Jersey City: | 29.4% |
Percentage of single-mother households (among all households):
| Washington Village: | 7.8% |
| Jersey City: | 13.3% |
Percentage of never married males 15 years old and over:
Percentage of never married females 15 years old and over:
| Washington Village: | 25.6% |
| Jersey City: | 23.6% |
Percentage of never married females 15 years old and over:
| Washington Village: | 15.0% |
| city: | 22.6% |
Percentage of people that speak English not well or not at all:
| Washington Village: | 11.6% |
| Jersey City: | 7.2% |
Percentage of people born in this state:
Percentage of people born in another U.S. state:
Percentage of native residents but born outside the U.S.:
Percentage of foreign born residents:
| Here: | 33.5% |
| Jersey City: | 34.5% |
Percentage of people born in another U.S. state:
| Washington Village: | 22.9% |
| Jersey City: | 22.1% |
Percentage of native residents but born outside the U.S.:
| Here: | 3.1% |
| city: | 3.8% |
Percentage of foreign born residents:
| Here: | 40.6% |
| Jersey City: | 39.6% |
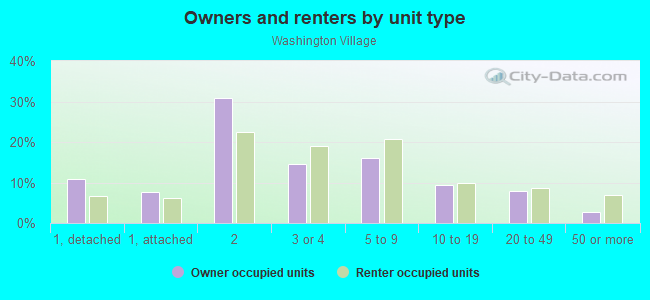
Owner-occupied
Renter-occupied

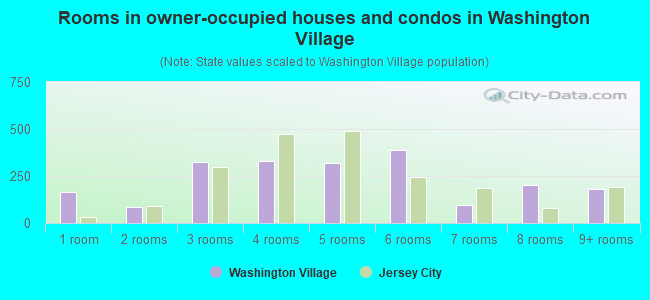
- Rooms in owner-occupied houses and condos in Washington Village
- 1641 room
- 852 rooms
- 3273 rooms
- 3294 rooms
- 3195 rooms
- 3886 rooms
- 947 rooms
- 2048 rooms
- 1799+ rooms
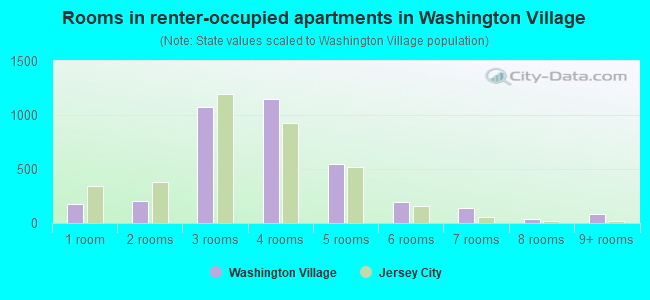
- Rooms in renter-occupied apartments in Washington Village
- 1731 room
- 2012 rooms
- 1,0713 rooms
- 1,1524 rooms
- 5495 rooms
- 1946 rooms
- 1407 rooms
- 408 rooms
- 849+ rooms
Owner-occupied
Renter-occupied
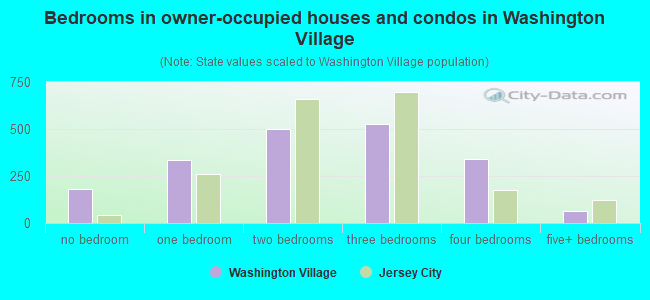
- Bedrooms in owner-occupied houses and condos in Washington Village
- 183no bedroom
- 3371 bedroom
- 5022 bedrooms
- 5283 bedrooms
- 3434 bedrooms
- 625+ bedrooms
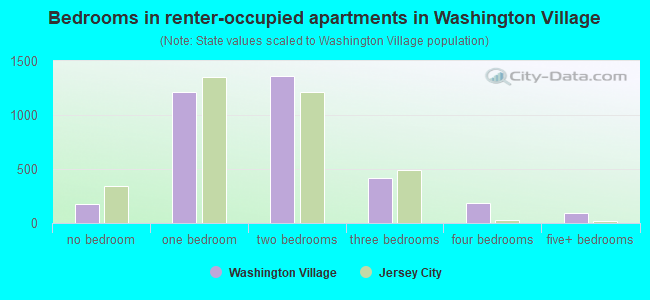
- Bedrooms in renter-occupied apartments in Washington Village
- 177no bedroom
- 1,2121 bedroom
- 1,3582 bedrooms
- 4133 bedrooms
- 1874 bedrooms
- 975+ bedrooms
Average number of cars or other vehicles available in houses/condos:
Average number of cars or other vehicles available in apartments:
| This neighborhood: | |
| Jersey City: |
Average number of cars or other vehicles available in apartments:
| Here: | 0.7 |
| city: | 0.6 |
Percentage of units with a mortgage:
| Washington Village: | 66.4% |
| Jersey City: | 69.4% |
Housing prices:
- Average estimated value of housing units in 2-unit structures in 2022 (30.1% of all units):
This neighborhood: $559,097 Jersey City: $571,976
- Average estimated '22 value of housing units in 5-or-more-unit structures (6.3% of all units):
Washington Village: $192,869 Jersey City: $666,445
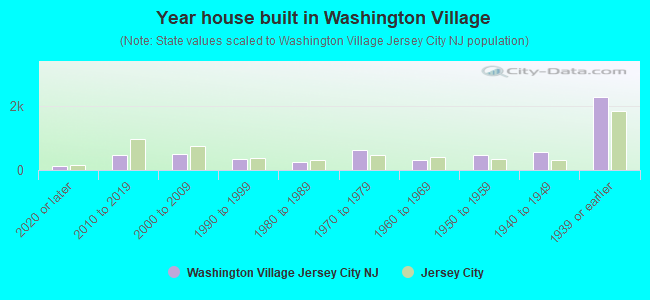
- Year house built in Washington Village
- 1262020 or later
- 4742010 to 2019
- 5062000 to 2009
- 3341990 to 1999
- 2601980 to 1989
- 6251970 to 1979
- 3251960 to 1969
- 4731950 to 1959
- 5511940 to 1949
- 2,2701939 or earlier
City-data.com crime index for city in 2020 (higher means more crime):
| City: | 198.8 |
| U.S. average: | 219.5 |
Travel time to work (commute)
![Travel time to work (commute)]()
- 341Less than 5 minutes
- 3695 to 9 minutes
- 58210 to 14 minutes
- 99315 to 19 minutes
- 50420 to 24 minutes
- 32825 to 29 minutes
- 1,20330 to 34 minutes
- 22035 to 39 minutes
- 82240 to 44 minutes
- 87945 to 59 minutes
- 1,41660 to 89 minutes
- 15690 or more minutes

Means of transportation to work
![Means of transportation to work]()
- 25.9%1,598Drove a car alone
- 8.2%507Carpooled
- 20.7%1,281Bus
- 13.5%834Subway or elevated rail
- 2.2%138Long-distance train or commuter rail
- 2.2%139Light rail, streetcar or trolley
- 2.9%177Ferryboat
- 1.8%110Taxi
- 1.1%65Bicycle
- 8.5%526Walked
- 10.8%667Other means
- 18.7%1,154Worked at home

Time leaving home to go to work
![Time leaving home to go to work]()
- 33912:00 a.m. to 4:59 a.m.
- 2445:00 a.m. to 5:29 a.m.
- 1515:30 a.m. to 5:59 a.m.
- 4366:00 a.m. to 6:29 a.m.
- 1966:30 a.m. to 6:59 a.m.
- 1,1997:00 a.m. to 7:29 a.m.
- 7867:30 a.m. to 7:59 a.m.
- 2,2438:00 a.m. to 8:29 a.m.
- 5978:30 a.m. to 8:59 a.m.
- 8309:00 a.m. to 9:59 a.m.
- 46810:00 a.m. to 10:59 a.m.
- 7411:00 a.m. to 11:59 a.m.
- 31212:00 p.m. to 3:59 p.m.
- 5434:00 p.m. to 11:59 p.m.

Occupations of males:
- Percentage of males in management occupations (except farmers):
Here: 11.0% city: 12.9%
- Percentage of males in business and financial operations occupations:
Here: 9.4% city: 9.9%
- Percentage of males in computer and mathematical occupations:
Here: 10.1% city: 13.5%
- Percentage of males in architecture and engineering occupations:
Here: 2.2% city: 3.7%
- Percentage of males in life, physical, and social science occupations:
Here: 2.8% city: 1.1%
- Percentage of males in legal occupations:
Here: 1.8% city: 1.8%
- Percentage of males in education, training, and library occupations:
Here: 4.1% city: 3.6%
- Percentage of males in arts, design, entertainment, sports, and media occupations:
Here: 5.9% city: 3.5%
- Percentage of males in healthcare practitioners and technical occupations:
Here: 1.6% city: 2.6%
- Percentage of males in service occupations:
Here: 12.2% city: 10.4%
- Percentage of males in sales and office occupations:
Here: 13.9% city: 13.4%
- Percentage of males in construction, extraction, and maintenance occupations:
Here: 8.8% city: 5.6%
- Percentage of males in production occupations:
Here: 3.1% city: 2.8%
- Percentage of males in transportation occupations:
Here: 5.6% city: 7.2%
- Percentage of males in material moving occupations:
Here: 4.4% city: 4.2%
Occupations of females:
- Percentage of females in management occupations (except farmers):
Here: 17.4% city: 11.5%
- Percentage of females in business and financial operations occupations:
Here: 7.5% city: 11.7%
- Percentage of females in computer and mathematical occupations:
Here: 4.0% city: 5.3%
- Percentage of females in community and social services occupations:
Here: 3.6% city: 2.2%
- Percentage of females in legal occupations:
Here: 2.9% city: 2.6%
- Percentage of females in education, training, and library occupations:
Here: 5.5% city: 8.3%
- Percentage of females in arts, design, entertainment, sports, and media occupations:
Here: 9.1% city: 4.9%
- Percentage of females in healthcare practitioners and technical occupations:
Here: 1.5% city: 6.5%
- Percentage of females in service occupations:
Here: 19.5% city: 17.9%
- Percentage of females in sales and office occupations:
Here: 19.8% city: 21.2%
- Percentage of females in production occupations:
Here: 6.2% city: 2.7%
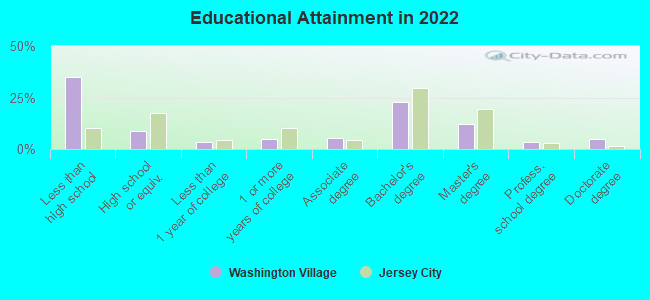
Education in this neighborhood (subdivision or community):
- Percentage of people 3 years and older in K-12 schools:
Washington Village: 19.6% Jersey City: 12.9%
- Percentage of people 3 years and older in undergraduate colleges:
Washington Village: 3.6% Jersey City: 4.5%
- Percentage of people 3 years and older in grad. or professional schools:
Washington Village: 3.8% Jersey City: 2.2%
- Percentage of students K-12 enrolled in private schools:
Washington Village: 107.2% Jersey City: 10.8%
Percentage of population below poverty level:
| Washington Village: | 12.4% |
| Jersey City: | 12.8% |
Median year owner moved in (as recorded in 2022):
Median year renter moved in (as recorded in 2022):
| Washington Village: | 2009 |
| Jersey City: | 2010 |
Median year renter moved in (as recorded in 2022):
| Washington Village: | 2016 |
| Jersey City: | 2019 |
Percentage of married-couple families with both working:
| Washington Village: | 81.9% |
| Jersey City: | 63.9% |
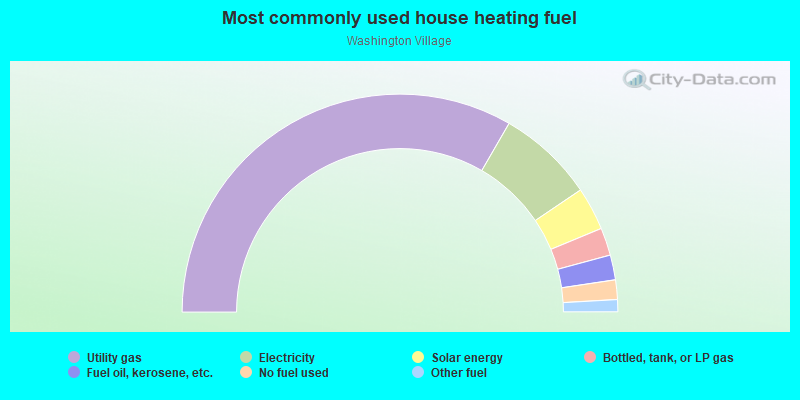
- 66.7%Utility gas
- 14.4%Electricity
- 6.4%Solar energy
- 4.1%Bottled, tank, or LP gas
- 3.7%Fuel oil, kerosene, etc.
- 2.9%No fuel used
- 1.8%Other fuel
Roads and streets:
Palisade Ave
Length: 0.88 miles
Direction: SW-NE
Address range: 329 to 647
Direction: SW-NE
Address range: 329 to 647
Sherman Ave
Length: 0.82 miles
Direction: SW-NE
Address range: 21 to 327
Direction: SW-NE
Address range: 21 to 327
Cambridge Ave (Co Rd 665)
Length: 0.78 miles
Directions: E-W, SW-NE
Address range: 1 to 806
Directions: E-W, SW-NE
Address range: 1 to 806
Hancock Ave (Co Rd 667)
Length: 0.78 miles
Directions: E-W, SW-NE
Address range: 1 to 287
Directions: E-W, SW-NE
Address range: 1 to 287
Co Rd 671 (New York Ave)
Length: 0.77 miles
Direction: SW-NE
Address range: 159 to 439
Direction: SW-NE
Address range: 159 to 439
Co Rd 669 (Webster Ave)
Length: 0.77 miles
Direction: SW-NE
Address range: 97 to 377
Direction: SW-NE
Address range: 97 to 377
Ogden Ave
Length: 0.67 miles
Direction: SW-NE
Address range: 271 to 476
Direction: SW-NE
Address range: 271 to 476
Co Rd 664 (Congress St)
Length: 0.42 miles
Direction: E-W
Address range: 1 to 113
Direction: E-W
Address range: 1 to 113
Griffith St
Length: 0.39 miles
Direction: E-W
Address range: 25 to 127
Direction: E-W
Address range: 25 to 127
Bowers St
Length: 0.39 miles
Direction: E-W
Address range: 26 to 106
Direction: E-W
Address range: 26 to 106
Mountain Rd (Co Rd 731)
Length: 0.38 miles
Directions: E-W, N-S, SE-NW, SW-NE
Address range: 20 to 160
Directions: E-W, N-S, SE-NW, SW-NE
Address range: 20 to 160
Franklin St
Length: 0.37 miles
Directions: E-W, SE-NW
Address range: 24 to 129
Directions: E-W, SE-NW
Address range: 24 to 129
South St
Length: 0.36 miles
Directions: E-W, SE-NW
Address range: 1 to 94
Directions: E-W, SE-NW
Address range: 1 to 94
North St
Length: 0.31 miles
Direction: E-W
Address range: 1 to 81
Direction: E-W
Address range: 1 to 81
Hutton St
Length: 0.31 miles
Direction: E-W
Address range: 1 to 80
Direction: E-W
Address range: 1 to 80
Paterson Plank Rd (Co Rd 681)
Length: 0.29 miles
Directions: N-S, SW-NE
Address range: 1 to 277
Directions: N-S, SW-NE
Address range: 1 to 277
Holland Plank Rd
Length: 0.09 miles
Directions: E-W, SW-NE
Directions: E-W, SW-NE
Hope St
Length: 0.09 miles
Direction: SW-NE
Address range: 2 to 33
Direction: SW-NE
Address range: 2 to 33
Hobson St
Length: 0.06 miles
Direction: E-W
Address range: 1 to 17
Direction: E-W
Address range: 1 to 17
Co Rd 731
Length: 0.04 miles
Directions: E-W, SW-NE
Directions: E-W, SW-NE
Railroad features:
New Jersey Transit RR
Length: 0.04 miles
Direction: SW-NE
Direction: SW-NE