Victoria Heights West neighborhood in Denver, Colorado (CO), 80260 detailed profile
Settings
X


Business Search - 14 Million verified businesses
Area: 0.107 square miles
Population: 271
Population density:
| Victoria Heights West: | 2,538 people per square mile |
| Denver: | 4,651 people per square mile |

- 12727.8%White
- 10923.9%Some other race
- 7416.2%Hispanic or Latino
- 6915.1%Black
- 6013.1%Two or more races
- 92.0%Asian
- 51.1%American Indian
- 40.9%Native Hawaiian and Other
Pacific Islander

Median household income in 2022:
| Victoria Heights West: | $54,012 |
| Denver: | $88,213 |
Distribution of median household income
![Distribution of median household income]()
- 33$10,000 to $19,999
- 186$20,000 to $29,999
- 120$30,000 to $39,999
- 15$40,000 to $49,999
- 10$50,000 to $59,999
- 31$60,000 to $74,999
- 26$75,000 to $99,999
- 51$100,000 to $124,999
- 15$125,000 to $149,999
- 4$150,000 to $199,999
- 16$200,000 or more

Distribution of owner-occupied house/condo value
![Distribution of owner-occupied house/condo value]()
- 71Less than $50,000
- 57$50,000 to $99,999
- 177$100,000 to $149,999
- 186$200,000 to $249,999
- 42$250,000 to $299,999
- 61$300,000 to $399,999
- 51$400,000 to $499,999
- 5$500,000 to $749,999

Distribution of rent paid by renters
![Distribution of rent paid by renters]()
- 13$200 to $299
- 139$600 to $699
- 6$800 to $899
- 16$900 to $999
- 97$1,000 to $1,249
- 167$1,250 to $1,499
- 113$1,500 to $1,999
- 8$2,000 or more

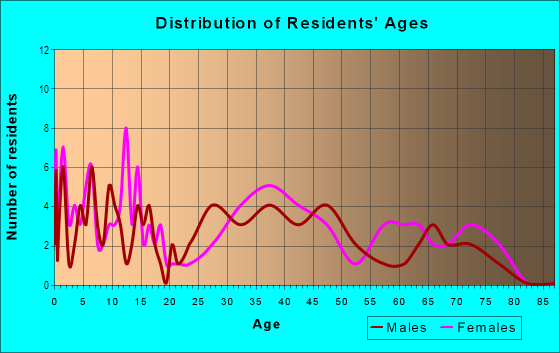
| Males: | 150 |
| Females: | 120 |
Males:
| This neighborhood: | 35.5 years |
| Whole city: | 35.2 years |
| This neighborhood: | 32.1 years |
| Whole city: | 35.1 years |
Average household size:
| Victoria Heights West: | 10.2 people |
| Denver: | 28.0 people |
Percentage of family households:
| Victoria Heights West: | 44.6% |
| Denver: | 35.1% |
| Here: | 48.1% |
| Denver: | 32.5% |
Percentage of married-couple families with children (among all households):
| Victoria Heights West: | 29.8% |
| Denver: | 32.4% |
Percentage of single-mother households (among all households):
| Victoria Heights West: | 4.6% |
| Denver: | 10.3% |
Percentage of never married males 15 years old and over:
Percentage of never married females 15 years old and over:
| Victoria Heights West: | 38.7% |
| Denver: | 25.0% |
Percentage of never married females 15 years old and over:
| Victoria Heights West: | 13.1% |
| city: | 20.8% |
Percentage of people that speak English not well or not at all:
| Victoria Heights West: | 9.3% |
| Denver: | 3.9% |
Percentage of people born in this state:
Percentage of people born in another U.S. state:
Percentage of native residents but born outside the U.S.:
Percentage of foreign born residents:
| Here: | 51.7% |
| Denver: | 38.5% |
Percentage of people born in another U.S. state:
| Victoria Heights West: | 35.1% |
| Denver: | 46.1% |
Percentage of native residents but born outside the U.S.:
| Here: | 1.0% |
| city: | 1.7% |
Percentage of foreign born residents:
| Here: | 12.2% |
| Denver: | 13.8% |

Owner-occupied
Renter-occupied


- Rooms in owner-occupied houses and condos in Victoria Heights West
- 01 room
- 02 rooms
- 293 rooms
- 654 rooms
- 975 rooms
- 106 rooms
- 257 rooms
- 158 rooms
- 179+ rooms

- Rooms in renter-occupied apartments in Victoria Heights West
- 01 room
- 172 rooms
- 2403 rooms
- 1724 rooms
- 75 rooms
- 06 rooms
- 1117 rooms
- 28 rooms
- 159+ rooms
Owner-occupied
Renter-occupied

- Bedrooms in owner-occupied houses and condos in Victoria Heights West
- 0no bedroom
- 01 bedroom
- 812 bedrooms
- 183 bedrooms
- 424 bedrooms
- 75+ bedrooms

- Bedrooms in renter-occupied apartments in Victoria Heights West
- 0no bedroom
- 1181 bedroom
- 2692 bedrooms
- 233 bedrooms
- 14 bedrooms
- 125+ bedrooms
Average number of cars or other vehicles available in houses/condos:
Average number of cars or other vehicles available in apartments:
| This neighborhood: | 1.9 |
| Denver: | 1.9 |
Average number of cars or other vehicles available in apartments:
| Here: | 24.5 |
| city: | 1.3 |
Percentage of units with a mortgage:
| Victoria Heights West: | 83.2% |
| Denver: | 75.6% |
Average estimated value of detached houses in 2022 (97.8% of all units):
| Victoria Heights West: | $336,399 |
| Colorado: | $676,667 |

- Year house built in Victoria Heights West
- 02020 or later
- 542010 to 2019
- 02000 to 2009
- 2011990 to 1999
- 1501980 to 1989
- 151970 to 1979
- 351960 to 1969
- 331950 to 1959
- 71940 to 1949
- 01939 or earlier

City-data.com crime index for city in 2020 (higher means more crime):
| City: | 519.0 |
| U.S. average: | 219.5 |
Travel time to work (commute)
![Travel time to work (commute)]()
- 10Less than 5 minutes
- 115 to 9 minutes
- 2510 to 14 minutes
- 6115 to 19 minutes
- 3220 to 24 minutes
- 1225 to 29 minutes
- 6030 to 34 minutes
- 935 to 39 minutes
- 1040 to 44 minutes
- 845 to 59 minutes
- 1760 to 89 minutes

Means of transportation to work
![Means of transportation to work]()
- 87.5%151Drove a car alone
- 9.3%16Carpooled
- 45.8%79Bus
- 16.8%29Other means
- 2.3%4Worked at home

Time leaving home to go to work
![Time leaving home to go to work]()
- 1312:00 a.m. to 4:59 a.m.
- 215:00 a.m. to 5:29 a.m.
- 215:30 a.m. to 5:59 a.m.
- 416:00 a.m. to 6:29 a.m.
- 386:30 a.m. to 6:59 a.m.
- 357:00 a.m. to 7:29 a.m.
- 187:30 a.m. to 7:59 a.m.
- 298:00 a.m. to 8:29 a.m.
- 58:30 a.m. to 8:59 a.m.
- 309:00 a.m. to 9:59 a.m.
- 310:00 a.m. to 10:59 a.m.
- 1212:00 p.m. to 3:59 p.m.
- 104:00 p.m. to 11:59 p.m.

Occupations of males:
- Percentage of males in architecture and engineering occupations:
Here: 1.9% city: 4.5%
- Percentage of males in education, training, and library occupations:
Here: 10.2% city: 3.1%
- Percentage of males in healthcare practitioners and technical occupations:
Here: 11.4% city: 3.5%
- Percentage of males in sales and office occupations:
Here: 4.5% city: 15.4%
- Percentage of males in construction, extraction, and maintenance occupations:
Here: 27.3% city: 8.0%
- Percentage of males in production occupations:
Here: 22.8% city: 3.2%
- Percentage of males in transportation occupations:
Here: 5.9% city: 4.2%
Occupations of females:
- Percentage of females in management occupations (except farmers):
Here: 6.0% city: 14.0%
- Percentage of females in business and financial operations occupations:
Here: 19.1% city: 10.0%
- Percentage of females in healthcare practitioners and technical occupations:
Here: 15.3% city: 10.2%
- Percentage of females in sales and office occupations:
Here: 58.4% city: 21.4%
- Percentage of females in construction, extraction, and maintenance occupations:
Here: 2.5% city: 0.4%
- Percentage of females in production occupations:
Here: 5.0% city: 1.7%
- Percentage of females in material moving occupations:
Here: 1.3% city: 1.4%
Education in this neighborhood (subdivision or community):
- Percentage of people 3 years and older in K-12 schools:
Victoria Heights West: 94.4% Denver: 12.7%
- Percentage of people 3 years and older in undergraduate colleges:
Victoria Heights West: 10.7% Denver: 4.1%
- Percentage of people 3 years and older in grad. or professional schools:
Victoria Heights West: 6.3% Denver: 2.2%
- Percentage of students K-12 enrolled in private schools:
Victoria Heights West: 0.0% Denver: 11.0%
Percentage of population below poverty level:
| Victoria Heights West: | 4.9% |
| Denver: | 11.8% |
Median year owner moved in (as recorded in 2022):
| Victoria Heights West: | 2012 |
| Denver: | 2014 |
Percentage of married-couple families with both working:
| Victoria Heights West: | 414.1% |
| Denver: | 74.1% |

- 59.3%Electricity
- 40.7%Utility gas
Roads and streets:
Niver Ave
Length: 0.25 miles
Directions: E-W, N-S, SE-NW
Address range: 812 to 1109
Directions: E-W, N-S, SE-NW
Address range: 812 to 1109
W 99th Ave
Length: 0.16 miles
Direction: E-W
Address range: 803 to 1001
Direction: E-W
Address range: 803 to 1001
Lunceford Ct
Length: 0.05 miles
Direction: N-S
Direction: N-S
Darwin Ct
Length: 0.02 miles
Direction: N-S
Address range: 1100 to 9899
Direction: N-S
Address range: 1100 to 9899