Tri-taylor neighborhood in Chicago, Illinois (IL), 60608, 60612 detailed profile
Settings
X


Business Search - 14 Million verified businesses
Area: 0.450 square miles
Population: 10,941
Population density:
| Tri-taylor: | 24,329 people per square mile |
| Chicago: | 11,734 people per square mile |

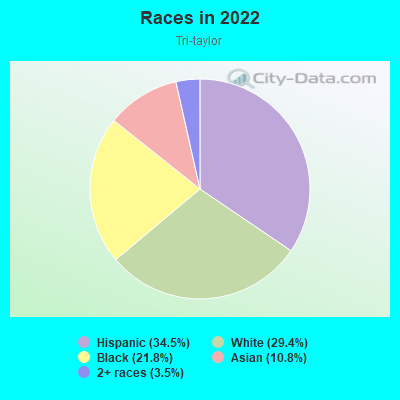
- 3,77634.5%Hispanic or Latino
- 3,21329.4%White
- 2,38021.8%Black
- 1,18610.8%Asian
- 3843.5%Two or more races
Median household income in 2022:
| Tri-taylor: | $83,635 |
| Chicago: | $70,386 |
Distribution of median household income
![Distribution of median household income]()
- 363Less than $10,000
- 444$10,000 to $19,999
- 116$20,000 to $29,999
- 295$30,000 to $39,999
- 277$40,000 to $49,999
- 497$50,000 to $59,999
- 410$60,000 to $74,999
- 570$75,000 to $99,999
- 499$100,000 to $124,999
- 314$125,000 to $149,999
- 506$150,000 to $199,999
- 625$200,000 or more

Distribution of owner-occupied house/condo value
![Distribution of owner-occupied house/condo value]()
- 88$100,000 to $149,999
- 116$150,000 to $199,999
- 448$200,000 to $249,999
- 375$250,000 to $299,999
- 524$300,000 to $399,999
- 388$400,000 to $499,999
- 195$500,000 to $749,999
- 106$750,000 to $999,999

Distribution of rent paid by renters
![Distribution of rent paid by renters]()
- 39Less than $100
- 127$300 to $399
- 249$600 to $699
- 57$700 to $799
- 345$800 to $899
- 190$900 to $999
- 251$1,000 to $1,249
- 122$1,250 to $1,499
- 1,229$1,500 to $1,999
- 634$2,000 or more

Median rent in 2022:
| Tri-taylor: | $1,662 |
| Chicago: | $1,161 |
| Males: | 4,699 |
| Females: | 6,242 |
Males:
| This neighborhood: | 36.2 years |
| Whole city: | 35.3 years |
| This neighborhood: | 27.2 years |
| Whole city: | 36.2 years |
Average household size:
| Tri-taylor: | 2.5 people |
| Chicago: | 2.3 people |
Percentage of family households:
| Tri-taylor: | 36.1% |
| Chicago: | 36.7% |
| Here: | 31.4% |
| Chicago: | 30.4% |
Percentage of married-couple families with children (among all households):
| Tri-taylor: | 34.8% |
| Chicago: | 24.1% |
Percentage of single-mother households (among all households):
| Tri-taylor: | 11.3% |
| Chicago: | 16.0% |
Percentage of never married males 15 years old and over:
Percentage of never married females 15 years old and over:
| Tri-taylor: | 20.8% |
| Chicago: | 24.5% |
Percentage of never married females 15 years old and over:
| Tri-taylor: | 34.2% |
| city: | 24.9% |
Percentage of people that speak English not well or not at all:
| Tri-taylor: | 2.6% |
| Chicago: | 7.1% |
Percentage of people born in this state:
Percentage of people born in another U.S. state:
Percentage of native residents but born outside the U.S.:
Percentage of foreign born residents:
| Here: | 52.5% |
| Chicago: | 58.6% |
Percentage of people born in another U.S. state:
| Tri-taylor: | 19.5% |
| Chicago: | 18.8% |
Percentage of native residents but born outside the U.S.:
| Here: | 0.8% |
| city: | 2.1% |
Percentage of foreign born residents:
| Here: | 27.4% |
| Chicago: | 20.6% |
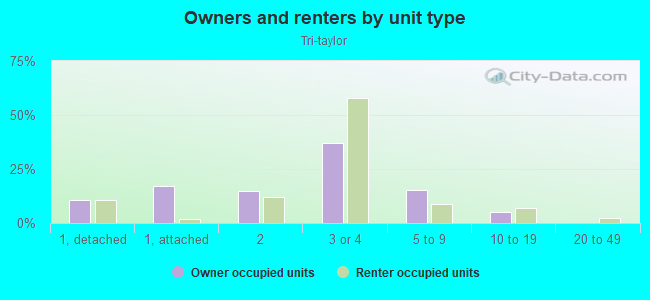
Owner-occupied
Renter-occupied

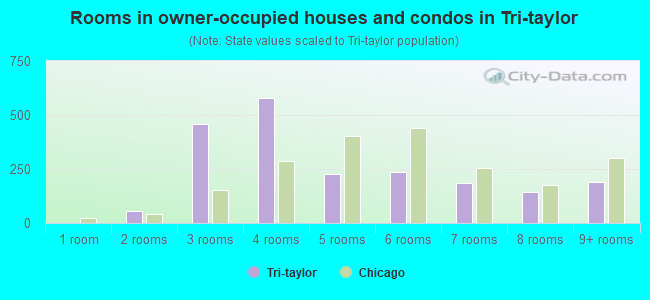
- Rooms in owner-occupied houses and condos in Tri-taylor
- 01 room
- 562 rooms
- 4583 rooms
- 5804 rooms
- 2255 rooms
- 2376 rooms
- 1857 rooms
- 1428 rooms
- 1929+ rooms
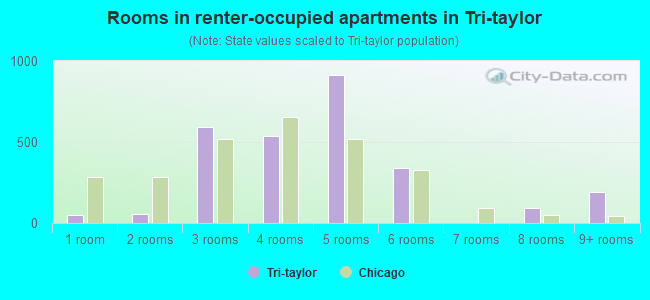
- Rooms in renter-occupied apartments in Tri-taylor
- 491 room
- 562 rooms
- 5943 rooms
- 5374 rooms
- 9145 rooms
- 3396 rooms
- 07 rooms
- 948 rooms
- 1899+ rooms
Owner-occupied
Renter-occupied
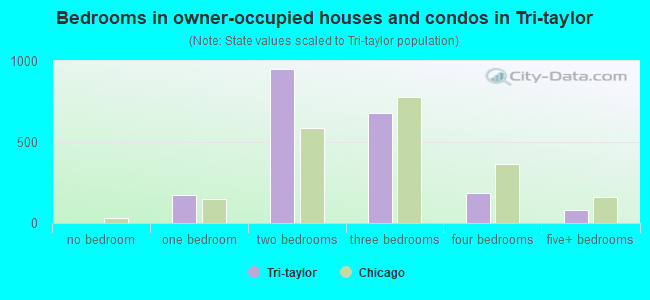
- Bedrooms in owner-occupied houses and condos in Tri-taylor
- 0no bedroom
- 1751 bedroom
- 9492 bedrooms
- 6793 bedrooms
- 1844 bedrooms
- 785+ bedrooms
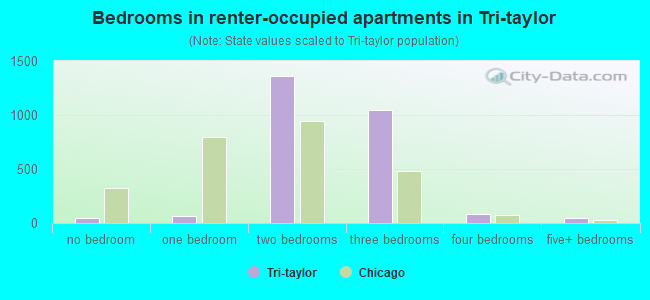
- Bedrooms in renter-occupied apartments in Tri-taylor
- 49no bedroom
- 671 bedroom
- 1,3622 bedrooms
- 1,0453 bedrooms
- 874 bedrooms
- 495+ bedrooms
Average number of cars or other vehicles available in houses/condos:
Average number of cars or other vehicles available in apartments:
| This neighborhood: | 1.4 |
| Chicago: | 1.5 |
Average number of cars or other vehicles available in apartments:
| Here: | 1.1 |
| city: | 0.8 |
Percentage of units with a mortgage:
| Tri-taylor: | 82.2% |
| Chicago: | 64.7% |
Housing prices:
- Average estimated value of detached houses in 2022 (7.5% of all units):
Tri-taylor: $499,059 Chicago: $393,455
- Average estimated value of townhouses or other attached units in 2022 (9.5% of all units):
This neighborhood: $396,030 city: $498,446
- Average estimated value of housing units in 2-unit structures in 2022 (12.4% of all units):
This neighborhood: $336,552 Chicago: $320,802
- Average estimated '22 value of housing units in 3-to-4-unit structures (53.9% of all units):
Tri-taylor: $284,033 city: $416,830
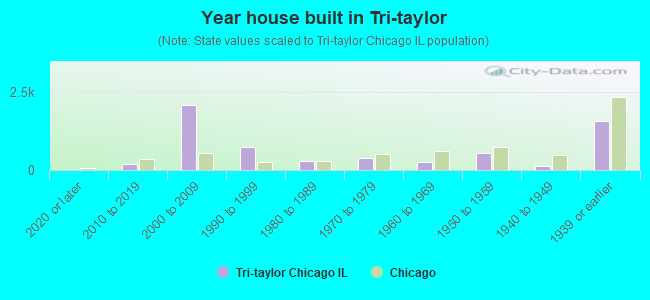
- Year house built in Tri-taylor
- 02020 or later
- 2022010 to 2019
- 2,0762000 to 2009
- 7391990 to 1999
- 2871980 to 1989
- 3731970 to 1979
- 2601960 to 1969
- 5341950 to 1959
- 1211940 to 1949
- 1,5531939 or earlier
City-data.com crime index for city in 2020 (higher means more crime):
| City: | 421.1 |
| U.S. average: | 219.5 |
Travel time to work (commute)
![Travel time to work (commute)]()
- 84Less than 5 minutes
- 2155 to 9 minutes
- 59210 to 14 minutes
- 73215 to 19 minutes
- 1,07420 to 24 minutes
- 30925 to 29 minutes
- 74030 to 34 minutes
- 9035 to 39 minutes
- 3740 to 44 minutes
- 59745 to 59 minutes
- 28260 to 89 minutes
- 21490 or more minutes

Means of transportation to work
![Means of transportation to work]()
- 43.5%2,689Drove a car alone
- 6.9%425Carpooled
- 8.1%498Bus
- 17.5%1,079Subway or elevated rail
- 2.0%126Light rail, streetcar or trolley
- 8.2%506Taxi
- 0.7%42Motorcycle
- 1.6%98Bicycle
- 10.1%624Walked
- 1.5%91Other means
- 11.2%693Worked at home

Time leaving home to go to work
![Time leaving home to go to work]()
- 8012:00 a.m. to 4:59 a.m.
- 315:00 a.m. to 5:29 a.m.
- 1785:30 a.m. to 5:59 a.m.
- 2636:00 a.m. to 6:29 a.m.
- 4026:30 a.m. to 6:59 a.m.
- 5807:00 a.m. to 7:29 a.m.
- 7987:30 a.m. to 7:59 a.m.
- 6208:00 a.m. to 8:29 a.m.
- 3998:30 a.m. to 8:59 a.m.
- 4489:00 a.m. to 9:59 a.m.
- 38010:00 a.m. to 10:59 a.m.
- 7311:00 a.m. to 11:59 a.m.
- 36812:00 p.m. to 3:59 p.m.
- 2654:00 p.m. to 11:59 p.m.

Occupations of males:
- Percentage of males in management occupations (except farmers):
Here: 15.6% city: 12.0%
- Percentage of males in business and financial operations occupations:
Here: 12.4% city: 7.9%
- Percentage of males in computer and mathematical occupations:
Here: 11.5% city: 6.3%
- Percentage of males in architecture and engineering occupations:
Here: 5.1% city: 2.4%
- Percentage of males in life, physical, and social science occupations:
Here: 2.0% city: 1.1%
- Percentage of males in legal occupations:
Here: 3.6% city: 2.1%
- Percentage of males in education, training, and library occupations:
Here: 3.4% city: 4.2%
- Percentage of males in arts, design, entertainment, sports, and media occupations:
Here: 1.6% city: 3.0%
- Percentage of males in healthcare practitioners and technical occupations:
Here: 5.4% city: 3.1%
- Percentage of males in service occupations:
Here: 6.7% city: 15.8%
- Percentage of males in sales and office occupations:
Here: 11.9% city: 14.5%
- Percentage of males in construction, extraction, and maintenance occupations:
Here: 1.9% city: 5.6%
- Percentage of males in production occupations:
Here: 1.5% city: 5.6%
- Percentage of males in transportation occupations:
Here: 2.2% city: 6.5%
- Percentage of males in material moving occupations:
Here: 5.9% city: 5.4%
Occupations of females:
- Percentage of females in management occupations (except farmers):
Here: 16.8% city: 11.1%
- Percentage of females in business and financial operations occupations:
Here: 2.9% city: 9.2%
- Percentage of females in computer and mathematical occupations:
Here: 4.4% city: 2.3%
- Percentage of females in architecture and engineering occupations:
Here: 7.6% city: 0.8%
- Percentage of females in life, physical, and social science occupations:
Here: 3.4% city: 1.2%
- Percentage of females in community and social services occupations:
Here: 3.8% city: 3.0%
- Percentage of females in legal occupations:
Here: 1.2% city: 2.3%
- Percentage of females in education, training, and library occupations:
Here: 9.8% city: 8.8%
- Percentage of females in arts, design, entertainment, sports, and media occupations:
Here: 1.4% city: 3.1%
- Percentage of females in healthcare practitioners and technical occupations:
Here: 8.3% city: 8.5%
- Percentage of females in service occupations:
Here: 18.1% city: 19.6%
- Percentage of females in sales and office occupations:
Here: 20.2% city: 23.3%
- Percentage of females in production occupations:
Here: 2.1% city: 3.0%
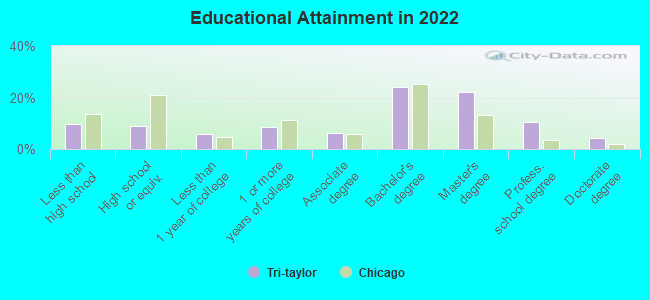
Education in this neighborhood (subdivision or community):
- Percentage of people 3 years and older in K-12 schools:
Tri-taylor: 16.4% Chicago: 14.6%
- Percentage of people 3 years and older in undergraduate colleges:
Tri-taylor: 12.2% Chicago: 5.1%
- Percentage of people 3 years and older in grad. or professional schools:
Tri-taylor: 9.8% Chicago: 2.6%
- Percentage of students K-12 enrolled in private schools:
Tri-taylor: 42.0% Chicago: 15.6%
Percentage of population below poverty level:
| Tri-taylor: | 16.3% |
| Chicago: | 17.2% |
Median year owner moved in (as recorded in 2022):
Median year renter moved in (as recorded in 2022):
| Tri-taylor: | 2008 |
| Chicago: | 2010 |
Median year renter moved in (as recorded in 2022):
| Tri-taylor: | 2014 |
| Chicago: | 2020 |
Percentage of married-couple families with both working:
| Tri-taylor: | 69.4% |
| Chicago: | 69.2% |
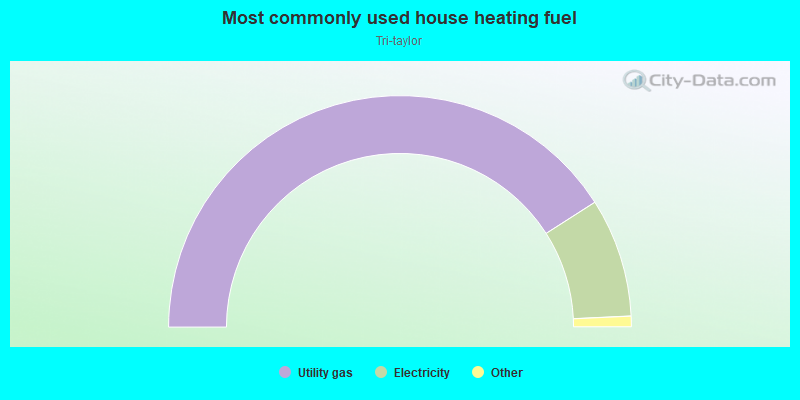
- 81.8%Utility gas
- 16.6%Electricity
- 1.0%Bottled, tank, or LP gas
- 0.6%No fuel used
Roads and streets:
W Ogden Ave
Length: 1.24 miles
Directions: E-W, SW-NE
Address range: 1877 to 2299
Directions: E-W, SW-NE
Address range: 1877 to 2299
W Congress Pkwy
Length: 1.18 miles
Direction: E-W
Address range: 1854 to 2558
Direction: E-W
Address range: 1854 to 2558
W Harrison St
Length: 1.09 miles
Direction: E-W
Address range: 1918 to 2567
Direction: E-W
Address range: 1918 to 2567
W Flournoy St
Length: 0.94 miles
Direction: E-W
Address range: 2100 to 2538
Direction: E-W
Address range: 2100 to 2538
W Polk St
Length: 0.85 miles
Direction: E-W
Address range: 2042 to 2549
Direction: E-W
Address range: 2042 to 2549
S Campbell Ave
Length: 0.76 miles
Directions: N-S, SE-NW
Address range: 500 to 1434
Directions: N-S, SE-NW
Address range: 500 to 1434
S Western Ave
Length: 0.74 miles
Directions: N-S, SE-NW
Address range: 500 to 1313
Directions: N-S, SE-NW
Address range: 500 to 1313
S Oakley Blvd
Length: 0.60 miles
Direction: N-S
Address range: 438 to 1199
Direction: N-S
Address range: 438 to 1199
W Taylor St
Length: 0.56 miles
Direction: E-W
Address range: 2126 to 2499
Direction: E-W
Address range: 2126 to 2499
I 290 (Eisenhower Expy)
Length: 0.46 miles
Direction: E-W
Direction: E-W
S Claremont Ave
Length: 0.45 miles
Direction: N-S
Address range: 500 to 1099
Direction: N-S
Address range: 500 to 1099
S Leavitt St
Length: 0.44 miles
Directions: E-W, N-S, SE-NW
Address range: 449 to 899
Directions: E-W, N-S, SE-NW
Address range: 449 to 899
W Lexington St
Length: 0.44 miles
Directions: E-W, SW-NE
Address range: 2100 to 2537
Directions: E-W, SW-NE
Address range: 2100 to 2537
W Fillmore St
Length: 0.41 miles
Directions: E-W, SW-NE
Address range: 2200 to 2599
Directions: E-W, SW-NE
Address range: 2200 to 2599
W Roosevelt Rd
Length: 0.39 miles
Direction: E-W
Address range: 2300 to 2530
Direction: E-W
Address range: 2300 to 2530
W Grenshaw St
Length: 0.34 miles
Direction: E-W
Address range: 2330 to 2499
Direction: E-W
Address range: 2330 to 2499
S Maplewood Ave
Length: 0.26 miles
Direction: N-S
Address range: 500 to 799
Direction: N-S
Address range: 500 to 799
S Bell Ave
Length: 0.26 miles
Direction: N-S
Address range: 500 to 999
Direction: N-S
Address range: 500 to 999
S Hoyne Ave
Length: 0.25 miles
Directions: N-S, SW-NE
Address range: 500 to 799
Directions: N-S, SW-NE
Address range: 500 to 799
W Bowler St
Length: 0.21 miles
Directions: E-W, N-S, SW-NE
Address range: 2100 to 2199
Directions: E-W, N-S, SW-NE
Address range: 2100 to 2199
W Arthington St
Length: 0.17 miles
Direction: E-W
Address range: 2400 to 2499
Direction: E-W
Address range: 2400 to 2499
Evergreen Pl
Length: 0.17 miles
Directions: E-W, N-S, SE-NW
Directions: E-W, N-S, SE-NW
S Damen Ave
Length: 0.16 miles
Direction: N-S
Address range: 500 to 711
Direction: N-S
Address range: 500 to 711
W Campbell Park Dr
Length: 0.16 miles
Directions: E-W, N-S, SW-NE
Address range: 2200 to 2298
Directions: E-W, N-S, SW-NE
Address range: 2200 to 2298
W Washburne Ave
Length: 0.14 miles
Direction: E-W
Address range: 2400 to 2499
Direction: E-W
Address range: 2400 to 2499
Ogden Ave
Length: 0.09 miles
Directions: E-W, SW-NE
Directions: E-W, SW-NE
S Denvir Ave
Length: 0.08 miles
Direction: N-S
Address range: 500 to 599
Direction: N-S
Address range: 500 to 599
Leavitt St
Length: 0.03 miles
Direction: SE-NW
Direction: SE-NW
Wolcott St
Length: 0.02 miles
Direction: N-S
Direction: N-S
Railroad features:
Chicago Burlington and Quincy RR
Length: 0.01 miles
Direction: SE-NW
Direction: SE-NW