Sunland Park neighborhood in Saratoga, California (CA), 95130, 95070 detailed profile
Settings
X


Business Search - 14 Million verified businesses
Area: 0.100 square miles
Population: 598
Population density:
| Sunland Park: | 6,002 people per square mile |
| Saratoga: | 2,542 people per square mile |

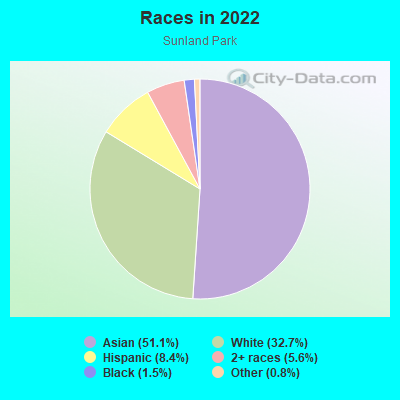
- 31151.1%Asian
- 19932.7%White
- 518.4%Hispanic or Latino
- 345.6%Two or more races
- 91.5%Black
- 50.8%Some other race
Median household income in 2022:
| Sunland Park: | $225,330 |
| Saratoga: | $237,730 |
Distribution of median household income
![Distribution of median household income]()
- 9Less than $10,000
- 8$10,000 to $19,999
- 3$20,000 to $29,999
- 14$30,000 to $39,999
- 9$40,000 to $49,999
- 7$50,000 to $59,999
- 9$60,000 to $74,999
- 8$75,000 to $99,999
- 15$100,000 to $124,999
- 7$125,000 to $149,999
- 15$150,000 to $199,999
- 136$200,000 or more

Distribution of owner-occupied house/condo value
![Distribution of owner-occupied house/condo value]()
- 7Less than $50,000
- 5$50,000 to $99,999
- 5$100,000 to $149,999
- 3$200,000 to $249,999
- 8$500,000 to $749,999
- 6$750,000 to $999,999
- 160$1,000,000 or more

Distribution of rent paid by renters
![Distribution of rent paid by renters]()
- 5$200 to $299
- 4$500 to $599
- 6$1,250 to $1,499
- 7$1,500 to $1,999
- 49$2,000 or more

| Males: | 301 |
| Females: | 297 |
Males:
| This neighborhood: | 43.8 years |
| Whole city: | 50.5 years |
| This neighborhood: | 40.5 years |
| Whole city: | 51.3 years |
Average household size:
| Sunland Park: | 2.9 people |
| Saratoga: | 2.8 people |
Percentage of family households:
| Sunland Park: | 50.7% |
| Saratoga: | 51.5% |
| Here: | 64.8% |
| Saratoga: | 77.3% |
Percentage of married-couple families with children (among all households):
| Sunland Park: | 34.7% |
| Saratoga: | 33.7% |
Percentage of single-mother households (among all households):
| Sunland Park: | 1.0% |
| Saratoga: | 1.0% |
Percentage of never married males 15 years old and over:
Percentage of never married females 15 years old and over:
| Sunland Park: | 14.6% |
| Saratoga: | 11.4% |
Percentage of never married females 15 years old and over:
| Sunland Park: | 12.2% |
| city: | 10.7% |
Percentage of people that speak English not well or not at all:
| Sunland Park: | 3.3% |
| Saratoga: | 4.5% |
Percentage of people born in this state:
Percentage of people born in another U.S. state:
Percentage of native residents but born outside the U.S.:
Percentage of foreign born residents:
| Here: | 40.9% |
| Saratoga: | 36.4% |
Percentage of people born in another U.S. state:
| Sunland Park: | 15.2% |
| Saratoga: | 18.6% |
Percentage of native residents but born outside the U.S.:
| Here: | 1.8% |
| city: | 1.1% |
Percentage of foreign born residents:
| Here: | 42.2% |
| Saratoga: | 43.9% |
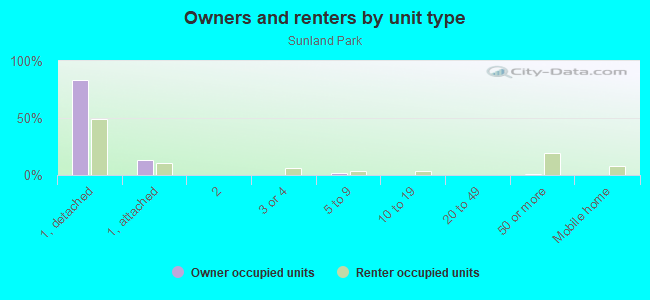
Owner-occupied
Renter-occupied

- Rooms in owner-occupied houses and condos in Sunland Park
- 11 room
- 02 rooms
- 23 rooms
- 44 rooms
- 625 rooms
- 346 rooms
- 267 rooms
- 288 rooms
- 119+ rooms
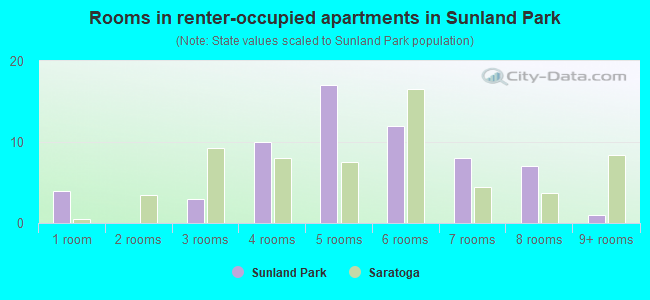
- Rooms in renter-occupied apartments in Sunland Park
- 41 room
- 02 rooms
- 33 rooms
- 104 rooms
- 175 rooms
- 126 rooms
- 87 rooms
- 78 rooms
- 19+ rooms
Owner-occupied
Renter-occupied
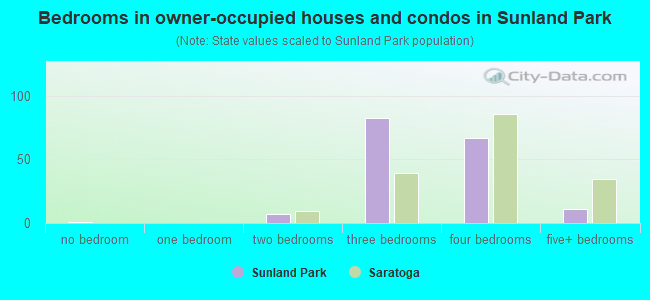
- Bedrooms in owner-occupied houses and condos in Sunland Park
- 1no bedroom
- 01 bedroom
- 72 bedrooms
- 833 bedrooms
- 674 bedrooms
- 115+ bedrooms
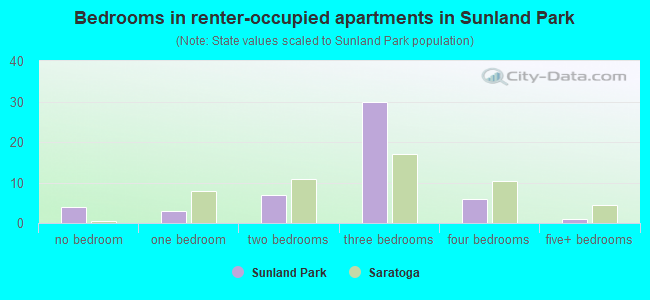
- Bedrooms in renter-occupied apartments in Sunland Park
- 4no bedroom
- 31 bedroom
- 72 bedrooms
- 303 bedrooms
- 64 bedrooms
- 15+ bedrooms
Average number of cars or other vehicles available in houses/condos:
Average number of cars or other vehicles available in apartments:
| This neighborhood: | 2.2 |
| Saratoga: | 2.4 |
Average number of cars or other vehicles available in apartments:
| Here: | 1.8 |
| city: | 1.9 |
Percentage of units with a mortgage:
| Sunland Park: | 73.5% |
| Saratoga: | 61.8% |
Average estimated value of detached houses in 2022 (85.7% of all units):
| Sunland Park: | $1,632,823 |
| California: | $988,808 |
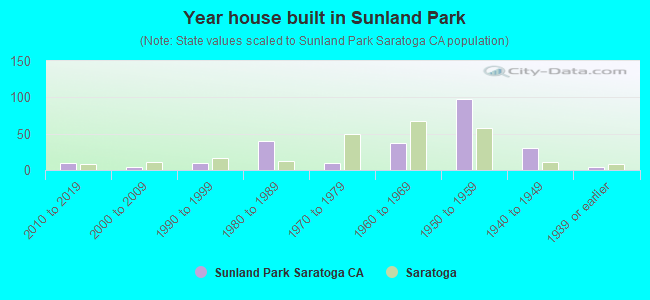
- Year house built in Sunland Park
- 02020 or later
- 92010 to 2019
- 42000 to 2009
- 91990 to 1999
- 401980 to 1989
- 101970 to 1979
- 371960 to 1969
- 981950 to 1959
- 301940 to 1949
- 41939 or earlier
City-data.com crime index for city in 2020 (higher means more crime):
| City: | 61.2 |
| U.S. average: | 219.5 |
Travel time to work (commute)
![Travel time to work (commute)]()
- 1Less than 5 minutes
- 155 to 9 minutes
- 3110 to 14 minutes
- 2515 to 19 minutes
- 3720 to 24 minutes
- 1325 to 29 minutes
- 4130 to 34 minutes
- 535 to 39 minutes
- 740 to 44 minutes
- 3145 to 59 minutes
- 460 to 89 minutes
- 290 or more minutes

Means of transportation to work
![Means of transportation to work]()
- 65.9%196Drove a car alone
- 5.4%16Carpooled
- 1.3%4Bus
- 2.0%6Long-distance train or commuter rail
- 1.3%4Motorcycle
- 2.4%7Bicycle
- 1.0%3Walked
- 1.7%5Other means
- 24.2%72Worked at home

Time leaving home to go to work
![Time leaving home to go to work]()
- 412:00 a.m. to 4:59 a.m.
- 35:00 a.m. to 5:29 a.m.
- 75:30 a.m. to 5:59 a.m.
- 56:00 a.m. to 6:29 a.m.
- 106:30 a.m. to 6:59 a.m.
- 157:00 a.m. to 7:29 a.m.
- 377:30 a.m. to 7:59 a.m.
- 358:00 a.m. to 8:29 a.m.
- 118:30 a.m. to 8:59 a.m.
- 409:00 a.m. to 9:59 a.m.
- 1510:00 a.m. to 10:59 a.m.
- 611:00 a.m. to 11:59 a.m.
- 712:00 p.m. to 3:59 p.m.
- 44:00 p.m. to 11:59 p.m.

Occupations of males:
- Percentage of males in management occupations (except farmers):
Here: 13.0% city: 26.6%
- Percentage of males in business and financial operations occupations:
Here: 7.2% city: 8.1%
- Percentage of males in computer and mathematical occupations:
Here: 28.4% city: 17.3%
- Percentage of males in architecture and engineering occupations:
Here: 13.1% city: 13.3%
- Percentage of males in education, training, and library occupations:
Here: 3.2% city: 2.7%
- Percentage of males in healthcare practitioners and technical occupations:
Here: 3.1% city: 3.7%
- Percentage of males in service occupations:
Here: 5.0% city: 4.9%
- Percentage of males in sales and office occupations:
Here: 13.2% city: 12.1%
- Percentage of males in construction, extraction, and maintenance occupations:
Here: 9.8% city: 2.6%
- Percentage of males in production occupations:
Here: 1.9% city: 1.7%
Occupations of females:
- Percentage of females in management occupations (except farmers):
Here: 8.4% city: 23.8%
- Percentage of females in business and financial operations occupations:
Here: 13.6% city: 11.5%
- Percentage of females in computer and mathematical occupations:
Here: 15.9% city: 11.2%
- Percentage of females in architecture and engineering occupations:
Here: 4.8% city: 4.6%
- Percentage of females in education, training, and library occupations:
Here: 7.7% city: 9.4%
- Percentage of females in arts, design, entertainment, sports, and media occupations:
Here: 2.1% city: 1.3%
- Percentage of females in healthcare practitioners and technical occupations:
Here: 9.9% city: 7.8%
- Percentage of females in service occupations:
Here: 22.5% city: 8.9%
- Percentage of females in sales and office occupations:
Here: 13.0% city: 14.3%
- Percentage of females in material moving occupations:
Here: 2.1% city: 0.1%
Education in this neighborhood (subdivision or community):
- Percentage of people 3 years and older in K-12 schools:
Sunland Park: 20.3% Saratoga: 18.0%
- Percentage of people 3 years and older in undergraduate colleges:
Sunland Park: 4.1% Saratoga: 3.3%
- Percentage of people 3 years and older in grad. or professional schools:
Sunland Park: 2.6% Saratoga: 1.6%
- Percentage of students K-12 enrolled in private schools:
Sunland Park: 41.5% Saratoga: 24.1%
Percentage of population below poverty level:
| Sunland Park: | 2.6% |
| Saratoga: | 3.1% |
Median year owner moved in (as recorded in 2022):
| Sunland Park: | 2006 |
| Saratoga: | 2003 |
Percentage of married-couple families with both working:
| Sunland Park: | 67.6% |
| Saratoga: | 70.6% |
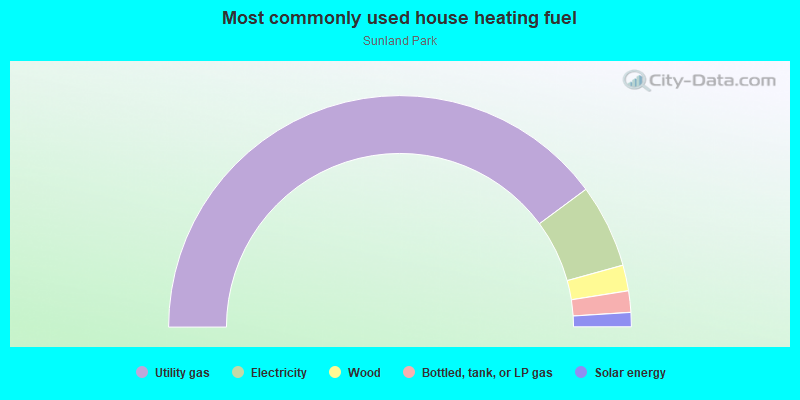
- 79.8%Utility gas
- 11.7%Electricity
- 3.6%Wood
- 3.0%Bottled, tank, or LP gas
- 2.0%Solar energy
Roads and streets:
Swarthmore Dr
Length: 0.33 miles
Directions: E-W, N-S
Address range: 18200 to 18499
Directions: E-W, N-S
Address range: 18200 to 18499
McCoy Ave
Length: 0.33 miles
Direction: E-W
Address range: 5050 to 18397
Direction: E-W
Address range: 5050 to 18397
Vanderbilt Dr
Length: 0.32 miles
Directions: E-W, N-S, SW-NE
Address range: 18200 to 18499
Directions: E-W, N-S, SW-NE
Address range: 18200 to 18499
Clemson Ave
Length: 0.32 miles
Direction: E-W
Address range: 18200 to 18499
Direction: E-W
Address range: 18200 to 18499
Baylor Ave
Length: 0.31 miles
Direction: E-W
Address range: 18200 to 18498
Direction: E-W
Address range: 18200 to 18498
Purdue Dr
Length: 0.31 miles
Directions: E-W, N-S, SE-NW
Address range: 18200 to 18499
Directions: E-W, N-S, SE-NW
Address range: 18200 to 18499
Villanova Rd
Length: 0.30 miles
Direction: N-S
Address range: 2264 to 13119
Direction: N-S
Address range: 2264 to 13119
Quito Rd
Length: 0.30 miles
Directions: N-S, SE-NW
Directions: N-S, SE-NW