Quaint Acres neighborhood in Silver Spring, Maryland (MD), 20901, 20902, 20904 detailed profile
Settings
X

Business Search - 14 Million verified businesses
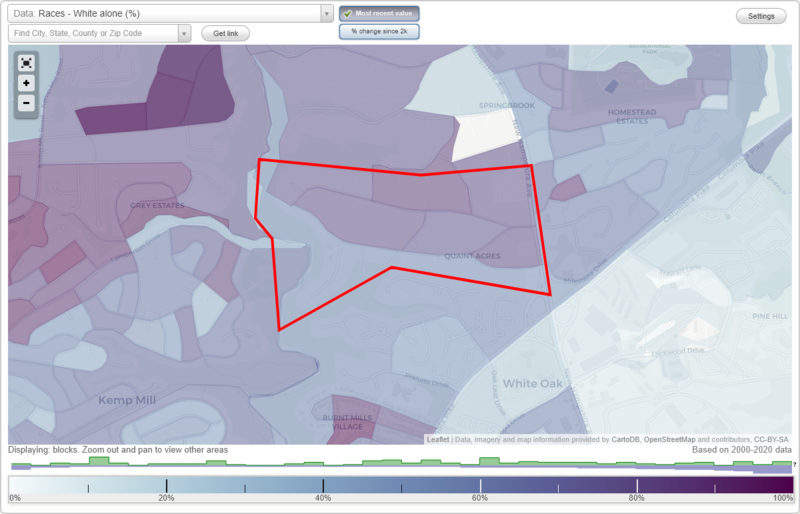
Area: 0.395 square miles
Population: 536
Population density:
| Quaint Acres: | 1,358 people per square mile |
| Silver Spring: | 7,993 people per square mile |

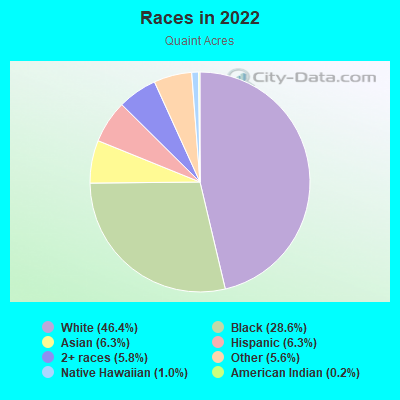
- 27446.4%White
- 16928.6%Black
- 376.3%Asian
- 376.3%Hispanic or Latino
- 345.8%Two or more races
- 335.6%Some other race
- 61.0%Native Hawaiian and Other
Pacific Islander - 10.2%American Indian
Median household income in 2022:
| Quaint Acres: | $146,915 |
| Silver Spring: | $81,557 |
Distribution of median household income
![Distribution of median household income]()
- 25Less than $10,000
- 12$10,000 to $19,999
- 15$20,000 to $29,999
- 84$30,000 to $39,999
- 119$40,000 to $49,999
- 9$50,000 to $59,999
- 17$60,000 to $74,999
- 27$75,000 to $99,999
- 15$100,000 to $124,999
- 9$125,000 to $149,999
- 43$150,000 to $199,999
- 96$200,000 or more

Distribution of owner-occupied house/condo value
![Distribution of owner-occupied house/condo value]()
- 12Less than $50,000
- 3$50,000 to $99,999
- 15$100,000 to $149,999
- 3$150,000 to $199,999
- 3$250,000 to $299,999
- 79$300,000 to $399,999
- 26$400,000 to $499,999
- 148$500,000 to $749,999
- 56$750,000 to $999,999
- 22$1,000,000 or more

Distribution of rent paid by renters
![Distribution of rent paid by renters]()
- 2$200 to $299
- 2$600 to $699
- 10$1,000 to $1,249
- 8$1,250 to $1,499
- 6$1,500 to $1,999
- 30$2,000 or more

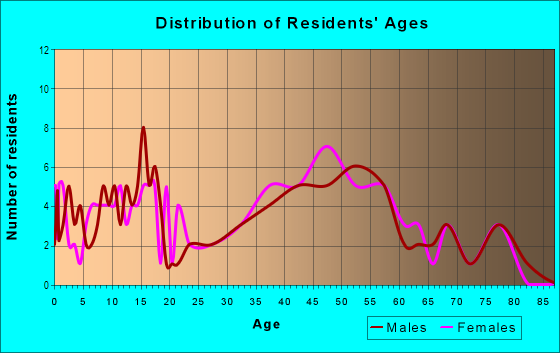
| Males: | 270 |
| Females: | 265 |
Males:
| This neighborhood: | 39.1 years |
| Whole city: | 36.7 years |
| This neighborhood: | 42.1 years |
| Whole city: | 36.5 years |
Average household size:
| Quaint Acres: | 2.9 people |
| Silver Spring: | 2.2 people |
Percentage of family households:
| Quaint Acres: | 47.0% |
| Silver Spring: | 38.8% |
| Here: | 70.2% |
| Silver Spring: | 32.5% |
Percentage of married-couple families with children (among all households):
| Quaint Acres: | 35.1% |
| Silver Spring: | 34.5% |
Percentage of single-mother households (among all households):
| Quaint Acres: | 18.7% |
| Silver Spring: | 6.6% |
Percentage of never married males 15 years old and over:
Percentage of never married females 15 years old and over:
| Quaint Acres: | 8.9% |
| Silver Spring: | 22.2% |
Percentage of never married females 15 years old and over:
| Quaint Acres: | 12.7% |
| place: | 24.3% |
Percentage of people that speak English not well or not at all:
| Quaint Acres: | 4.8% |
| Silver Spring: | 9.9% |
Percentage of people born in this state:
Percentage of people born in another U.S. state:
Percentage of native residents but born outside the U.S.:
Percentage of foreign born residents:
| Here: | 22.1% |
| Silver Spring: | 19.7% |
Percentage of people born in another U.S. state:
| Quaint Acres: | 46.2% |
| Silver Spring: | 45.9% |
Percentage of native residents but born outside the U.S.:
| Here: | 1.0% |
| place: | 2.4% |
Percentage of foreign born residents:
| Here: | 30.7% |
| Silver Spring: | 32.0% |
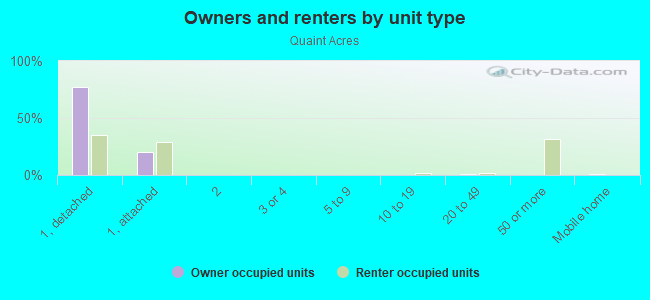
Owner-occupied
Renter-occupied

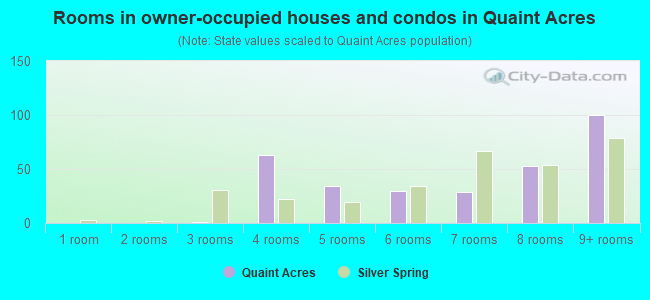
- Rooms in owner-occupied houses and condos in Quaint Acres
- 01 room
- 02 rooms
- 13 rooms
- 634 rooms
- 345 rooms
- 306 rooms
- 297 rooms
- 538 rooms
- 1009+ rooms
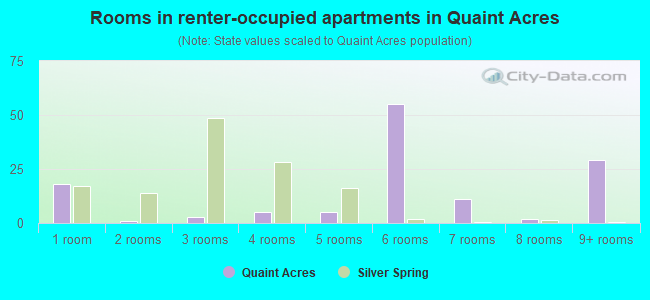
- Rooms in renter-occupied apartments in Quaint Acres
- 181 room
- 12 rooms
- 33 rooms
- 54 rooms
- 55 rooms
- 556 rooms
- 117 rooms
- 28 rooms
- 299+ rooms
Owner-occupied
Renter-occupied
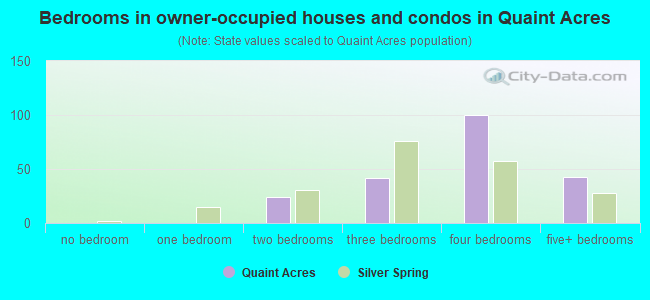
- Bedrooms in owner-occupied houses and condos in Quaint Acres
- 0no bedroom
- 01 bedroom
- 242 bedrooms
- 423 bedrooms
- 1004 bedrooms
- 435+ bedrooms
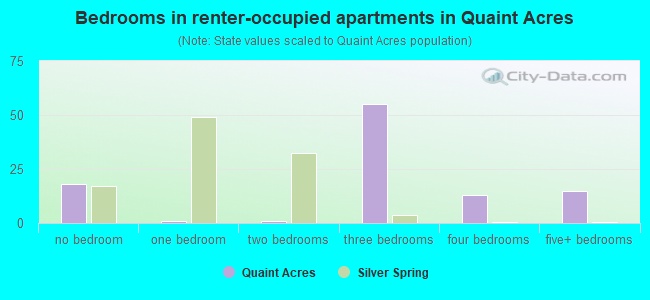
- Bedrooms in renter-occupied apartments in Quaint Acres
- 18no bedroom
- 11 bedroom
- 12 bedrooms
- 553 bedrooms
- 134 bedrooms
- 155+ bedrooms
Average number of cars or other vehicles available in houses/condos:
Average number of cars or other vehicles available in apartments:
| This neighborhood: | 2.1 |
| Silver Spring: | 1.7 |
Average number of cars or other vehicles available in apartments:
| Here: | |
| place: |
Percentage of units with a mortgage:
| Quaint Acres: | 65.6% |
| Silver Spring: | 76.3% |
Average estimated value of detached houses in 2022 (100.0% of all units):
| Quaint Acres: | $619,327 |
| Maryland: | $526,819 |
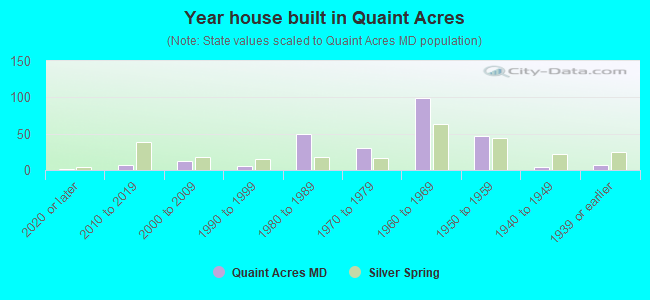
- Year house built in Quaint Acres
- 12020 or later
- 72010 to 2019
- 132000 to 2009
- 61990 to 1999
- 501980 to 1989
- 301970 to 1979
- 991960 to 1969
- 471950 to 1959
- 41940 to 1949
- 71939 or earlier
Travel time to work (commute)
![Travel time to work (commute)]()
- 3Less than 5 minutes
- 205 to 9 minutes
- 1810 to 14 minutes
- 1415 to 19 minutes
- 3220 to 24 minutes
- 3825 to 29 minutes
- 6230 to 34 minutes
- 1435 to 39 minutes
- 2840 to 44 minutes
- 2845 to 59 minutes
- 5160 to 89 minutes
- 1290 or more minutes

Means of transportation to work
![Means of transportation to work]()
- 37.2%97Drove a car alone
- 8.4%22Carpooled
- 0.8%2Bus
- 13.4%35Subway or elevated rail
- 0.8%2Long-distance train or commuter rail
- 4.6%12Taxi
- 0.8%2Bicycle
- 8.8%23Walked
- 5.0%13Other means
- 34.5%90Worked at home

Time leaving home to go to work
![Time leaving home to go to work]()
- 95:00 a.m. to 5:29 a.m.
- 95:30 a.m. to 5:59 a.m.
- 366:00 a.m. to 6:29 a.m.
- 226:30 a.m. to 6:59 a.m.
- 837:00 a.m. to 7:29 a.m.
- 277:30 a.m. to 7:59 a.m.
- 638:00 a.m. to 8:29 a.m.
- 348:30 a.m. to 8:59 a.m.
- 329:00 a.m. to 9:59 a.m.
- 210:00 a.m. to 10:59 a.m.
- 711:00 a.m. to 11:59 a.m.
- 1612:00 p.m. to 3:59 p.m.
- 224:00 p.m. to 11:59 p.m.

Occupations of males:
- Percentage of males in management occupations (except farmers):
Here: 14.3% place: 11.4%
- Percentage of males in business and financial operations occupations:
Here: 12.5% place: 6.8%
- Percentage of males in computer and mathematical occupations:
Here: 7.7% place: 9.4%
- Percentage of males in architecture and engineering occupations:
Here: 3.3% place: 4.5%
- Percentage of males in life, physical, and social science occupations:
Here: 9.1% place: 5.3%
- Percentage of males in community and social services occupations:
Here: 1.8% place: 1.2%
- Percentage of males in legal occupations:
Here: 8.2% place: 3.6%
- Percentage of males in education, training, and library occupations:
Here: 2.6% place: 6.2%
- Percentage of males in arts, design, entertainment, sports, and media occupations:
Here: 4.2% place: 3.9%
- Percentage of males in healthcare practitioners and technical occupations:
Here: 18.5% place: 2.5%
- Percentage of males in service occupations:
Here: 9.7% place: 10.9%
- Percentage of males in sales and office occupations:
Here: 18.3% place: 9.6%
- Percentage of males in production occupations:
Here: 4.5% place: 2.2%
- Percentage of males in transportation occupations:
Here: 10.9% place: 6.4%
Occupations of females:
- Percentage of females in business and financial operations occupations:
Here: 13.1% place: 8.9%
- Percentage of females in computer and mathematical occupations:
Here: 6.6% place: 5.0%
- Percentage of females in architecture and engineering occupations:
Here: 2.2% place: 1.3%
- Percentage of females in life, physical, and social science occupations:
Here: 11.1% place: 3.4%
- Percentage of females in community and social services occupations:
Here: 12.8% place: 2.9%
- Percentage of females in legal occupations:
Here: 11.7% place: 4.2%
- Percentage of females in education, training, and library occupations:
Here: 15.6% place: 11.2%
- Percentage of females in arts, design, entertainment, sports, and media occupations:
Here: 6.9% place: 4.5%
- Percentage of females in healthcare practitioners and technical occupations:
Here: 5.0% place: 5.3%
- Percentage of females in service occupations:
Here: 12.2% place: 20.4%
- Percentage of females in sales and office occupations:
Here: 11.3% place: 16.7%
- Percentage of females in construction, extraction, and maintenance occupations:
Here: 3.0% place: 0.4%
- Percentage of females in production occupations:
Here: 1.6% place: 0.9%
- Percentage of females in transportation occupations:
Here: 4.3% place: 0.6%
Percentage of people 16-64 in Armed Forces:
| Quaint Acres: | 0.1% |
| Silver Spring: | 0.4% |
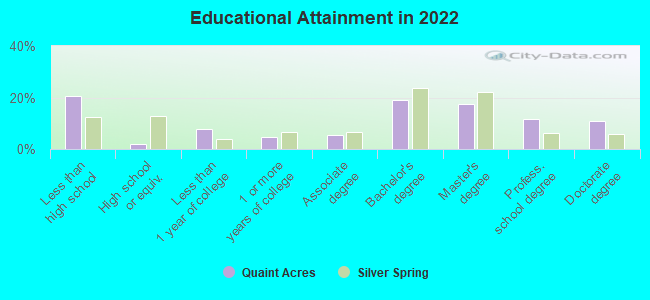
Education in this neighborhood (subdivision or community):
- Percentage of people 3 years and older in K-12 schools:
Quaint Acres: 19.7% Silver Spring: 14.1%
- Percentage of people 3 years and older in undergraduate colleges:
Quaint Acres: 7.9% Silver Spring: 3.4%
- Percentage of people 3 years and older in grad. or professional schools:
Quaint Acres: 1.7% Silver Spring: 2.0%
- Percentage of students K-12 enrolled in private schools:
Quaint Acres: 133.3% Silver Spring: 12.6%
Percentage of population below poverty level:
| Quaint Acres: | 4.4% |
| Silver Spring: | 11.0% |
Median year owner moved in (as recorded in 2022):
| Quaint Acres: | 2006 |
| Silver Spring: | 2011 |
Percentage of married-couple families with both working:
| Quaint Acres: | 93.1% |
| Silver Spring: | 80.2% |
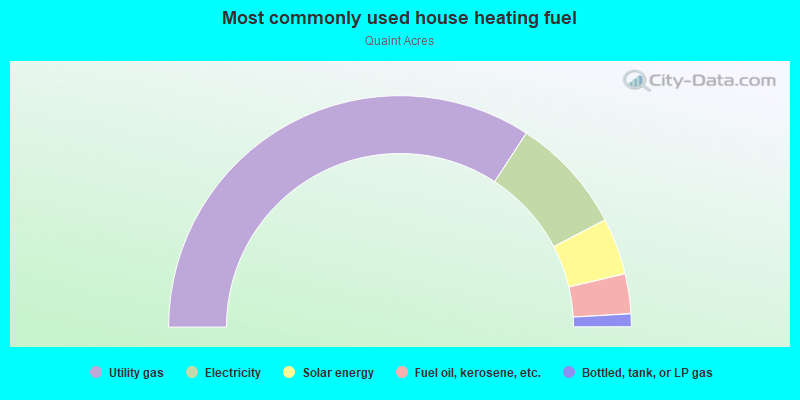
- 68.4%Utility gas
- 16.3%Electricity
- 7.9%Solar energy
- 5.6%Fuel oil, kerosene, etc.
- 1.8%Bottled, tank, or LP gas
Highways in this neighborhood:
New Hampshire Ave (State Hwy 650)
Length: 0.37 miles
Direction: N-S
Address range: 11500 to 11899
Direction: N-S
Address range: 11500 to 11899
Roads and streets:
Quaint Acres Dr
Length: 1.12 miles
Directions: E-W, SW-NE
Address range: 1 to 899
Directions: E-W, SW-NE
Address range: 1 to 899
Apple Grove Rd
Length: 1.03 miles
Directions: E-W, SE-NW, SW-NE
Address range: 1 to 799
Directions: E-W, SE-NW, SW-NE
Address range: 1 to 799
Milestone Dr
Length: 0.34 miles
Directions: E-W, SE-NW
Address range: 700 to 902
Directions: E-W, SE-NW
Address range: 700 to 902
Berwick Rd
Length: 0.29 miles
Directions: N-S, SW-NE
Address range: 11700 to 11799
Directions: N-S, SW-NE
Address range: 11700 to 11799
Michale Ct
Length: 0.25 miles
Directions: N-S, SW-NE
Address range: 11500 to 11699
Directions: N-S, SW-NE
Address range: 11500 to 11699
Gordon Rd
Length: 0.12 miles
Directions: N-S, SE-NW
Address range: 11800 to 11858
Directions: N-S, SE-NW
Address range: 11800 to 11858
Stephen Rd
Length: 0.09 miles
Directions: N-S, SE-NW
Address range: 11500 to 11699
Directions: N-S, SE-NW
Address range: 11500 to 11699
Carole Ct
Length: 0.06 miles
Directions: E-W, SE-NW
Address range: 1 to 99
Directions: E-W, SE-NW
Address range: 1 to 99