Pavonia neighborhood in Jersey City, New Jersey (NJ), 07302, 07310 detailed profile
Settings
X


Business Search - 14 Million verified businesses
Area: 1.104 square miles
Population: 41,579
Population density:
| Pavonia: | 37,672 people per square mile |
| Jersey City: | 19,218 people per square mile |

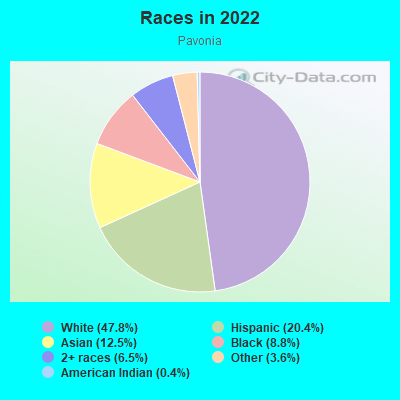
- 20,16547.8%White
- 8,57820.4%Hispanic or Latino
- 5,28112.5%Asian
- 3,7208.8%Black
- 2,7316.5%Two or more races
- 1,5113.6%Some other race
- 1640.4%American Indian
Median household income in 2022:
| Pavonia: | $135,809 |
| Jersey City: | $94,080 |
Distribution of median household income
![Distribution of median household income]()
- 800Less than $10,000
- 702$10,000 to $19,999
- 2,766$20,000 to $29,999
- 1,156$30,000 to $39,999
- 2,024$40,000 to $49,999
- 763$50,000 to $59,999
- 1,370$60,000 to $74,999
- 1,735$75,000 to $99,999
- 2,183$100,000 to $124,999
- 1,933$125,000 to $149,999
- 2,100$150,000 to $199,999
- 7,216$200,000 or more

Distribution of owner-occupied house/condo value
![Distribution of owner-occupied house/condo value]()
- 611$200,000 to $249,999
- 153$250,000 to $299,999
- 549$300,000 to $399,999
- 526$400,000 to $499,999
- 1,955$500,000 to $749,999
- 1,981$750,000 to $999,999
- 3,327$1,000,000 or more

Distribution of rent paid by renters
![Distribution of rent paid by renters]()
- 1,101$600 to $699
- 840$800 to $899
- 749$900 to $999
- 1,079$1,000 to $1,249
- 3,346$1,250 to $1,499
- 2,697$1,500 to $1,999
- 6,605$2,000 or more

Median rent in 2022:
| Pavonia: | $2,017 |
| Jersey City: | $1,738 |
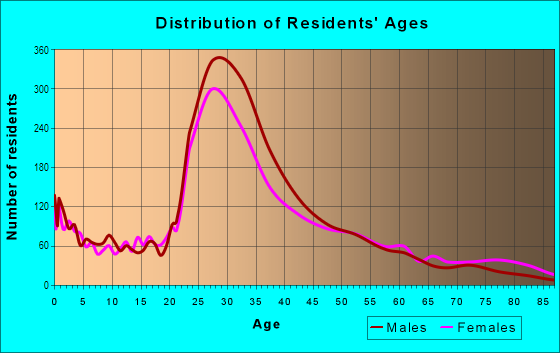
| Males: | 22,875 |
| Females: | 18,704 |
Males:
| This neighborhood: | 33.6 years |
| Whole city: | 34.1 years |
| This neighborhood: | 36.0 years |
| Whole city: | 36.2 years |
Average household size:
| Pavonia: | 2.1 people |
| Jersey City: | 2.2 people |
Percentage of family households:
| Pavonia: | 43.4% |
| Jersey City: | 39.8% |
| Here: | 38.4% |
| Jersey City: | 34.2% |
Percentage of married-couple families with children (among all households):
| Pavonia: | 40.3% |
| Jersey City: | 29.4% |
Percentage of single-mother households (among all households):
| Pavonia: | 11.5% |
| Jersey City: | 13.3% |
Percentage of never married males 15 years old and over:
Percentage of never married females 15 years old and over:
| Pavonia: | 26.6% |
| Jersey City: | 23.6% |
Percentage of never married females 15 years old and over:
| Pavonia: | 18.4% |
| city: | 22.6% |
Percentage of people that speak English not well or not at all:
| Pavonia: | 4.5% |
| Jersey City: | 7.2% |
Percentage of people born in this state:
Percentage of people born in another U.S. state:
Percentage of native residents but born outside the U.S.:
Percentage of foreign born residents:
| Here: | 26.6% |
| Jersey City: | 34.5% |
Percentage of people born in another U.S. state:
| Pavonia: | 46.7% |
| Jersey City: | 22.1% |
Percentage of native residents but born outside the U.S.:
| Here: | 1.2% |
| city: | 3.8% |
Percentage of foreign born residents:
| Here: | 25.6% |
| Jersey City: | 39.6% |
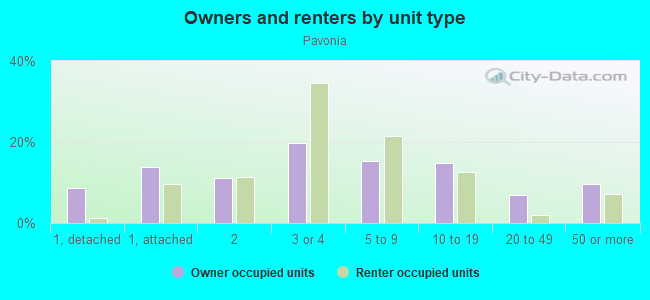
Owner-occupied
Renter-occupied

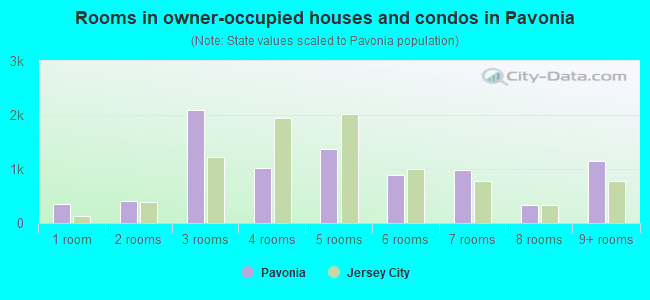
- Rooms in owner-occupied houses and condos in Pavonia
- 3431 room
- 4102 rooms
- 2,0973 rooms
- 1,0234 rooms
- 1,3735 rooms
- 8976 rooms
- 9817 rooms
- 3378 rooms
- 1,1449+ rooms
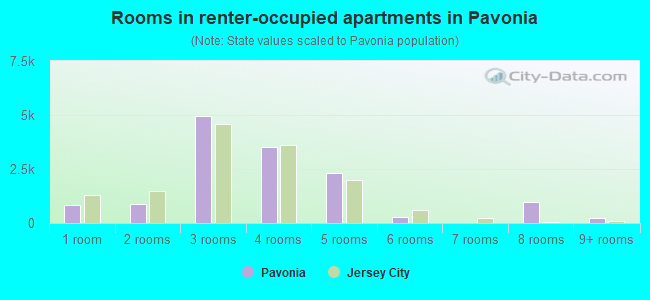
- Rooms in renter-occupied apartments in Pavonia
- 8141 room
- 8882 rooms
- 4,9333 rooms
- 3,5034 rooms
- 2,2975 rooms
- 2926 rooms
- 07 rooms
- 9828 rooms
- 2139+ rooms
Owner-occupied
Renter-occupied
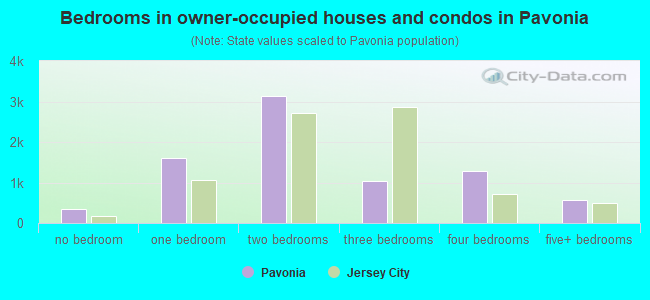
- Bedrooms in owner-occupied houses and condos in Pavonia
- 343no bedroom
- 1,6161 bedroom
- 3,1452 bedrooms
- 1,0483 bedrooms
- 1,2894 bedrooms
- 5695+ bedrooms
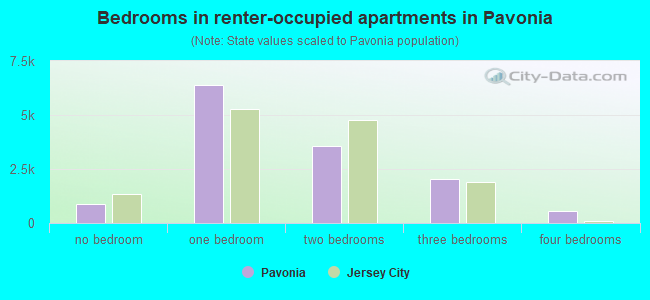
- Bedrooms in renter-occupied apartments in Pavonia
- 901no bedroom
- 6,3691 bedroom
- 3,5472 bedrooms
- 2,0543 bedrooms
- 5724 bedrooms
- 05+ bedrooms
Average number of cars or other vehicles available in houses/condos:
Average number of cars or other vehicles available in apartments:
| This neighborhood: | 0.9 |
| Jersey City: | 1.3 |
Average number of cars or other vehicles available in apartments:
| Here: | 0.8 |
| city: | 0.6 |
Percentage of units with a mortgage:
| Pavonia: | 79.9% |
| Jersey City: | 69.4% |
Housing prices:
- Average estimated value of detached houses in 2022 (4.2% of all units):
Pavonia: $1,172,476 Jersey City: $732,576
- Average estimated value of townhouses or other attached units in 2022 (11.8% of all units):
This neighborhood: $2,180,147 city: $695,567
- Average estimated value of housing units in 2-unit structures in 2022 (14.2% of all units):
This neighborhood: $819,975 Jersey City: $571,976
- Average estimated '22 value of housing units in 3-to-4-unit structures (33.9% of all units):
Pavonia: $605,741 city: $581,467
- Average estimated '22 value of housing units in 5-or-more-unit structures (6.2% of all units):
Pavonia: $809,562 Jersey City: $666,445
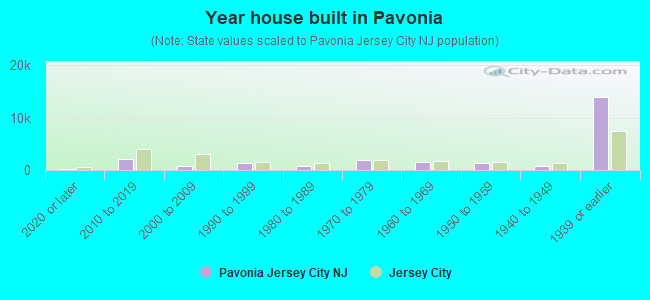
- Year house built in Pavonia
- 2212020 or later
- 2,0982010 to 2019
- 7572000 to 2009
- 1,2921990 to 1999
- 8161980 to 1989
- 1,8161970 to 1979
- 1,5131960 to 1969
- 1,2751950 to 1959
- 7321940 to 1949
- 13,8661939 or earlier
City-data.com crime index for city in 2020 (higher means more crime):
| City: | 198.8 |
| U.S. average: | 219.5 |
Travel time to work (commute)
![Travel time to work (commute)]()
- 177Less than 5 minutes
- 1855 to 9 minutes
- 1,20810 to 14 minutes
- 1,17715 to 19 minutes
- 3,15120 to 24 minutes
- 1,09725 to 29 minutes
- 3,49330 to 34 minutes
- 1,86135 to 39 minutes
- 2,53140 to 44 minutes
- 6,18345 to 59 minutes
- 3,84860 to 89 minutes
- 1,26490 or more minutes

Means of transportation to work
![Means of transportation to work]()
- 22.9%6,784Drove a car alone
- 5.3%1,570Carpooled
- 2.4%697Bus
- 34.8%10,330Subway or elevated rail
- 10.3%3,063Long-distance train or commuter rail
- 3.0%887Light rail, streetcar or trolley
- 0.6%188Ferryboat
- 5.1%1,525Taxi
- 1.0%307Bicycle
- 8.2%2,429Walked
- 1.5%434Other means
- 22.4%6,642Worked at home

Time leaving home to go to work
![Time leaving home to go to work]()
- 49312:00 a.m. to 4:59 a.m.
- 4835:30 a.m. to 5:59 a.m.
- 1,5856:00 a.m. to 6:29 a.m.
- 1,1926:30 a.m. to 6:59 a.m.
- 3,1807:00 a.m. to 7:29 a.m.
- 2,9757:30 a.m. to 7:59 a.m.
- 5,8728:00 a.m. to 8:29 a.m.
- 4,6288:30 a.m. to 8:59 a.m.
- 3,4889:00 a.m. to 9:59 a.m.
- 47710:00 a.m. to 10:59 a.m.
- 76711:00 a.m. to 11:59 a.m.
- 67412:00 p.m. to 3:59 p.m.
- 5624:00 p.m. to 11:59 p.m.

Occupations of males:
- Percentage of males in management occupations (except farmers):
Here: 20.0% city: 12.9%
- Percentage of males in business and financial operations occupations:
Here: 11.2% city: 9.9%
- Percentage of males in computer and mathematical occupations:
Here: 9.1% city: 13.5%
- Percentage of males in architecture and engineering occupations:
Here: 2.0% city: 3.7%
- Percentage of males in legal occupations:
Here: 2.8% city: 1.8%
- Percentage of males in education, training, and library occupations:
Here: 10.0% city: 3.6%
- Percentage of males in arts, design, entertainment, sports, and media occupations:
Here: 14.3% city: 3.5%
- Percentage of males in healthcare practitioners and technical occupations:
Here: 1.1% city: 2.6%
- Percentage of males in service occupations:
Here: 5.1% city: 10.4%
- Percentage of males in sales and office occupations:
Here: 18.2% city: 13.4%
- Percentage of males in construction, extraction, and maintenance occupations:
Here: 1.6% city: 5.6%
- Percentage of males in transportation occupations:
Here: 2.2% city: 7.2%
- Percentage of males in material moving occupations:
Here: 1.5% city: 4.2%
Occupations of females:
- Percentage of females in management occupations (except farmers):
Here: 16.7% city: 11.5%
- Percentage of females in business and financial operations occupations:
Here: 10.4% city: 11.7%
- Percentage of females in computer and mathematical occupations:
Here: 4.6% city: 5.3%
- Percentage of females in architecture and engineering occupations:
Here: 2.0% city: 1.1%
- Percentage of females in life, physical, and social science occupations:
Here: 2.7% city: 1.1%
- Percentage of females in legal occupations:
Here: 5.2% city: 2.6%
- Percentage of females in education, training, and library occupations:
Here: 12.0% city: 8.3%
- Percentage of females in arts, design, entertainment, sports, and media occupations:
Here: 6.9% city: 4.9%
- Percentage of females in healthcare practitioners and technical occupations:
Here: 10.5% city: 6.5%
- Percentage of females in service occupations:
Here: 7.6% city: 17.9%
- Percentage of females in sales and office occupations:
Here: 18.9% city: 21.2%
- Percentage of females in material moving occupations:
Here: 1.7% city: 1.8%
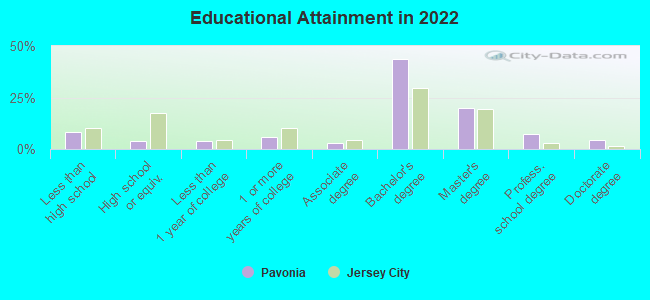
Education in this neighborhood (subdivision or community):
- Percentage of people 3 years and older in K-12 schools:
Pavonia: 16.1% Jersey City: 12.9%
- Percentage of people 3 years and older in undergraduate colleges:
Pavonia: 5.8% Jersey City: 4.5%
- Percentage of people 3 years and older in grad. or professional schools:
Pavonia: 4.0% Jersey City: 2.2%
- Percentage of students K-12 enrolled in private schools:
Pavonia: 44.1% Jersey City: 10.8%
Percentage of population below poverty level:
| Pavonia: | 4.1% |
| Jersey City: | 12.8% |
Median year owner moved in (as recorded in 2022):
Median year renter moved in (as recorded in 2022):
| Pavonia: | 2014 |
| Jersey City: | 2010 |
Median year renter moved in (as recorded in 2022):
| Pavonia: | 2017 |
| Jersey City: | 2019 |
Percentage of married-couple families with both working:
| Pavonia: | 84.8% |
| Jersey City: | 63.9% |
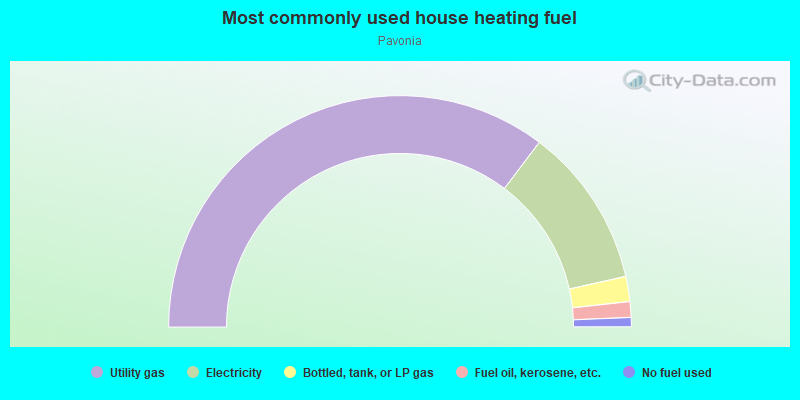
- 70.6%Utility gas
- 22.4%Electricity
- 3.5%Bottled, tank, or LP gas
- 2.2%Fuel oil, kerosene, etc.
- 1.3%No fuel used
Limited-access highways (interstate or state) in this neighborhood:
I- 78
Length: 2.62 miles
Directions: E-W, SE-NW, SW-NE
Directions: E-W, SE-NW, SW-NE
State Rte 139 (Nj 139 Upper)
Length: 0.40 miles
Direction: E-W
Direction: E-W
State Rte 139 (Nj 139 Lower)
Length: 0.08 miles
Direction: E-W
Direction: E-W
Roads and streets:
6th St
Length: 1.13 miles
Direction: E-W
Address range: 100 to 384
Direction: E-W
Address range: 100 to 384
Coles St
Length: 0.84 miles
Direction: N-S
Address range: 37 to 399
Direction: N-S
Address range: 37 to 399
Luis Munoz Marin Blvd (Henderson St)
Length: 0.84 miles
Direction: N-S
Address range: 381 to 649
Direction: N-S
Address range: 381 to 649
9th St
Length: 0.81 miles
Direction: E-W
Address range: 139 to 386
Direction: E-W
Address range: 139 to 386
Co Rd 630 (8th St)
Length: 0.80 miles
Direction: E-W
Address range: 157 to 402
Direction: E-W
Address range: 157 to 402
7th St
Length: 0.80 miles
Direction: E-W
Address range: 143 to 390
Direction: E-W
Address range: 143 to 390
Co Rd 635 (Grove St)
Length: 0.79 miles
Direction: N-S
Address range: 2 to 655
Direction: N-S
Address range: 2 to 655
Co Rd 631 (Jersey Ave)
Length: 0.76 miles
Direction: N-S
Address range: 563 to 846
Direction: N-S
Address range: 563 to 846
Co Rd 633 (Erie St)
Length: 0.74 miles
Direction: N-S
Address range: 39 to 298
Direction: N-S
Address range: 39 to 298
2nd St
Length: 0.73 miles
Direction: E-W
Address range: 102 to 346
Direction: E-W
Address range: 102 to 346
5th St
Length: 0.69 miles
Direction: E-W
Address range: 100 to 368
Direction: E-W
Address range: 100 to 368
4th St (Co Rd 628)
Length: 0.69 miles
Direction: E-W
Address range: 101 to 368
Direction: E-W
Address range: 101 to 368
10th St
Length: 0.69 miles
Direction: E-W
Address range: 152 to 357
Direction: E-W
Address range: 152 to 357
18th St
Length: 0.65 miles
Directions: E-W, N-S, SE-NW
Address range: 125 to 300
Directions: E-W, N-S, SE-NW
Address range: 125 to 300
14th St
Length: 0.59 miles
Directions: E-W, N-S
Address range: 100 to 330
Directions: E-W, N-S
Address range: 100 to 330
Pavonia Ave
Length: 0.59 miles
Directions: E-W, N-S, SE-NW
Address range: 90 to 499
Directions: E-W, N-S, SE-NW
Address range: 90 to 499
Monmouth St
Length: 0.59 miles
Direction: N-S
Address range: 397 to 544
Direction: N-S
Address range: 397 to 544
11th St
Length: 0.58 miles
Direction: E-W
Direction: E-W
3rd St (Co Rd 626)
Length: 0.58 miles
Direction: E-W
Address range: 113 to 325
Direction: E-W
Address range: 113 to 325
16th St
Length: 0.57 miles
Direction: E-W
Address range: 160 to 399
Direction: E-W
Address range: 160 to 399
Washington Blvd
Length: 0.56 miles
Directions: N-S, SW-NE
Address range: 1 to 613
Directions: N-S, SW-NE
Address range: 1 to 613
15th St
Length: 0.51 miles
Directions: E-W, N-S
Address range: 162 to 300
Directions: E-W, N-S
Address range: 162 to 300
Provost St
Length: 0.44 miles
Direction: N-S
Address range: 113 to 253
Direction: N-S
Address range: 113 to 253
Co Rd 629 (Brunswick St)
Length: 0.35 miles
Direction: N-S
Address range: 167 to 277
Direction: N-S
Address range: 167 to 277
13th St
Length: 0.32 miles
Direction: E-W
Address range: 1 to 330
Direction: E-W
Address range: 1 to 330
12th St
Length: 0.23 miles
Direction: E-W
Address range: 100 to 399
Direction: E-W
Address range: 100 to 399
17th St
Length: 0.21 miles
Direction: E-W
Address range: 247 to 399
Direction: E-W
Address range: 247 to 399
Newport Pkwy
Length: 0.20 miles
Direction: E-W
Direction: E-W
River Dr S
Length: 0.18 miles
Direction: N-S
Direction: N-S
Mall Dr E
Length: 0.13 miles
Directions: E-W, N-S
Address range: 1 to 99
Directions: E-W, N-S
Address range: 1 to 99
Division St
Length: 0.11 miles
Direction: N-S
Address range: 1 to 99
Direction: N-S
Address range: 1 to 99
Greene St
Length: 0.11 miles
Direction: E-W
Direction: E-W
Washington St
Length: 0.10 miles
Directions: N-S, SW-NE
Address range: 6555 to 55239
Directions: N-S, SW-NE
Address range: 6555 to 55239
Co Rd 729 (W Hamilton Pl)
Length: 0.10 miles
Direction: N-S
Address range: 1 to 99
Direction: N-S
Address range: 1 to 99
Co Rd 730 (E Hamilton Pl, McWilliams Pl)
Length: 0.10 miles
Direction: N-S
Address range: 1 to 42
Direction: N-S
Address range: 1 to 42
River Ct
Length: 0.10 miles
Direction: E-W
Direction: E-W
Mall Dr W
Length: 0.06 miles
Direction: N-S
Address range: 1 to 99
Direction: N-S
Address range: 1 to 99
Manila Ave (Co Rd 635)
Length: 0.05 miles
Direction: N-S
Address range: 400 to 522
Direction: N-S
Address range: 400 to 522
Newark Ave (Co Rd 639)
Length: 0.04 miles
Direction: SE-NW
Direction: SE-NW
Bademann Pl (Rademann Pl)
Length: 0.03 miles
Direction: N-S
Address range: 1 to 16
Direction: N-S
Address range: 1 to 16
Railroad features:
Norfolk Southern Rlwy
Length: 0.47 miles
Directions: E-W, SE-NW
Directions: E-W, SE-NW
Other features:
Hudson Riv
Length: 0.02 miles
Direction: E-W
Direction: E-W